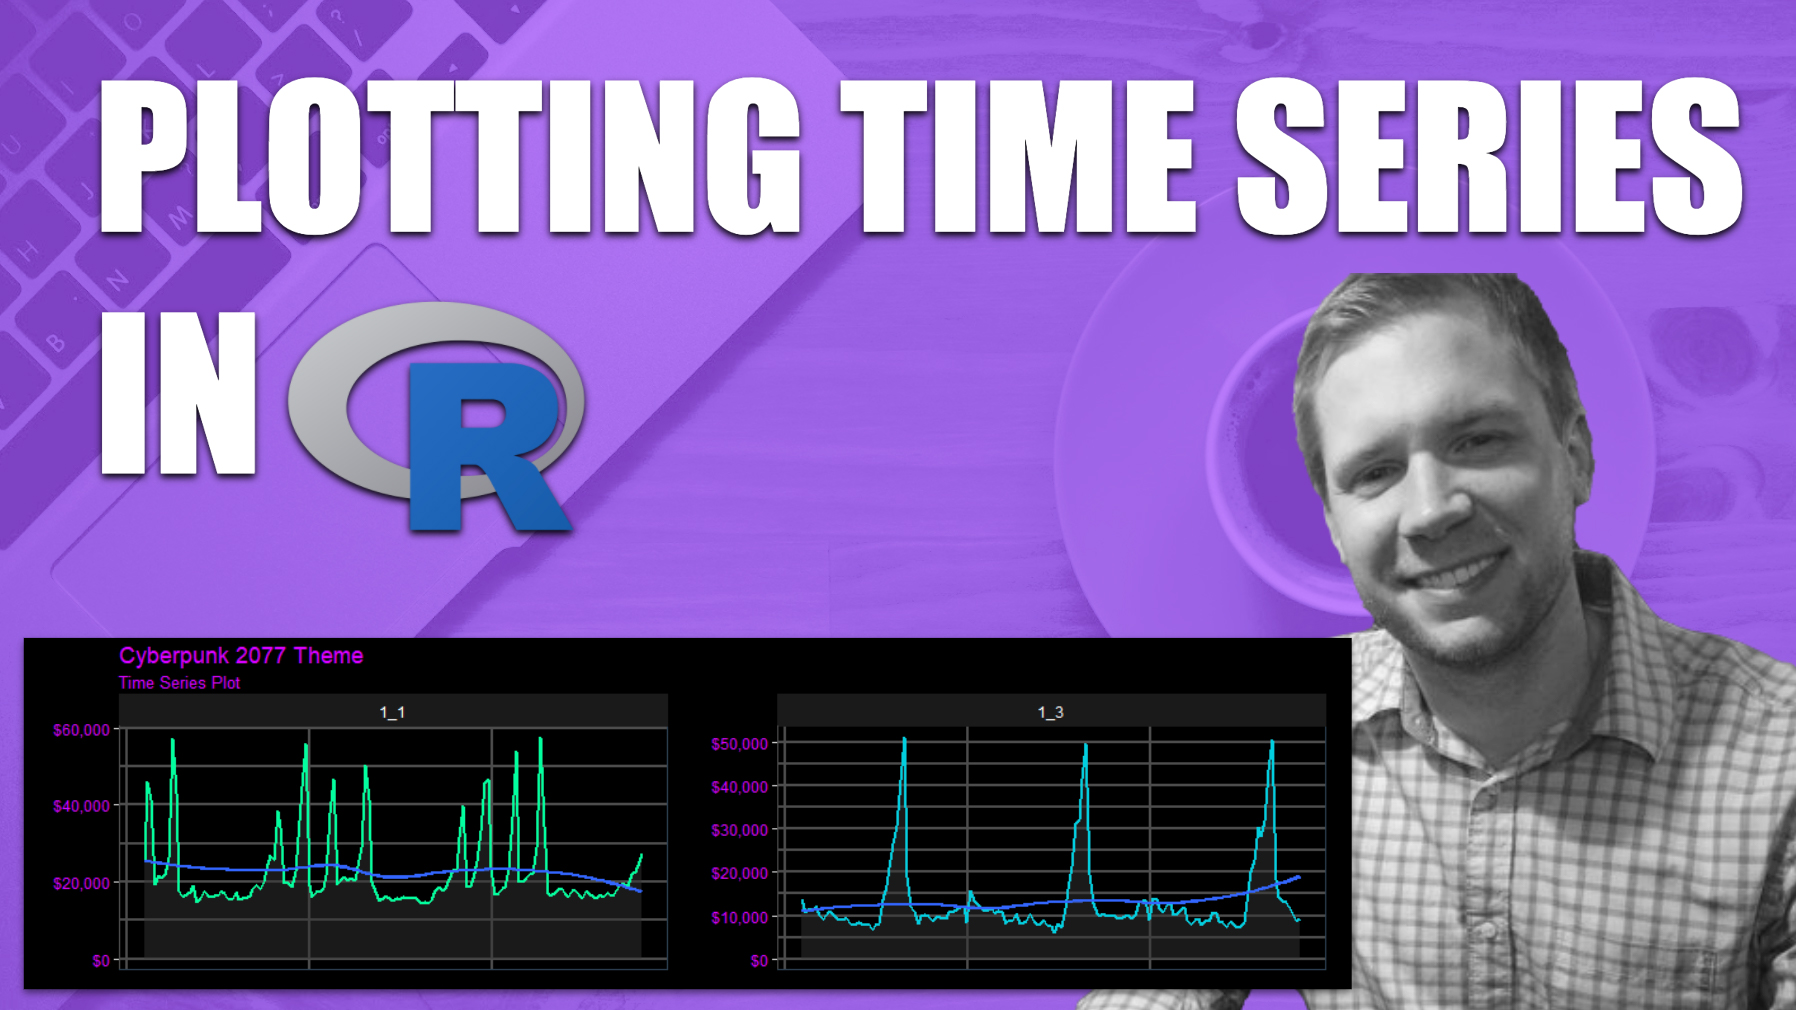
Plotting Time Series in R (New Cyberpunk Theme)
Written by Matt Dancho
This article is part of a R-Tips Weekly, a weekly video tutorial that shows you step-by-step how to do common R coding tasks.
One of the most common data science visualization is a Time Series plot. In this tutorial we’ll learn how to plot time series using ggplot, plotly and timetk.
Here are the links to get set up. 👇
Making a Cyberpunk themed Time Series Plot
It’s super-easy to make a basic time series plot with timetk::plot_time_series(). But did you know you can customize it!
Here’s how to make a Cyberpunk 2077-themed ggplot.
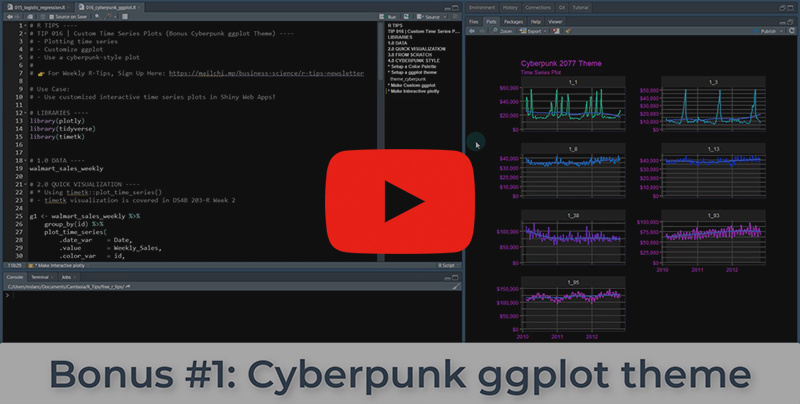 (Click image to play tutorial)
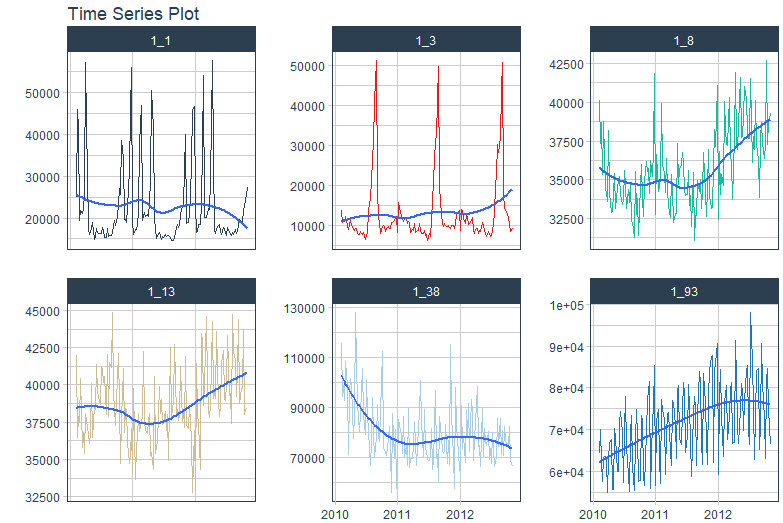
Step 1
Make a basic plot with timetk::plot_time_series(). Set .interactive = FALSE to return a i object.
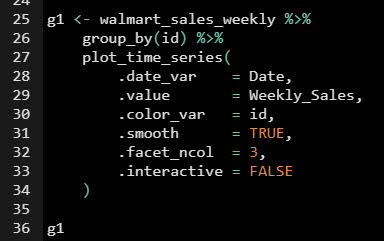 Full code in the video Github Repository
Step 2
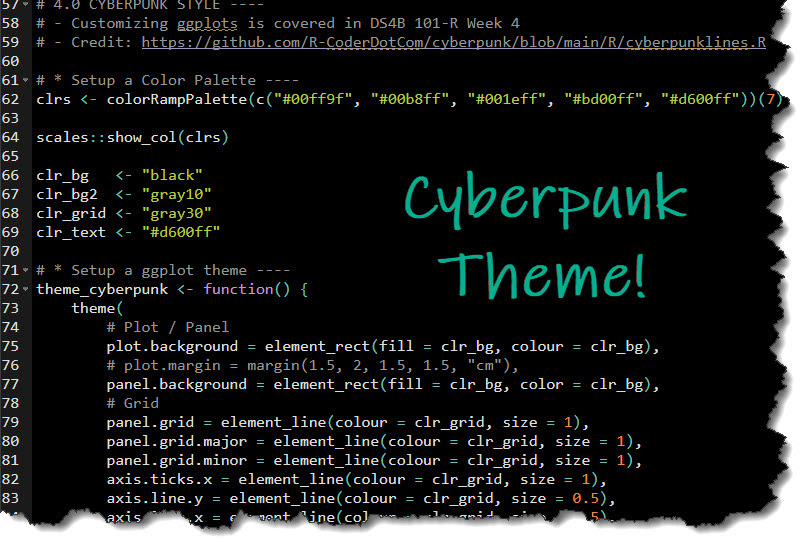
Create a Cyberpunk theme: Pick the colors and simply add to the theme_cyberpunk() ggplot2 theme function.
 Full code in the video Github Repository
Step 3
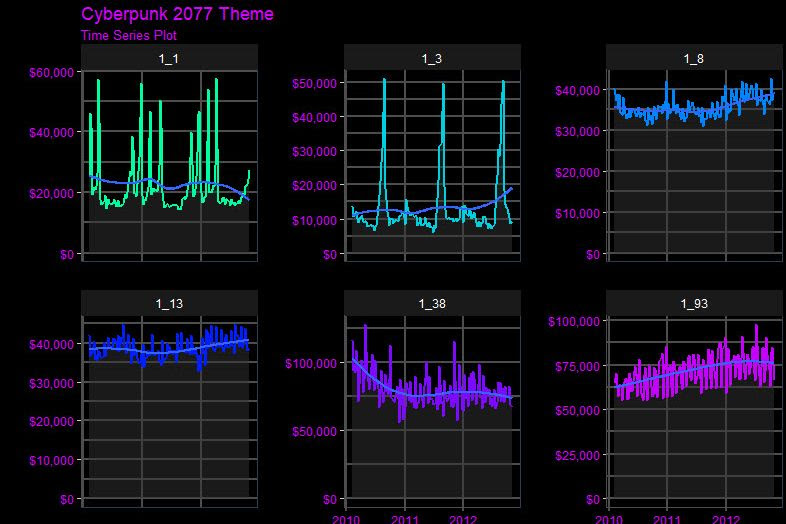
Customize! Apply ggplot geom and scale functions along with the previously created theme_cyberpunk() to make a stunning time-series visualization!
 Full code in the video Github Repository
Your ggplot skills are amazing. Santa approves. 👇

But if you really want to improve your productivity…
Here’s how to master R programming and become powered by R. 👇
What happens after you learn R for Business.

Your Job Performance Review after you’ve launched your first Shiny App. 👇

This is career acceleration.
SETUP R-TIPS WEEKLY PROJECT
-
Get the Code
-
Check out the R-Tips Setup Video.
Once you take these actions, you’ll be set up to receive R-Tips with Code every week. =)