Build GGPLOT Code with Tableau Drag-and-Drop (R esquisse)
Written by Matt Dancho
This article is part of a R-Tips Weekly, a weekly video tutorial that shows you step-by-step how to do common R coding tasks.
Tableau-users rejoice! The esquisse R package is here to make you life much easier - make ggplot2 plot code using a drag-and-drop Tableau interface. Here’s what you need to do:
Here are the links to get set up. 👇
 (Click image to play tutorial)
How to get started with Esquisse
Esquisse is the R-package for building ggplots with a Drag-and-Drop interface. There are 3 steps to get started.
- Load R packages
- Get Data
- Run
esquisser()
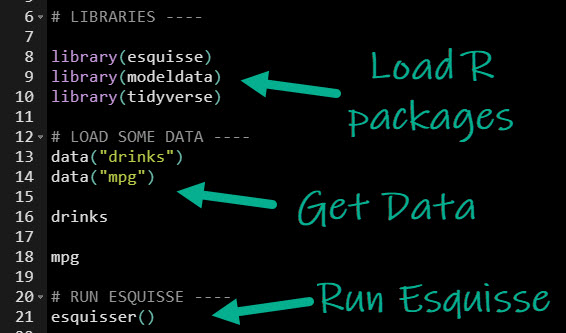
The esquisser() function fires up the ggplot builder dashboard
- Just load the dataset you want to explore
- Then drag-and-drop
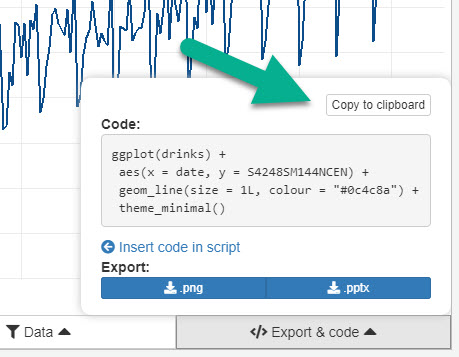
Get the ggplot code
Once you are happy with your ggplot, you can get the code used to produce it!
Learning ggplot2
Esquisse is awesome, but eventually you’ll want to learn ggplot. Here are a few learning tips.
PRO TIP 1 - Use my Cheat Sheet
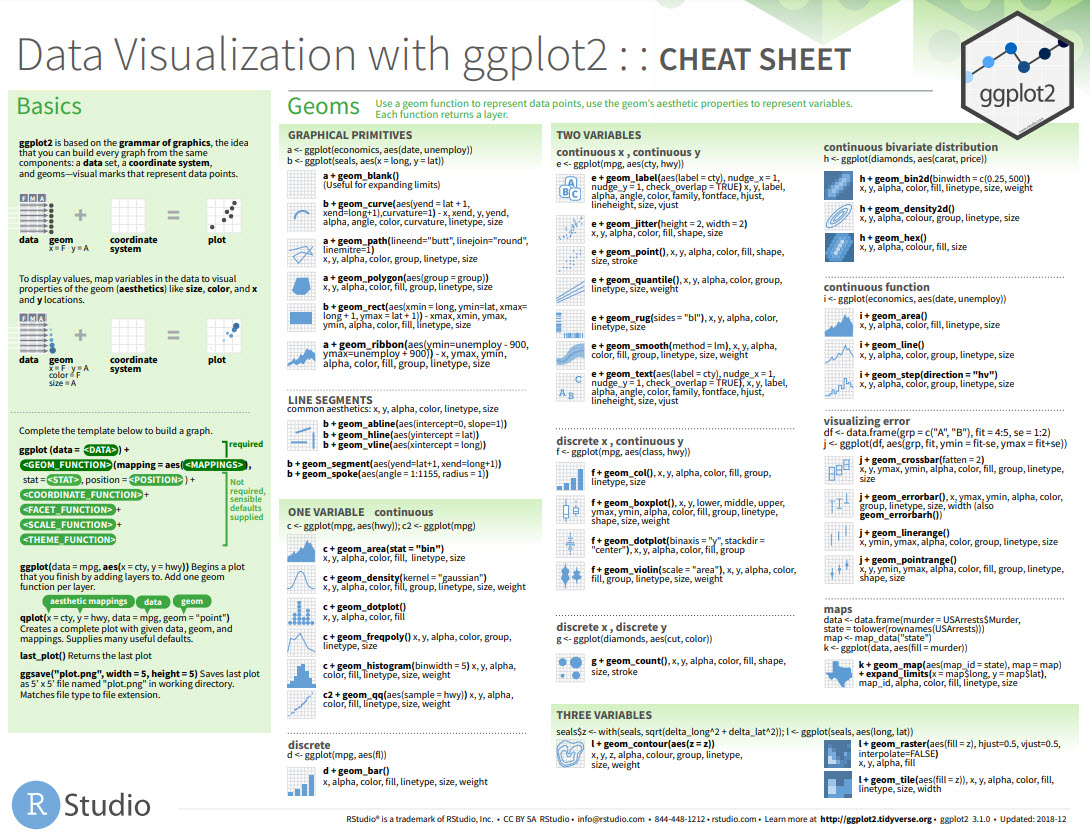
I’ve added the Tidyverse to my Ultimate R Cheatsheet (see page 1). Click the “CS” next to ggplot to get the ggplot2 Cheat Sheet.
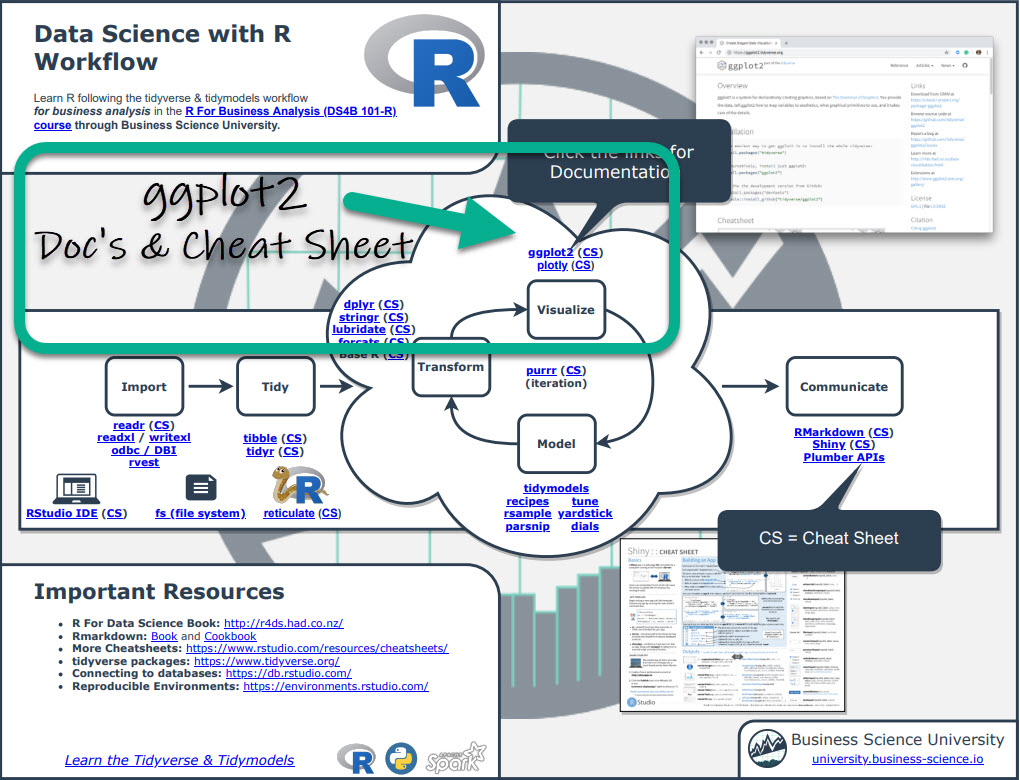
This downloads the “Data Visualization with ggplot2” Cheat Sheet with all of the ggplot2 functions. It’s a great way to get a 1000-foot view of ggplot2. But, it can be a lot to take in.
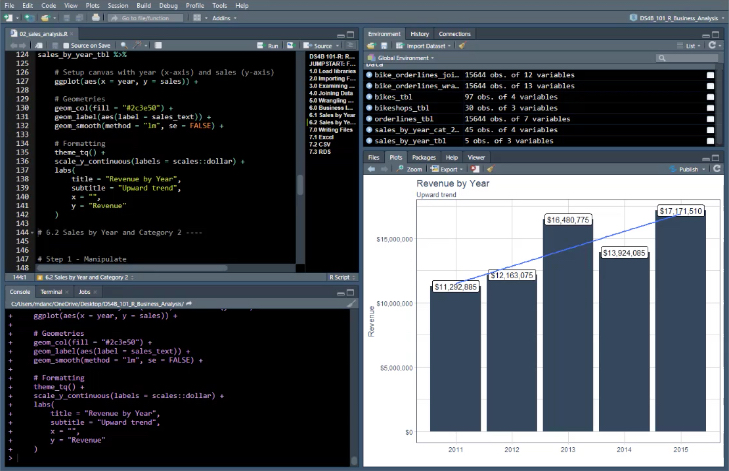
PRO TIP 2 - Try my Jumpstart with R Course
Jumpstart with R the 1st week of my R-Track program. You’ll make a Sales Analysis with dplyr and ggplot2. You’ll see how several of those functions from the ggplot cheat sheet work as you make your sales analysis plots.
In Summary
You just built ggplot code with drag-and-drop interface all thanks to esquisse!! Congratulations.
But, what if you want to build more powerful analysis and web applications?
This could be a challenge. You’ll need to learn a ton, and this will take a long time. Plus, you might struggle and quit.
What if there was a program that took the guess-work out of learning data science and made it impossible to fail?