patchwork: ggplot2 plot combiner
Written by Matt Dancho
This article is part of R-Tips Weekly, a weekly video tutorial that shows you step-by-step how to do common R coding tasks.
Here are the links to get set up. 👇
patchwork
The ggplot2 composer that makes it ridiculously simple to combine multiple ggplots
 (Click image to play tutorial)
patchwork
Combine multiple ggplots into one.
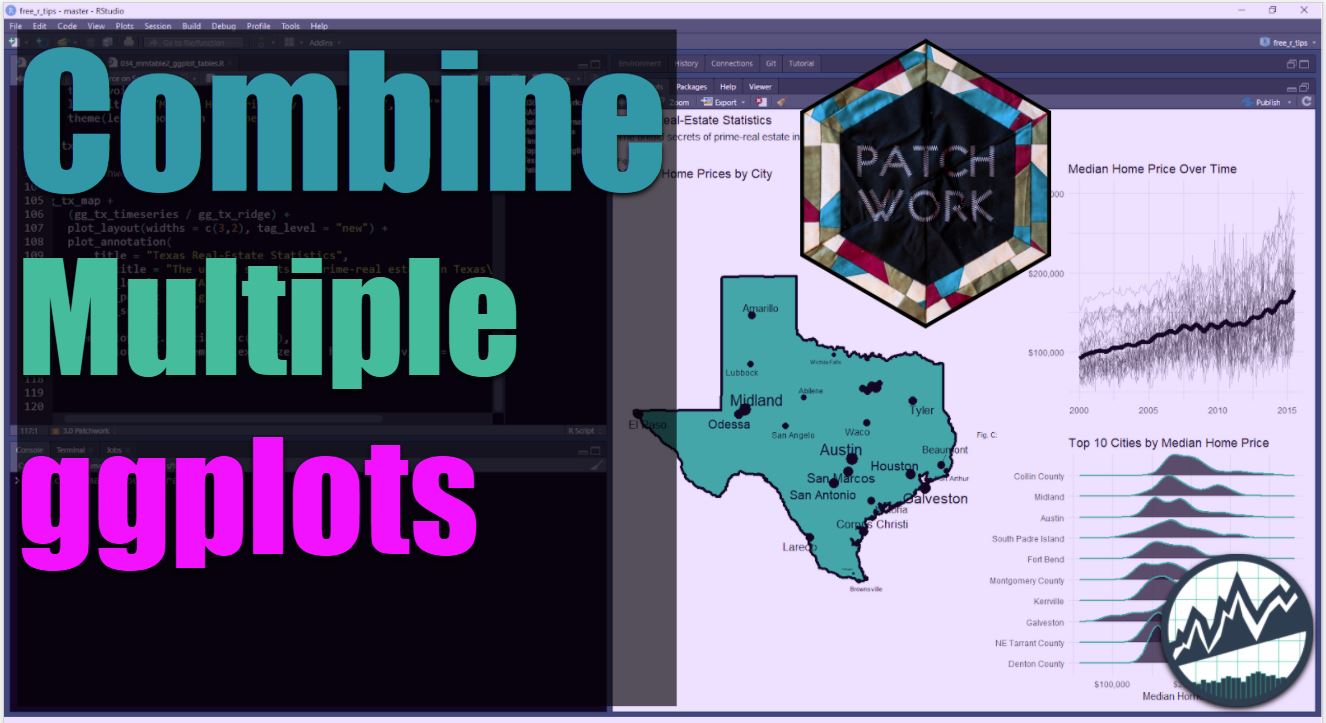
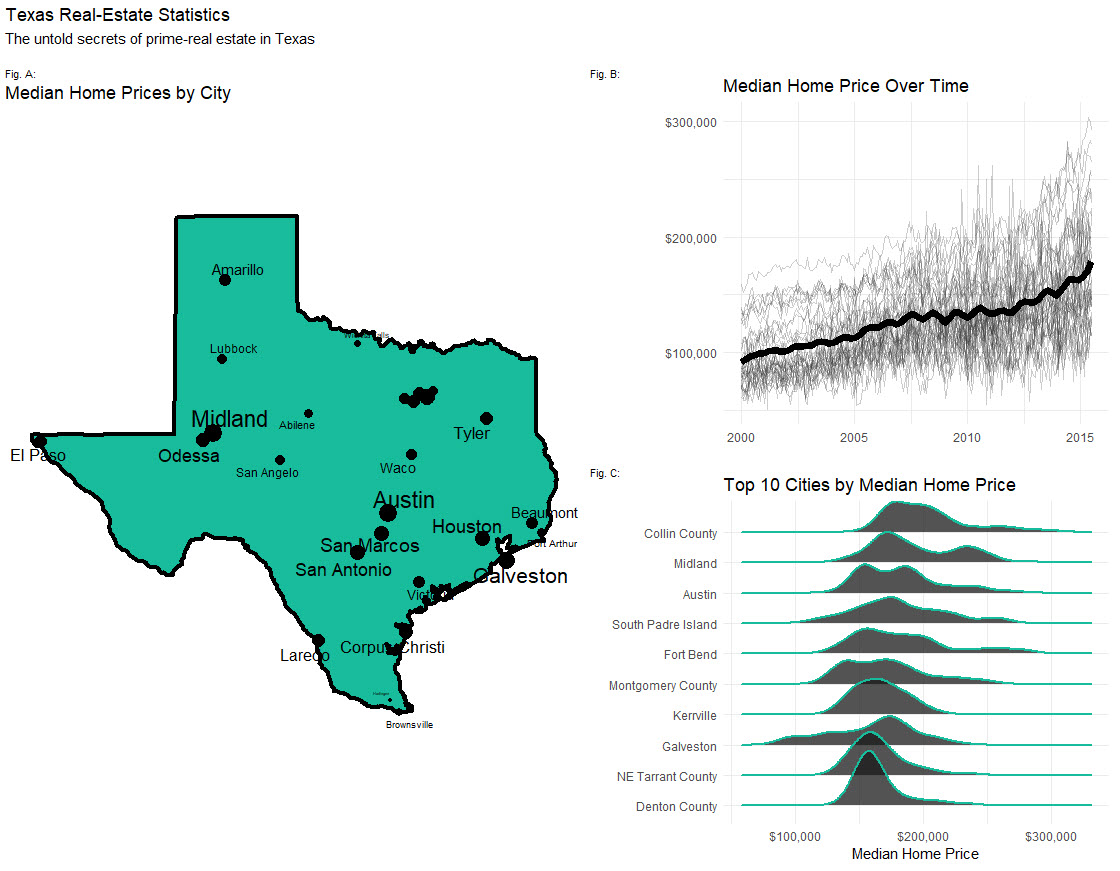
 A Texas Real Estate Storyboard
What we're making today combines 3 plots into 1 illustrative storyboard.
- Map Plot
- Time Series Plot
- Ridgeline Plot
The ggplot2 package is great for single plots, but what about creating a storyboard for illustrating ideas, making persuasive arguments, and storytelling?
Now you can make publication-ready storyboards using patchwork, the composer of ggplot2. Patchwork makes it ridiculously simple to combine separate ggplots into the same graphic, arranging plots into a grid and adding figures, labels, and annotations.
The patchwork package aims to make it easy to combine ggplots by:
- Using a ggplot2 syntax for using a grammar of plot-layout operations.
- Extends the amazing ggplot2 package.
How patchwork works
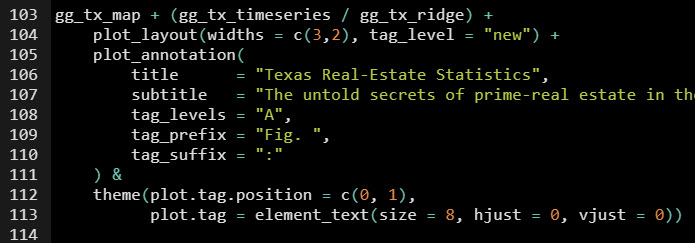
Here's the simplified patchwork syntax. That's all we need to create a two-column layout with the right-column containing two rows is in the simple syntax. Let's break it down.
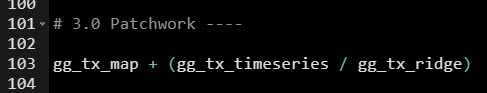
Patchwork has a very simple syntax where we can create layouts super easily. Here's the general syntax that combines:
- Two-Column Layout using the Plus Sign `+`
- Parenthesis `()` to create a subplot group.
- Two-Row Layout using the Division Sign `\`
This is the basic layout for the Texas Real-Estate Storyboard shown in the chart above. 📊☝️
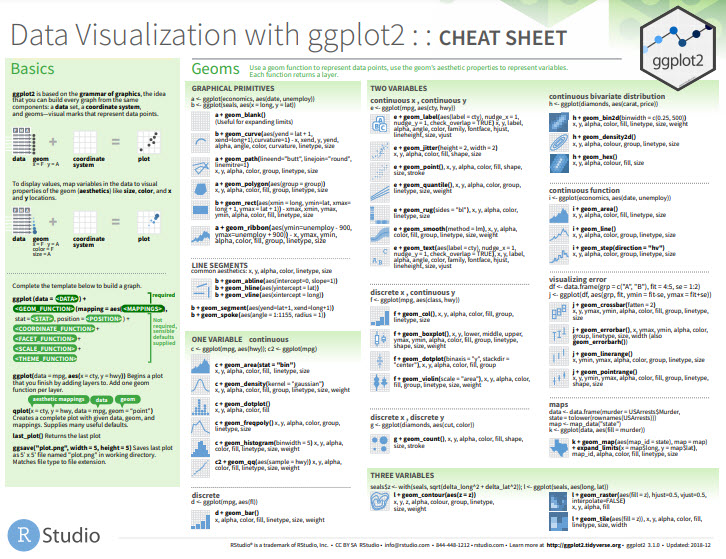
The most important component to patchwork is that you need to be good at developing ggplot2 plots if you want to make your storyboard look great. For that, I'll defer to our Ultimate R Cheat Sheet to help you get up to speed.
Before we get started, get the Cheat Sheet
patchwork is great for combining plots. But, you'll still need to learn how to wrangle data with dplyr and visualize data with ggplot2. For those topics, I'll use the Ultimate R Cheat Sheet to refer to dplyr and ggplot2 code in my workflow.
Quick Example:
Download the Ultimate R Cheat Sheet. Then Click the "CS" next to "ggplot2" opens the Data Visualization with Dplyr Cheat Sheet.
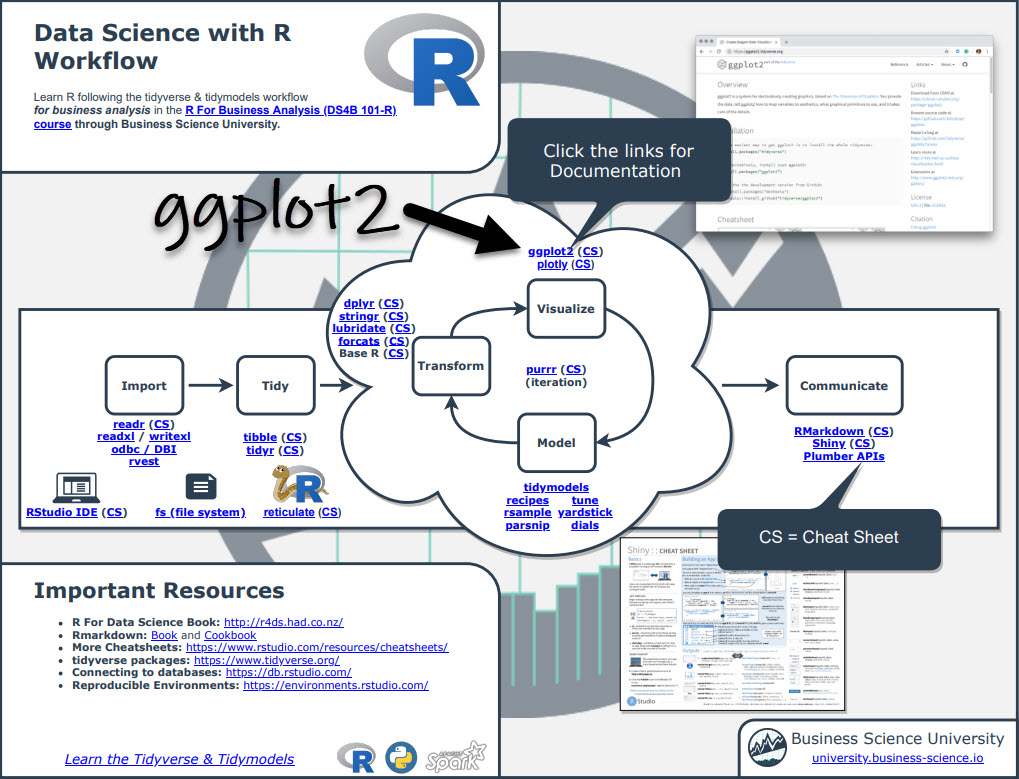
Now you're ready to quickly reference ggplot2 functions.
Onto the tutorial.
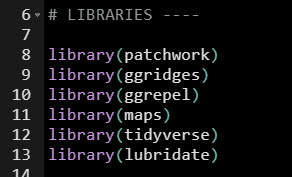
Step 1: Load Libraries & Data
The libraries we'll need today are patchwork, ggridges, ggrepel, maps, tidyverse, and lubridate. All packages are available on CRAN and can be installed with install.packages().
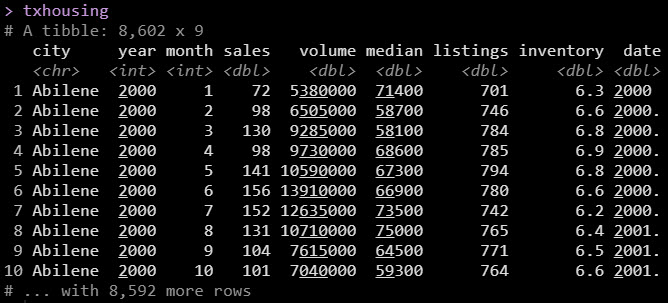
The dataset is the txhousing data that comes with ggplot2.
Step 2: Make our Sub-Plots
We'll start by making individual plots that are components of our final patchwork storyboard.
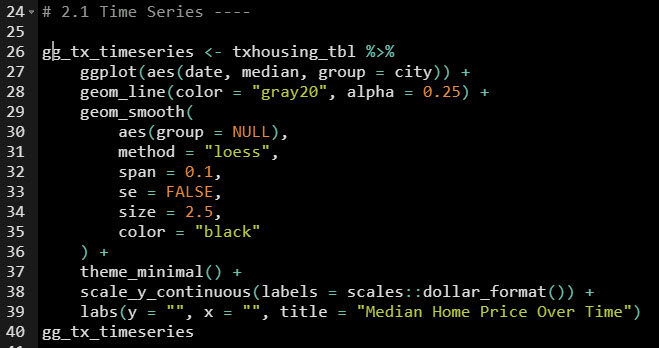
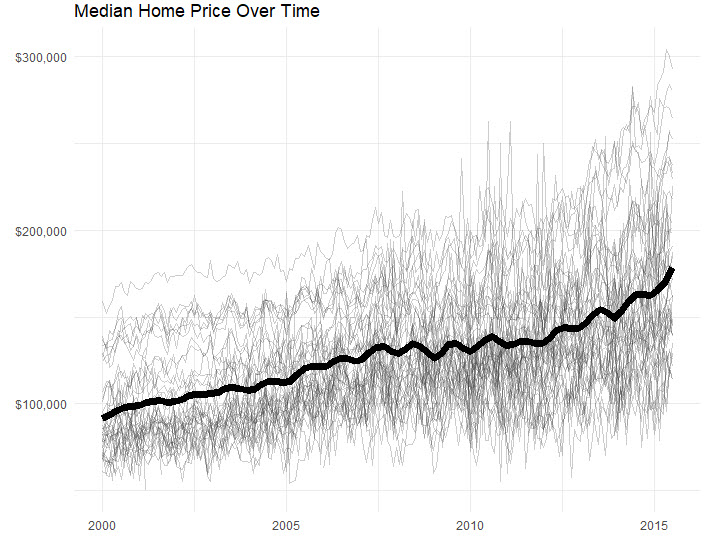
Plot 1. Time Series Plot
First, we make a time series plot that shows the smoothed trend in median home prices of all the Texas cities along with their individual trends in median price.
 Get the Code
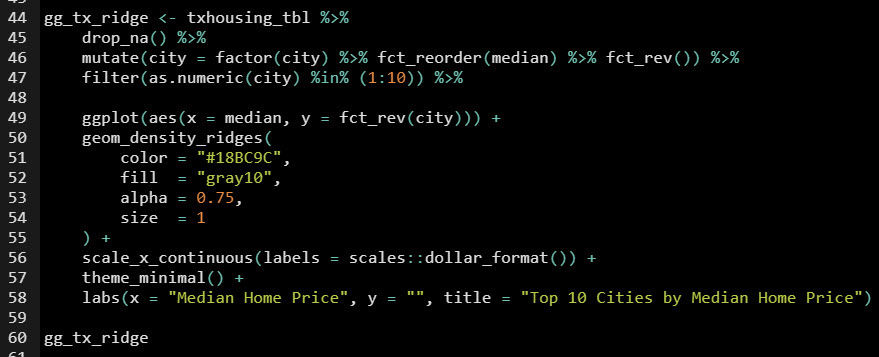
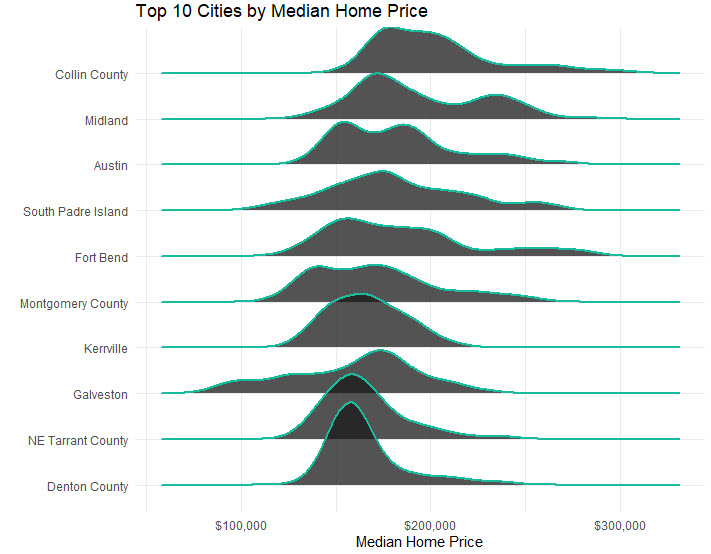
Plot 2. Ridgeline Plot
Next is creating a ridgeline plot, a special plot that shows distribution of median home prices by top-10 cities in an aesthetically pleasing visual. PS. I teach data visualization with ggplot2 in-depth in the R for Business Analysis course.
 Get the Code
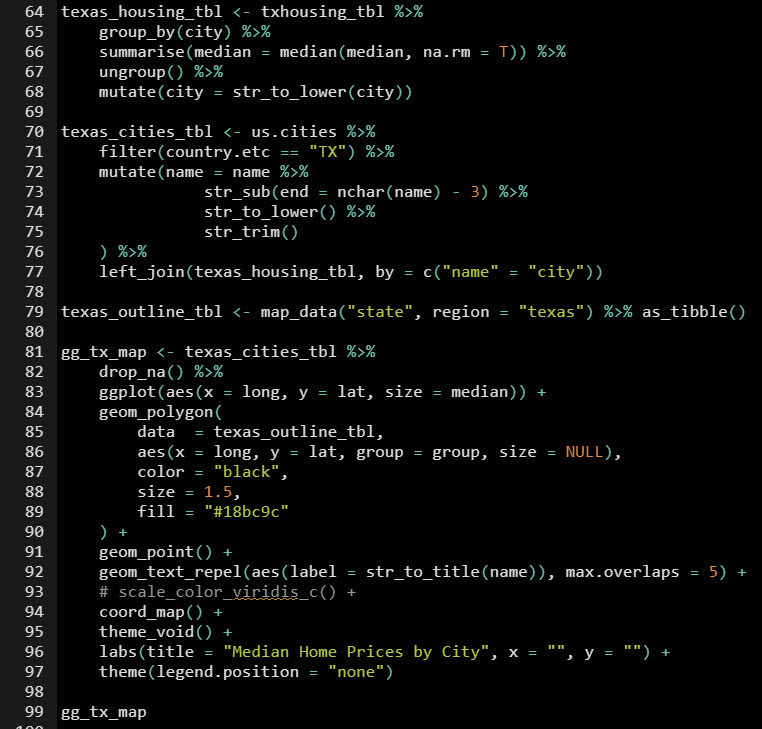
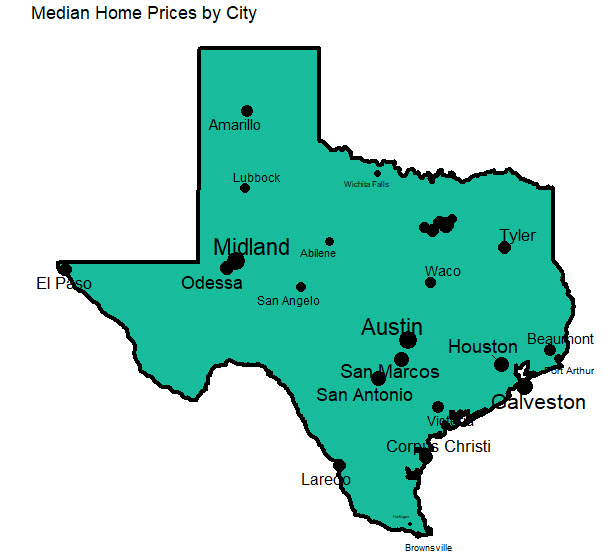
Plot 3. The Map Plot
The final plot is a geographic map that showcases the summary of which cities have the highest median home prices in Texas.
 Get the Code
Step 3: Compose with patchwork
The YouTube tutorial does this code justice. Check it out.
 Get the Code
In Summary
You just quickly made a professional storyboard using the ggplot2 and patchwork. Fantastic!
You should be proud.
This article is part of R-Tips Weekly, a weekly video tutorial that shows you step-by-step how to do common R coding tasks. Join today.