How to Automate Excel with R
Written by Matt Dancho
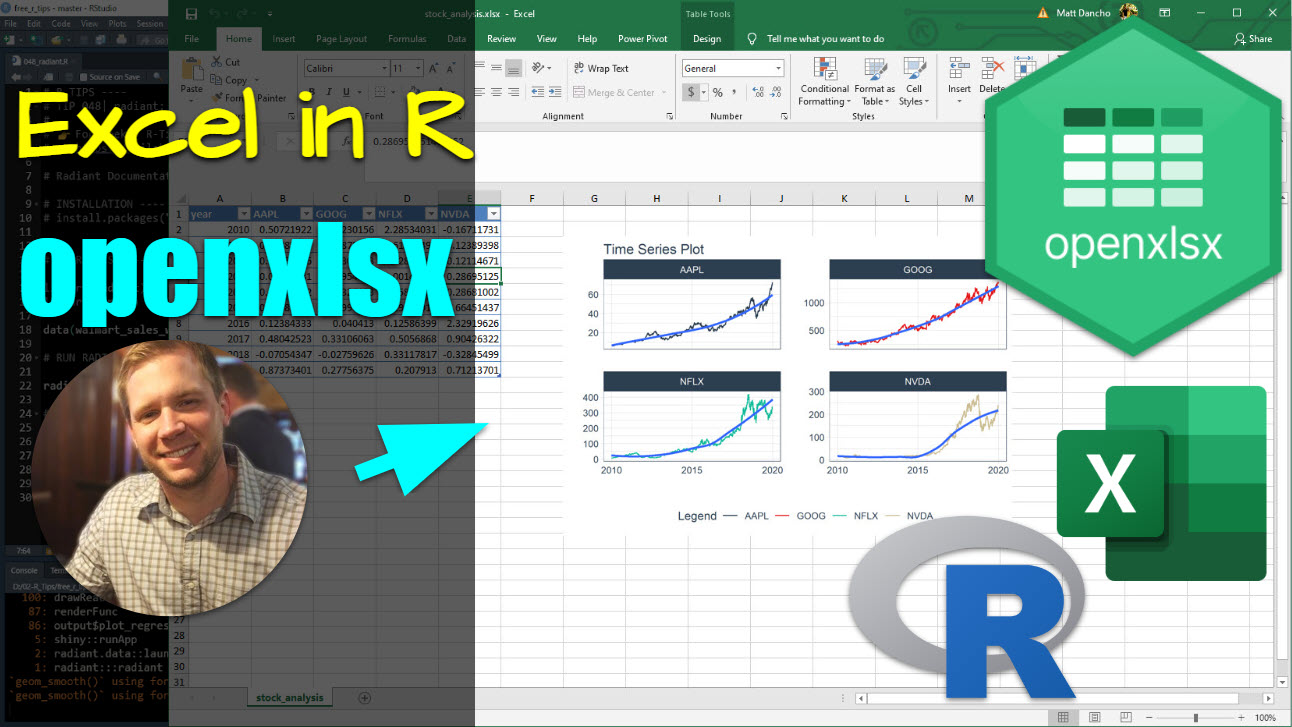
Your company lives off them… Excel files. Why not automate them & save some time? Here’s an Excel File you’re going to make in this tutorial from R. Let me show you how to automate Excel with R in under 5-minutes, using openxlsx and tidyquant.

Automating Excel from R
SPECIAL ANNOUNCEMENT: AI for Data Scientists Workshop on December 18th
Inside the workshop I’ll share how I built a SQL-Writing Business Intelligence Agent with Generative AI:

What: GenAI for Data Scientists
When: Wednesday December 18th, 2pm EST
How It Will Help You: Whether you are new to data science or are an expert, Generative AI is changing the game. There’s a ton of hype. But how can Generative AI actually help you become a better data scientist and help you stand out in your career? I’ll show you inside my free Generative AI for Data Scientists workshop.
Price: Does Free sound good?
How To Join: 👉 Register Here
R-Tips Weekly
This article is part of R-Tips Weekly, a weekly video tutorial that shows you step-by-step how to do common R coding tasks. Pretty cool, right?
Here are the links to get set up. 👇
Video Tutorial
I have a companion video tutorial that shows even more cool automation stuff (plus mistakes to avoid).
Automate Excel with R Tutorial
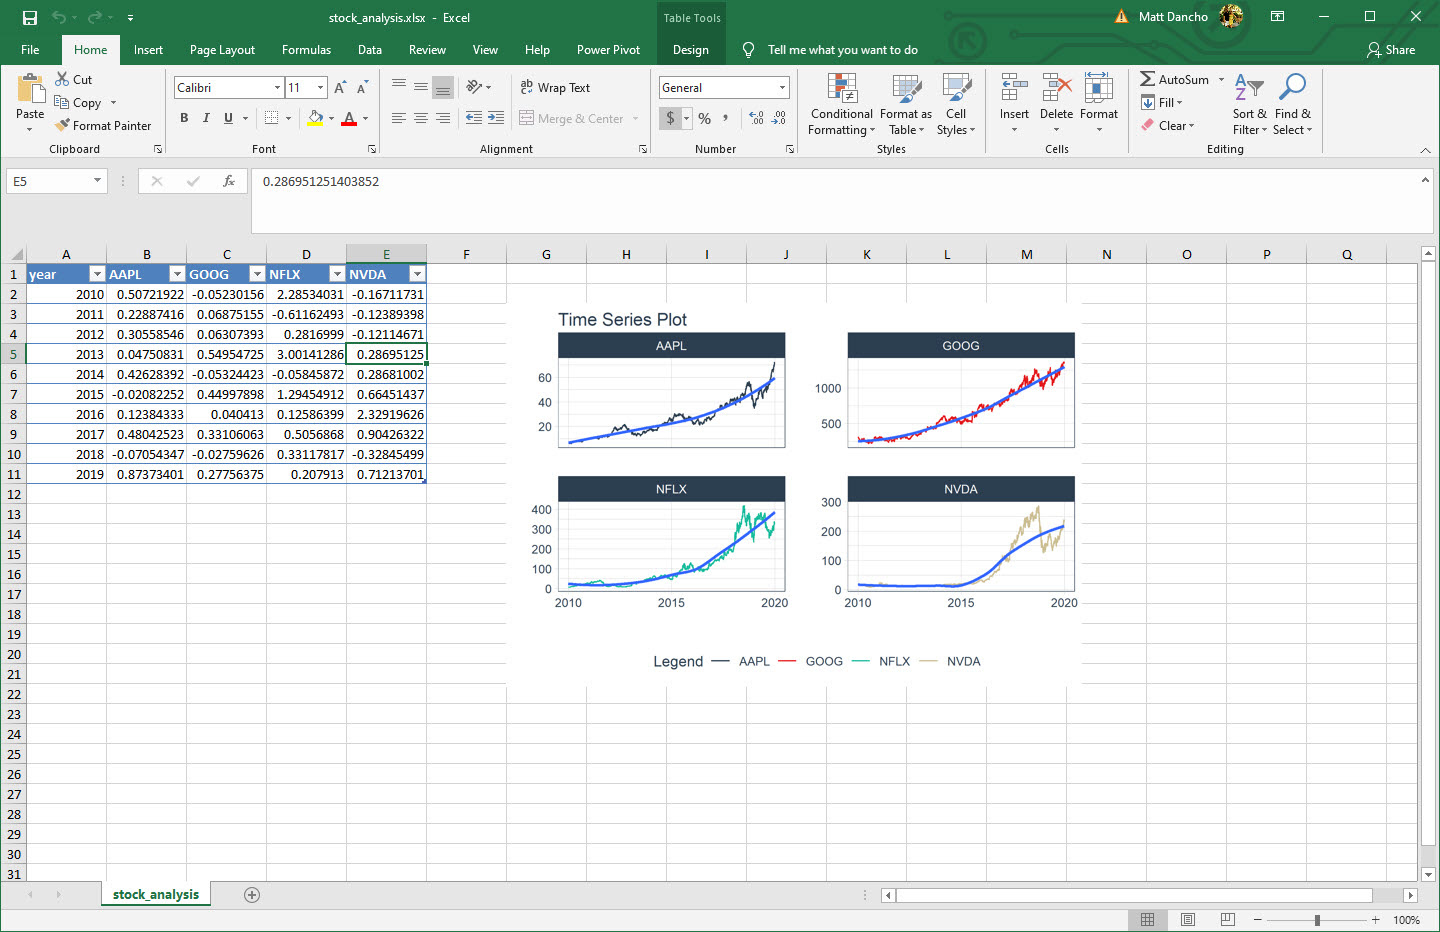
Here’s an Excel File you’re going to make in this tutorial from R. 👇
Step 1: Collect, Prepare Data & Plots
First, collect your data using tidyquant, an awesome package for importing & working with Financial Data.
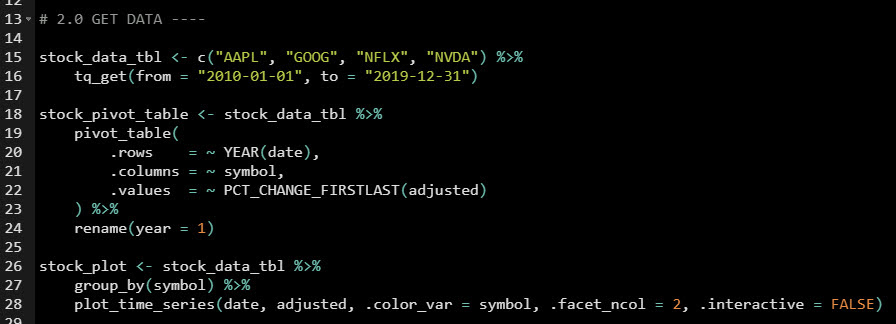
Get the code.
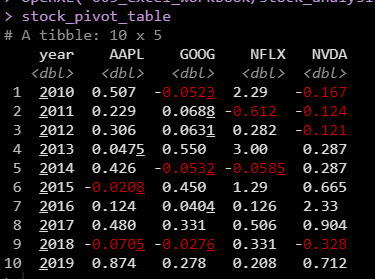
Pivot Table Data
The previous code makes this Pivot Table (stock returns by year and symbol).
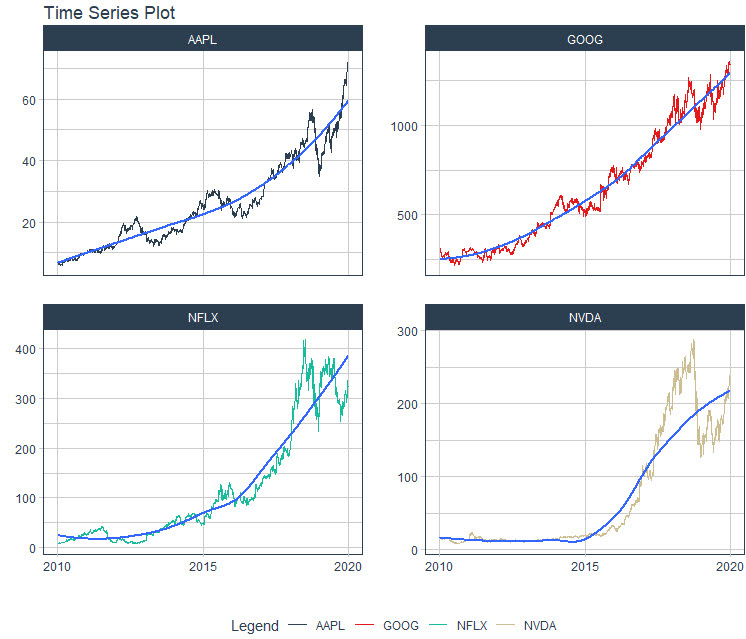
Here’s the stock performance plot from the previous code.
Step 2: Automate R to Excel
Now for the magic - Let’s add the Pivot Table & Stock Plot to Excel! 🔥
- Initialize a workbook
- Create a worksheet
- Add the stock plot
- Add the Pivot Table
- Save the workbook
- Open the workbook (programmatically)
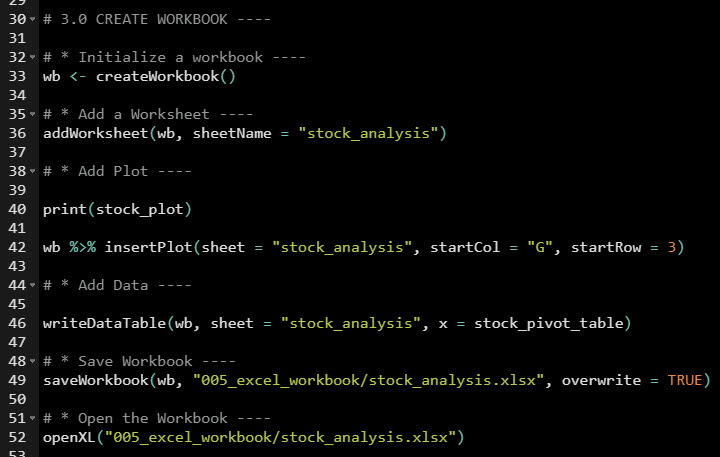
Get the code.
Excel Output (.xlsx)
You’ve just automated creation of an Excel Workbook with R.
💡 Conclusions
You learned how to use the openxlsx library to create automated reports using R and Excel together. Great work! But, there’s a lot more to becoming a Business Scientist.
If you’d like to become a Business Scientist (and have an awesome career, improve your quality of life, enjoy your job, and all the fun that comes along), then I can help with that.
Need to advance your business data science skills?
I’ve helped 6,107+ students learn data science for business from an elite business consultant’s perspective.
I’ve worked with Fortune 500 companies like S&P Global, Apple, MRM McCann, and more.
And I built a training program that gets my students life-changing data science careers (don’t believe me? see my testimonials here):
6-Figure Data Science Job at CVS Health ($125K)
Senior VP Of Analytics At JP Morgan ($200K)
50%+ Raises & Promotions ($150K)
Lead Data Scientist at Northwestern Mutual ($175K)
2X-ed Salary (From $60K to $120K)
2 Competing ML Job Offers ($150K)
Promotion to Lead Data Scientist ($175K)
Data Scientist Job at Verizon ($125K+)
Data Scientist Job at CitiBank ($100K + Bonus)
Whenever you are ready, here’s the system they are taking:
Here’s the system that has gotten aspiring data scientists, career transitioners, and life long learners data science jobs and promotions…

Join My 5-Course R-Track Program Now!
(And Become The Data Scientist You Were Meant To Be...)
P.S. - Samantha landed her NEW Data Science R Developer job at CVS Health (Fortune 500). This could be you.
