How to Automate PowerPoint Slidedecks with R
Written by Matt Dancho
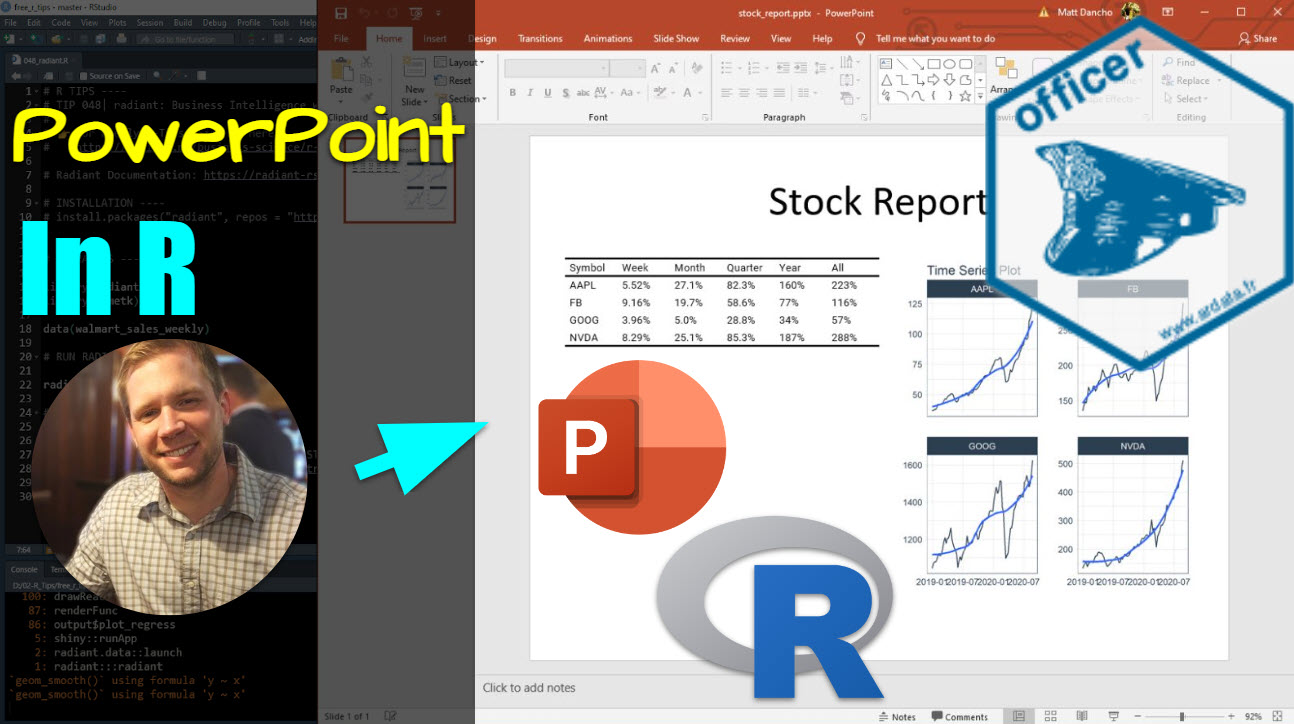
Your boss lives on PowerPoint decks. Do you need to create a Slide Deck every week? Let’s learn how to automate PowerPoint with R, using officer and tidyverse.
R-Tips Weekly Newsletter
This article is part of R-Tips Weekly, a weekly video tutorial that shows you step-by-step how to do common R coding tasks one R-tip at a time.
Here are the links to get set up. 👇
This Tutorial Is Available In Video
I have a companion video tutorial that shows even more secrets (plus mistakes to avoid). And, I’m finding that a lot of my students prefer the dialogue that goes along with coding. So check out this video to see me running the code in this tutorial. 👇
Automate PowerPoint with R
Here’s a common situation, you have to make a Monday Morning Slide Deck. It’s the same deck each week, just date ranges for your data change. Here’s how to automate this process with R!
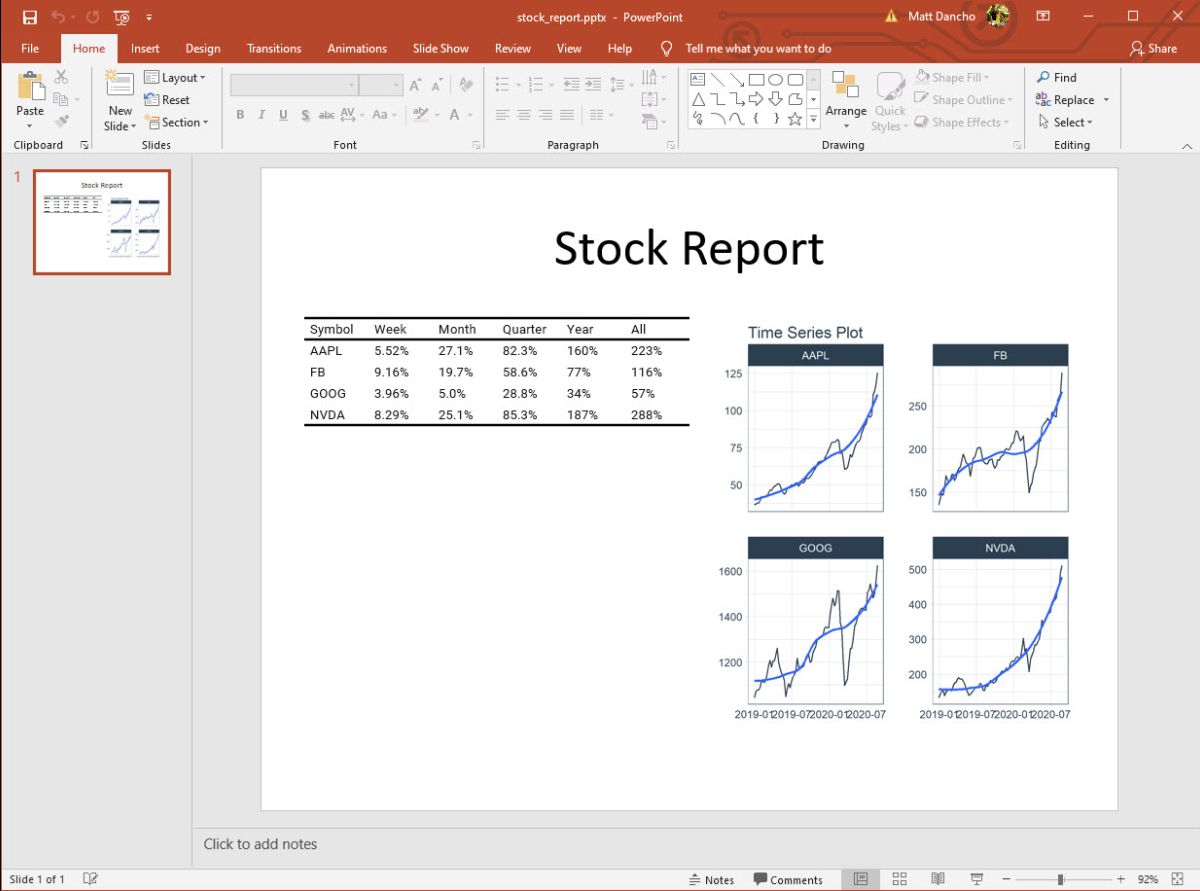
First, here’s what you need to make - A weekly Stock Report.
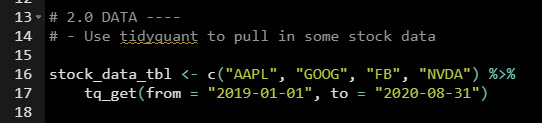
Thinking like a programmer, you can collect your stock data using date ranges.
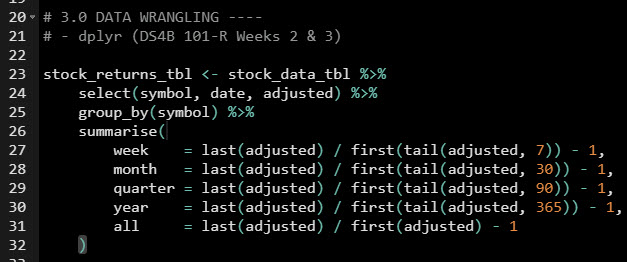
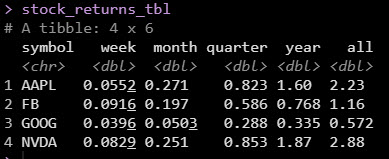
With a little bit of data wrangling with the tidyverse, you’ve got your table extracted & formatted!
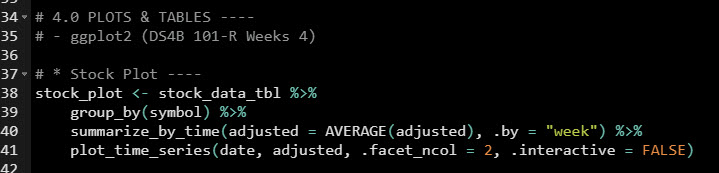
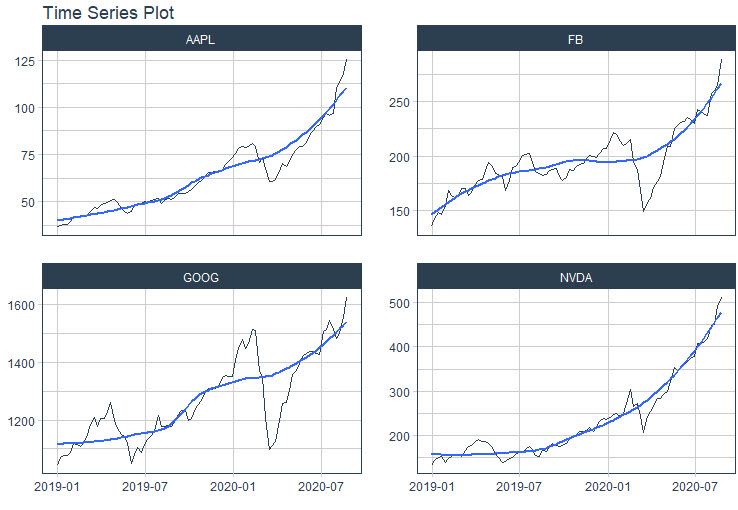
Then you use timetk to make a sweet plot.
Then you use officer to add the table and plot to powerpoint.
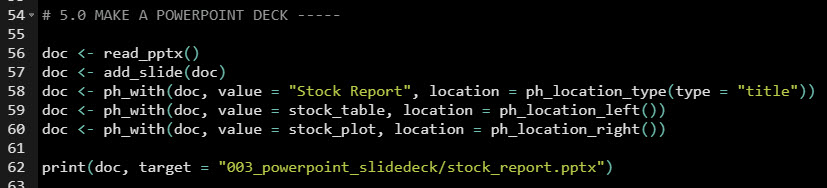
You’ve just automated your Monday Morning PowerPoint in R. BOOM! 💥💥💥
💡 Conclusions
You learned how to automate PowerPoint with R. Great work! But, there’s a lot more to becoming a Business Scientist (my term for an incredibly valuable data scientist that has business skills).
If you’d like to become a Business Scientist (and have an awesome career, improve your quality of life, enjoy your job, and all the fun that comes along), then I can help with that.
Need to advance your business data science skills?
I’ve helped 6,107+ students learn data science for business from an elite business consultant’s perspective.
I’ve worked with Fortune 500 companies like S&P Global, Apple, MRM McCann, and more.
And I built a training program that gets my students life-changing data science careers (don’t believe me? see my testimonials here):
6-Figure Data Science Job at CVS Health ($125K)
Senior VP Of Analytics At JP Morgan ($200K)
50%+ Raises & Promotions ($150K)
Lead Data Scientist at Northwestern Mutual ($175K)
2X-ed Salary (From $60K to $120K)
2 Competing ML Job Offers ($150K)
Promotion to Lead Data Scientist ($175K)
Data Scientist Job at Verizon ($125K+)
Data Scientist Job at CitiBank ($100K + Bonus)
Whenever you are ready, here’s the system they are taking:
Here’s the system that has gotten aspiring data scientists, career transitioners, and life long learners data science jobs and promotions…

Join My 5-Course R-Track Program Now!
(And Become The Data Scientist You Were Meant To Be...)
P.S. - Samantha landed her NEW Data Science R Developer job at CVS Health (Fortune 500). This could be you.
