6 Reasons To Learn R For Business
Written by Matt Dancho
Data science for business (DS4B) is the future of business analytics yet it is really difficult to figure out where to start. The last thing you want to do is waste time with the wrong tool. Making effective use of your time involves two pieces: (1) selecting the right tool for the job, and (2) efficiently learning how to use the tool to return business value. This article focuses on the first part, explaining why R is the right choice in six points. If you’d like to tackle learning R efficiently, we have another article that covers the 80/20 Rule for Learning R.
Reason 1: R Has The Best Overall Qualities For Business
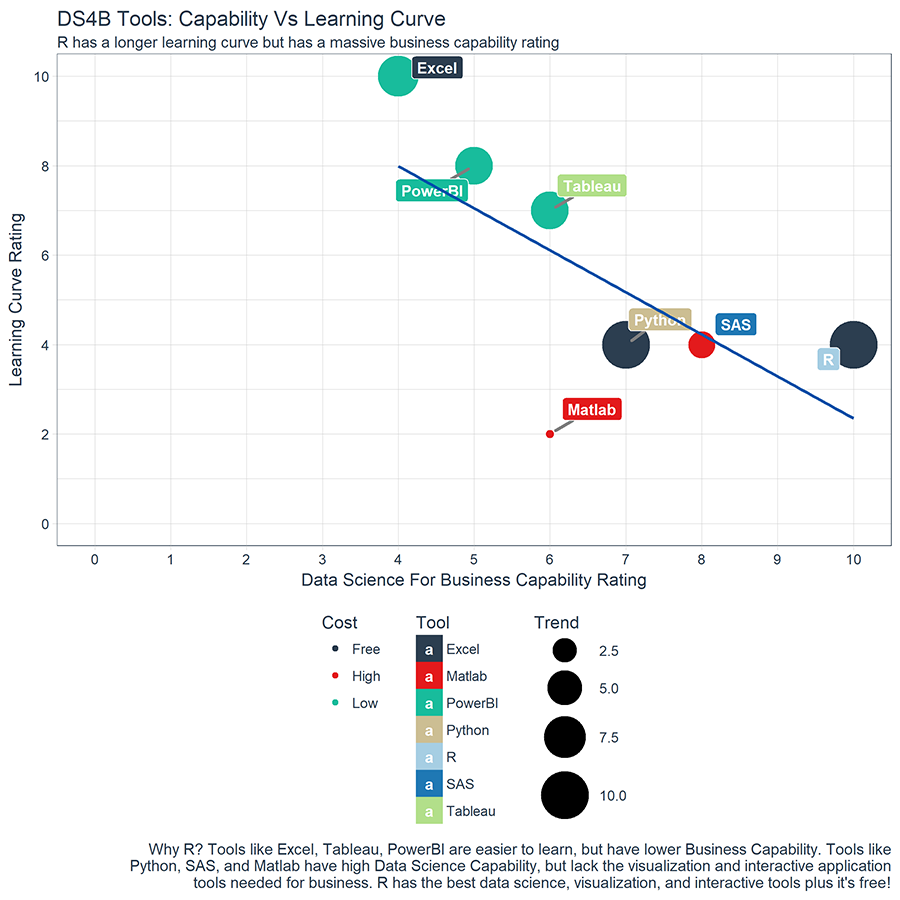
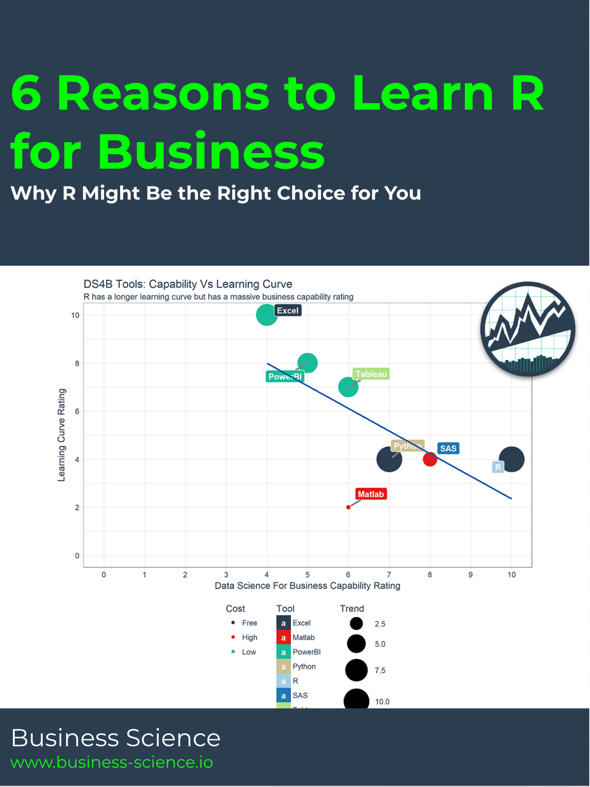
There are a number of tools available business analysis/business intelligence (with DS4B being a subset of this area). Each tool has its pros and cons, many of which are important in the business context. We can use these attributes to compare how each tool stacks up against the others! We did a qualitative assessment using several criteria:
- Business Capability (1 = Low, 10 = High)
- Ease of Learning (1 = Difficult, 10 = Easy)
- Cost (Free/Minimal, Low, High)
- Trend (0 = Fast Decline, 5 = Stable, 10 = Fast Growth)
Further discussion on the assessment is included in the Appendix at the end of the article.
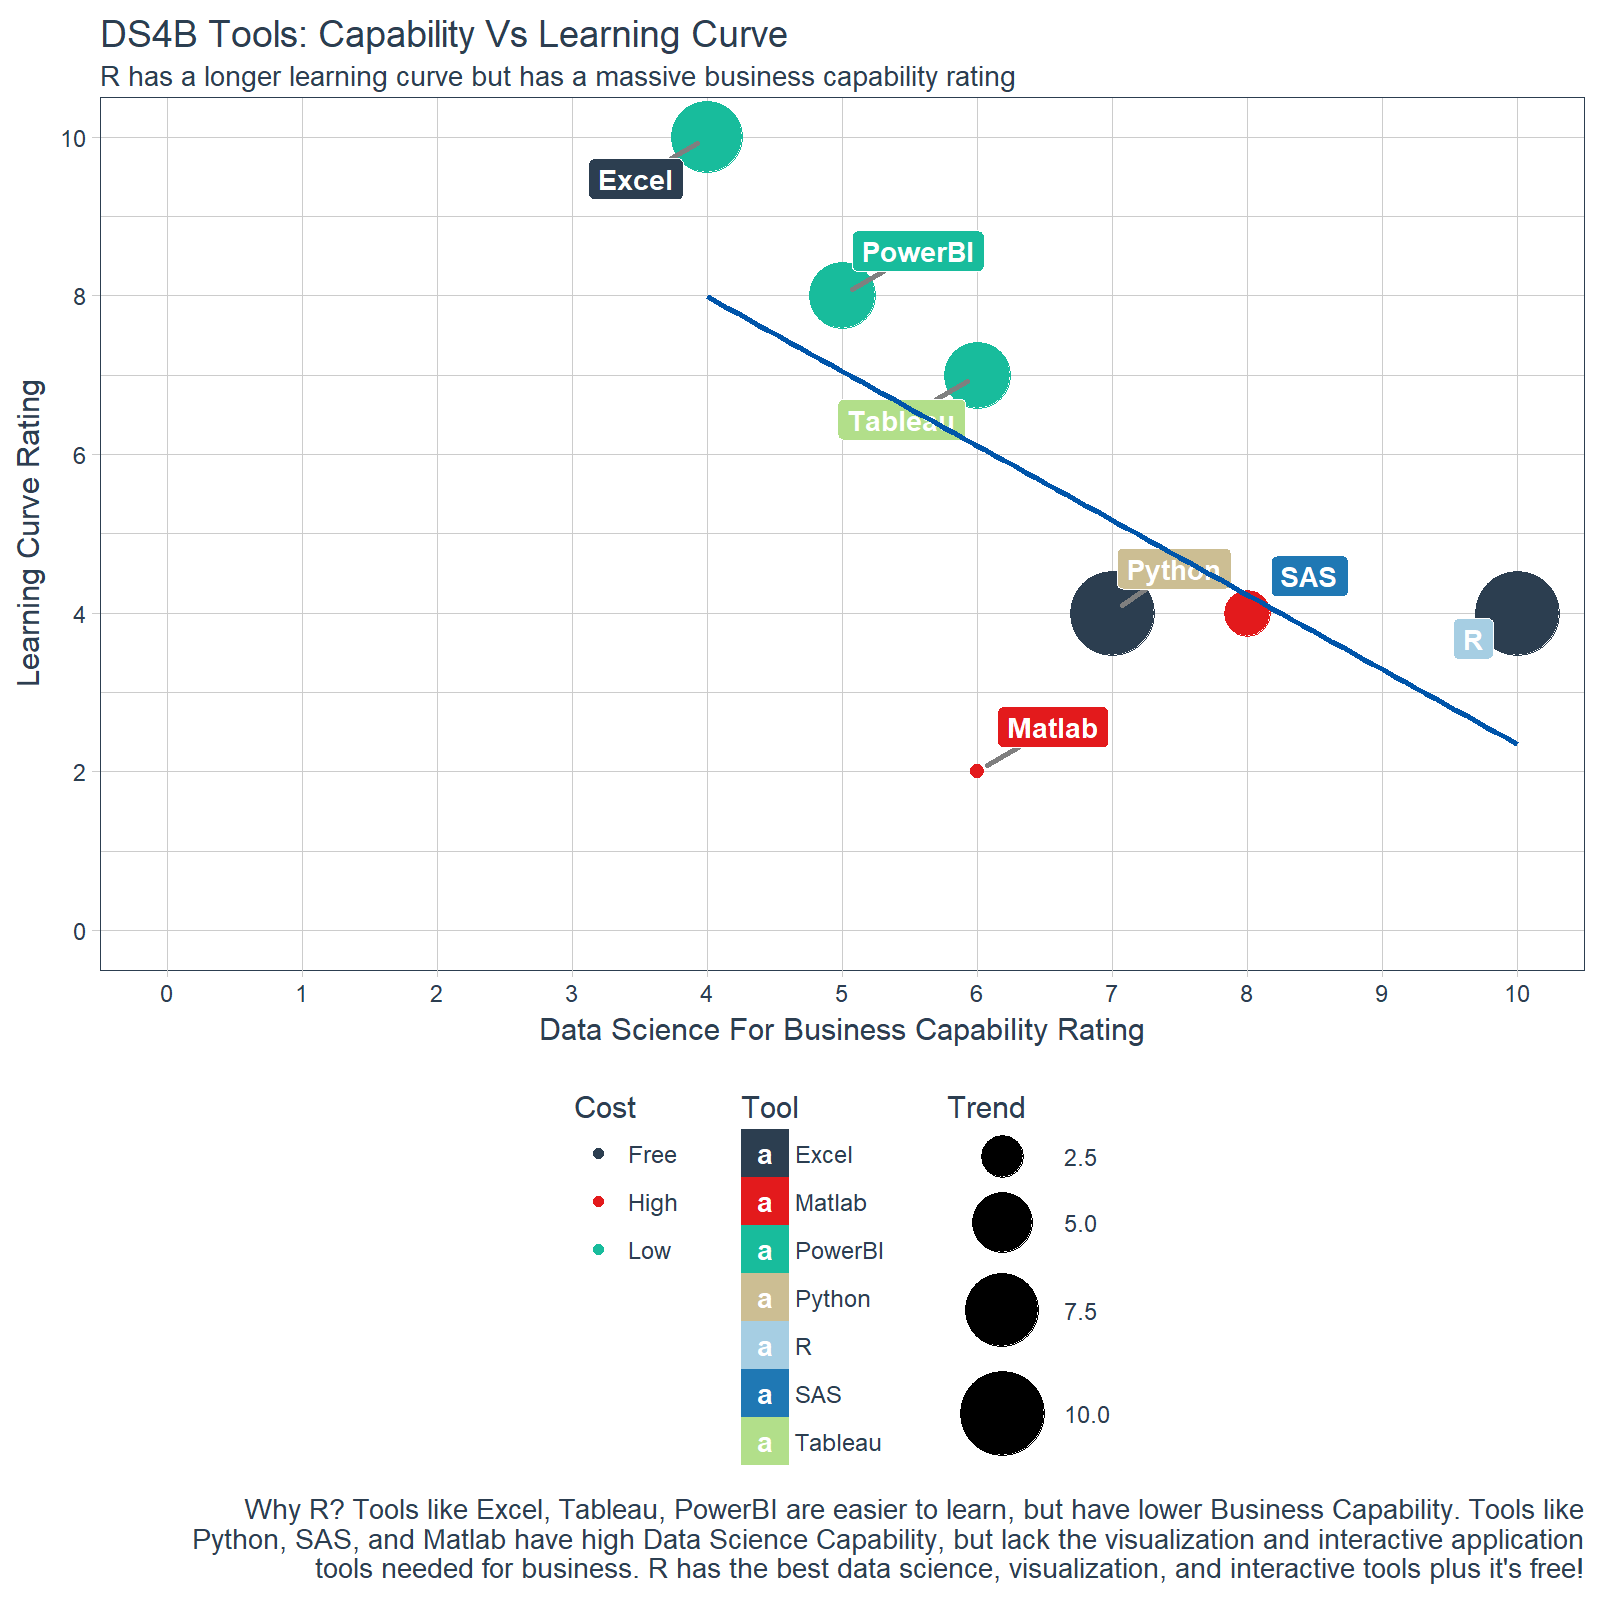
What we saw was particularly interesting. A trendline developed exposing a tradeoff between learning curve and DS4B capability rating. The most flexible tools are more difficult to learn but tend to have higher business capability. Conversely, the “easy-to-learn” tools are often not the best long-term tools for business or data science capability. Our opinion is go for capability over ease of use.
Of the top tools in capability, R has the best mix of desirable attributes including high data science for business capability, low cost, is growing very fast., and has a massive ecosystem of powerful R libraries. The only downside is the learning curve. The Cheat Sheet below showcases the powerful libraries that are at your fingertips - Download our Ultimate R Cheat Sheet to see what libraries are available to solve specific needs.
The Ultimate R Cheat Sheet showcases the massive ecosystem of powerful R packages (Free Download)
Reason 2: R Is Data Science For Non-Computer Scientists
If you are seeking high-performance data science tools, you really have two options: R or Python. When starting out, you should pick one. It’s a mistake to try to learn both. Your choice comes down to what’s right for you. The difference between R and Python has been described in numerous infographics and debates online, but the most overlooked reason is person-programming language fit. Don’t understand what we mean? Let’s break it down.
Fact 1: Most people interested in learning data science for business are not computer scientists. They are business professionals, non-software engineers (e.g. mechanical, chemical), and other technical-to-business converts. This is important because of where each language excels.
Fact 2: Most activities in business and finance involve communication. This comes in the form of reports, dashboards, and interactive web applications that allow decision makers to recognize when things are not going well and to make well-informed decisions that improve the business.
Now that we recognize what’s important, let’s learn about the two major players in data science.
About Python
Python is a general service programming language developed by software engineers that has solid programming libraries for math, statistics and machine learning. Python has best-in-class tools for pure machine learning and deep learning, but lacks much of the infrastructure for subjects like econometrics and communication tools such as reporting. Because of this, Python is well-suited for computer scientists and software engineers.
About R
R is a statistical programming language developed by scientists that has open source libraries for statistics, machine learning, and data science. R lends itself well to business because of its depth of topic-specific packages and its communciation infrastructure. R has packages covering a wide range of topics such as econometrics, finance, and time series. R has best-in-class tools for visualization, reporting, and interactivity, which are as important to business as they are to science. Because of this, R is well-suited for scientists, engineers and business professionals.
Which Should You Learn?
Don’t make the decision tougher than what it is. Think about where you are coming from:
-
Are you a computer scientist or software engineer? If yes, learn Python.
-
Are you an analytics professional or mechanical/industrial/chemical engineer looking to get into data science? If yes, learn R.
Think about what you are trying to do:
-
Are you trying to build a self-driving car? If yes, learn Python.
-
Are you trying to communicate business analytics throughout your organization? If yes, learn R.
Reason 3: Learning R Is Easy With The Tidyverse
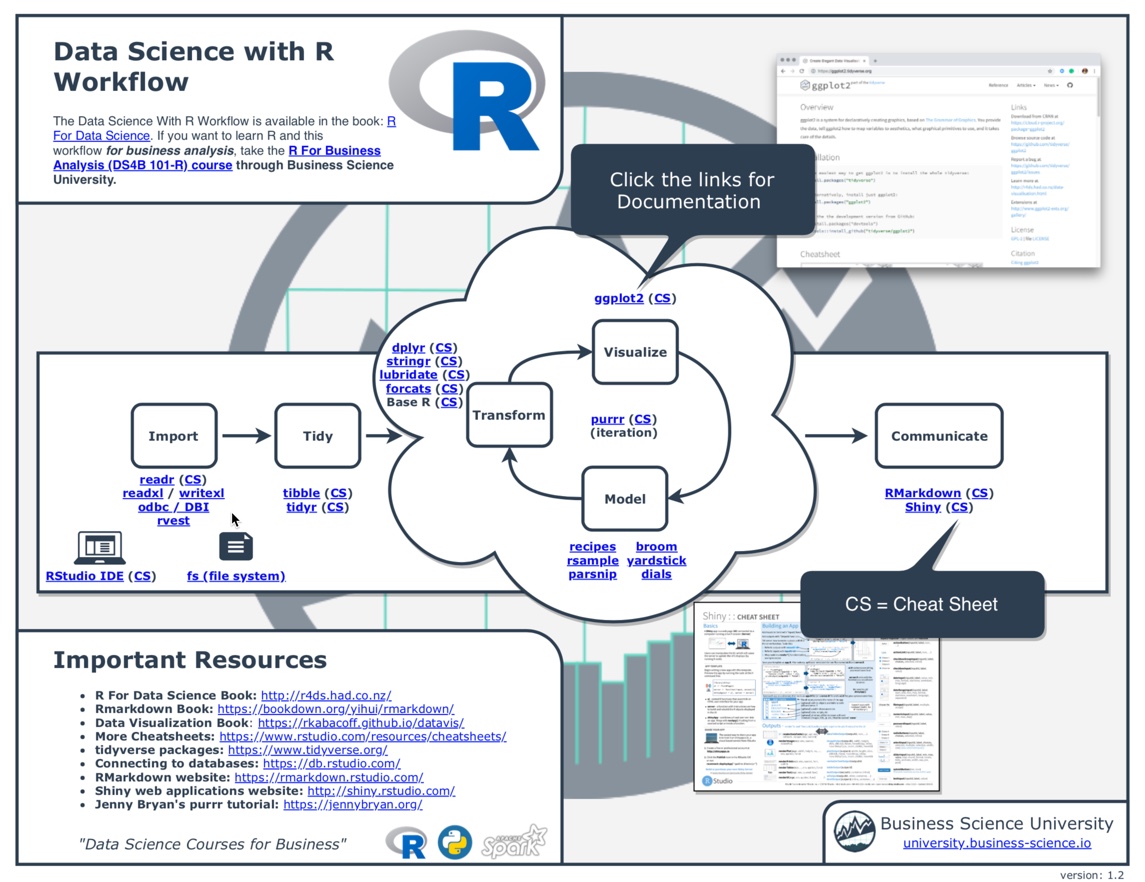
Learning R used to be a major challenge. Base R was a complex and inconsistent programming language. Structure and formality was not the top priority as in other programming languages. This all changed with the “tidyverse”, a set of packages and tools that have a consistently structured programming interface.
When tools such as dplyr and ggplot2 came to fruition, it made the learning curve much easier by providing a consistent and structured approach to working with data. As Hadley Wickham and many others continued to evolve R, the tidyverse came to be, which includes a series of commonly used packages for data manipulation, visualization, iteration, modeling, and communication. The end result is that R is now much easier to learn (we’ll show you in our next article!).
Source: tidyverse.org
R continues to evolve in a structured manner, with advanced packages that are built on top of the tidyverse infrastructure. A new focus is being placed on modeling and algorithms, which we are excited to see. Further, the tidyverse is being extended to cover topical areas such as text (tidytext) and finance (tidyquant). For newcomers, this should give you confidence in selecting this language. R has a bright future.
Reason 4: R Has Brains, Muscle, And Heart
Saying R is powerful is actually an understatement. From the business context, R is like Excel on steroids! But more important than just muscle is the combination of what R offers: brains, muscle, and heart. The 2nd page of the R Cheat Sheet (FREE DOWNLOAD) links to all of the tools discussed next (and more tools beyond)!
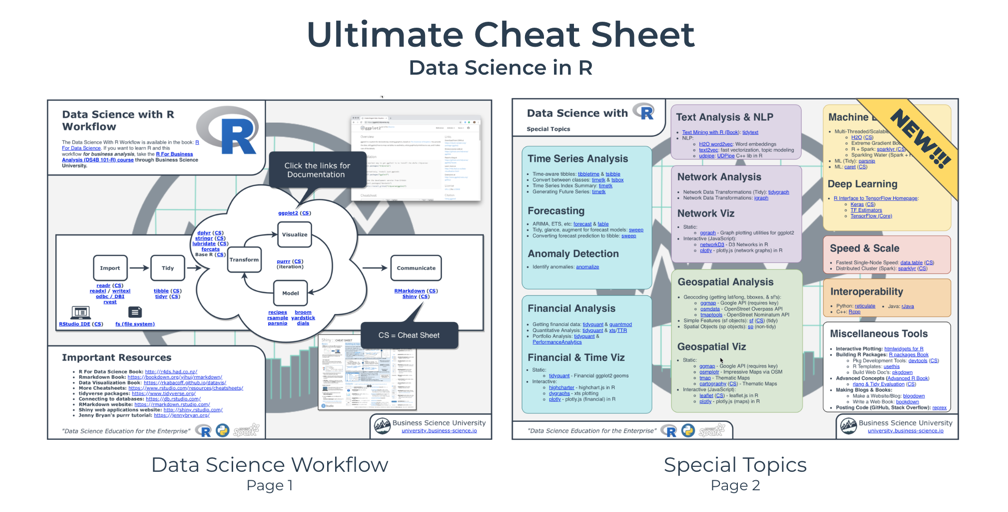
An expanded set of tools has been added to the R Cheat Sheet (Free Download)
R has brains
R implements cutting-edge algorithms including:
- H2O (
h2o) - High-end machine learning package
- Keras/TensorFlow (
keras, tensorflow) - Go-to deep learning packages
- xgboost - Top Kaggle algorithm
- And many more!
These tools are used everywhere from AI products to Kaggle Competitions, and you can use them in your business analyses.
R has muscle
R has powerful tools for:
- Vectorized Operations - R uses vectorized operations to make math computations lightning fast right out of the box
- Loops (
purrr)
- Parallelizing operations (
parallel, future)
- Speeding up code using C++ (
Rcpp)
- Connecting to other languages (
rJava, reticulate)
- Working With Databases - Connecting to databases (
dbplyr, odbc, bigrquery)
- Handling Big Data - Connecting to Apache Spark (
sparklyr)
- And many more!
R has heart
We already talked about the infrastructure, the tidyverse, that enables the ecosystem of applications to be built using a consistent approach. It’s this infrastructure that brings life into your data analysis. The tidyverse enables:
- Data manipulation (
dplyr, tidyr)
- Working with data types (
stringr for strings, lubridate for date/datetime, forcats for categorical/factors)
- Visualization (
ggplot2)
- Programming (
purrr, tidyeval)
- Communication (
Rmarkdown, shiny)
Reason 5: R Is Built For Business
Two major advantages of learning R versus every other programming language is that it can produce business-ready reports and machine learning-powered web applications. Neither Python or Tableau or any other tool can currently do this as efficiently as R can. The two capabilities we refer to are rmarkdown for report generation and shiny for interactive web applications.
Rmarkdown
Rmarkdown is a framework for creating reproducible reports that has since been extended to building blogs, presentations, websites, books, journals, and more. It’s the technology that’s behind this blog, and it allows us to include the code with the text so that anyone can follow the analysis and see the output right with the explanation. What’s really cool is that the technology has evolved so much. Here are a few examples of its capability:
Shiny
Shiny is a framework for creating interactive web applications that are powered by R. Shiny is a major consulting area for us as four of five assignments involve building a web application using shiny. It’s not only powerful, it enables non-data scientists to gain the benefit of data science via interactive decision making tools. Here’s an example of a Google Trend app built with shiny.
Explore the Web App Gallery of predictive business apps
Being a powerful language alone is not enough. To be successful, a language needs community support. We’ll hit on two ways that R excels in this respects: CRAN and the R Community.
CRAN is like the Apple App store, except everything is free, super useful, and built for R. With over 17,000 packages, it has most everything you can possibly want from machine learning to high-performance computing to finance and econometrics! The task views cover specific areas and are one way to explore R’s offerings. CRAN is community-driven, with top open source authors such as Hadley Wickham and Dirk Eddelbuettel leading the way. Package development is a great way to contribute to the community especially for those looking to showcase their coding skills and give back!
You begin learning R because of its capability, you stay with R because of its community. The R Community is the coolest part. It’s tight-knit, opinionated, fun, silly, and highly knowledgeable… all of the things you want in a high performing team.
Social/Web
R users can be found all over the web. A few of the popular hangouts are:
Conferences
R-focused business conferences are gaining traction in a big way. Here are a few that we attend and/or will be attending in the future:
- EARL - Mango Solution’s conference on enterprise and business applications of R
- R/Finance - Community-hosted conference on financial asset and portfolio analytics and applied finance
- Rstudio Conf - Rstudio’s technology conference
- New York R - Business and technology-focused R conference
A full list of R conferences can be found here.
Meetups
A really cool thing about R is that many major cities have a meetup nearby. Meetups are exactly what you think: a group of R-users getting together to talk R. They are usually funded by R-Consortium. You can get a full list of meetups here.
Conclusion
R has a wide range of benefits making it our obvious choice for Data Science for Busienss (DS4B). That’s not to say that Python isn’t a good choice as well, but, for the wide-range of needs for business, there’s nothing that compares to R. In this article we saw why learning R is a great choice. In the next article we’ll show you how to learn R using the 80/20 Rule.
Learn R with Business Science University
Enjoy data science for business? We do too. This is why we created Business Science University where we teach you how to do Data Science For Busines (#DS4B) just like us!
Our first DS4B course (HR 201) is now available!
Who is this course for?
-
Data Analysts & Data Scientists In Business: Data savvy people seeking to make the link between data science and the business objectives to drive ROI for their organization.
-
Consultants: Data scientists working for companies in large consulting firms (e.g. Accenture, Deloitte, etc) and boutique consulting firms that are related to enterprise improvement and ROI.
-
Students: Future data scientists seeking to gain skills beyond their current program offering. Leveraging Business Science University gets you trained on high-demand skills placing you ahead of your peers in the job market.
What do you get it out of it?
You learn everything you need to know about how to apply data science in a business context:
-
Using ROI-driven data science taught from consulting experience!
-
Solve high-impact problems (e.g. $15M Employee Attrition Problem)
-
Use advanced, bleeding-edge machine learning algorithms (e.g. H2O, LIME)
-
Apply systematic data science frameworks (e.g. Business Science Problem Framework)
“If you’ve been looking for a program like this, I’m happy to say it’s finally here! This is what I needed when I first began data science years ago. It’s why I created Business Science University.”
Matt Dancho, Founder of Business Science
Here’s some additional information on the tool assessment. We have provided the code used to make the visualization, the criteria explanation, and the tool assessment.
Criteria Explanation
Our assessment of the most powerful DS4B tools was based on three criteria:
-
Business Capability (1 = Low, 10 = High): How well-suited is the tool for use in the business? Does it include features needed for the business including advanced analytics, interactivity, communication, interactivity, and web apps?
-
Ease of Learning (1 = Difficult, 10 = Easy): How easy is it to pick up? Can you learn it in a week of short courses or will it take a longer time horizon to become proficient?
-
Cost (Free/Minimal, Low, High): Cost has two undesirable effects. From a first-order perspective, the organization has to spend money. This is not in-and-of-itself undesirable because the software companies can theoretically spend on R&D and other efforts to advance the product. The second-order effect of lowering adoption is much more concerning. High-cost tools tend to have much less discussion in the online world, whereas open source or low-cost tools have great trends.
-
Trend (0 = Fast Decline, 5 = Stable, 10 = Fast Growth): We used StackOverflow Insights of questions as a proxy for the trend of usage over time. A major assumption is that growing number of Stack Overflow questions is that the usage is also increasing in a similar trend.
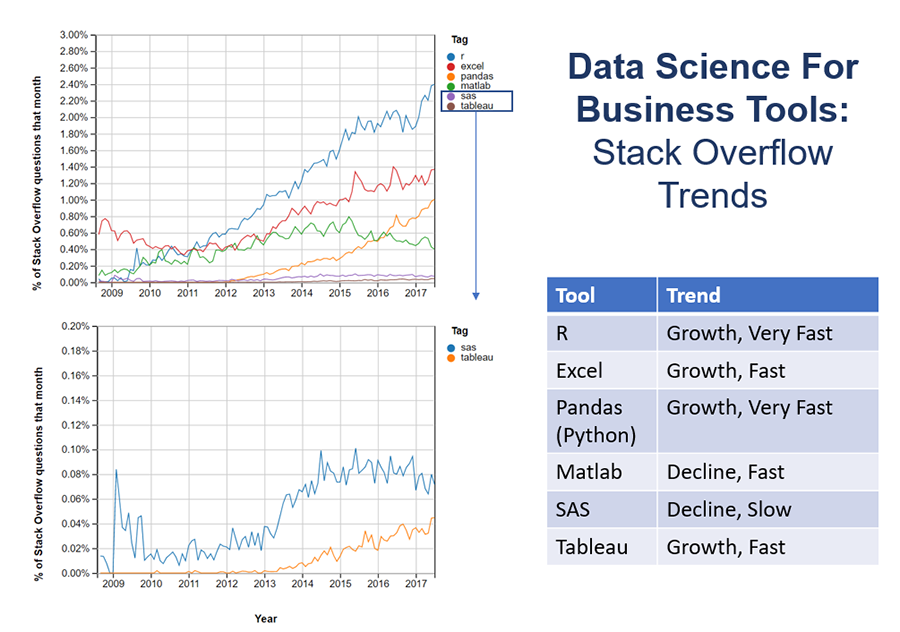
Source: Stack Overflow Trends
R:
- DS4B Capability = 10: Has it all. Great data science capability, great visualization libraries, Shiny for interactive web apps, rmarkdown for professional reporting.
- Learning Curve = 4: A lot to learn, but learning is getting easier with the tidyverse.
- Trend = 10: Stack overflow questions are growing at a very fast pace.
- Cost = Low: Free and open source
Python:
- DS4B Capability = 7: Has great machine learning and deep learning libraries. Can connect to any major database. Communication is limited by flask / Django web applications, which can be difficult to build. Does not have a business reporting infrastructure comparable to rmarkdown.
- Learning Curve = 4: A lot to learn, but learning is relatively easy compared to other object oriented programming languages like Java.
- Trend = 10: Stack overflow questions are growing at a very fast pace.
- Cost = Low: Free and open source
Excel:
- DS4B Capability = 4: Mainly a spreadsheet software but has programming built in with VBA. Difficult to integrate R, but is possible. No data science libraries.
- Learning Curve = 10: Relatively easy to learn and become an advanced user.
- Trend = 7: Stack overflow questions are growing at a relatively fast pace.
- Cost = Low: Comes with Microsoft Office, which most organizations use.
Tableau:
- DS4B Capability = 6: Has R integrated, but is very difficult to implement advanced algorithms and not as flexible as R+shiny.
- Learning Curve = 7: Very easy to learn.
- Trend = 6: Stack overflow questions are growing at a relatively fast pace.
- Cost = Low: Free public version. Enterprise licenses are relatively affordable.
PowerBI:
- DS4B Capability = 5: Similar to Tableau, but not quite as feature-rich. Can integrate R to some extent.
- Learning Curve = 8: Very easy to learn.
- Trend = 6: Expected to have same trend as Tableau.
- Cost = Low: Free public version. Licenses are very affordable.
Matlab:
- DS4B Capability = 6: Can do a lot with it, but lacks the infrastructure to use for business.
- Learning Curve = 2: Matlab is quite difficult to learn.
- Trend = 1: Stack overflow growth is declining at a rapid pace.
- Cost = High: Matlab licenses are very expensive. Licensing structure does not scale well.
SAS:
- DS4B Capability = 8: Has data science, database connection, business reporting and visualization capabilities. Can also build applications. However, limited by closed-source nature. Does not get latest technologies like tensorflow and H2O.
- Learning Curve = 4: Similar to most data science programming languages for the tough stuff. Has a GUI for the easy stuff.
- Trend = 3: Stack Overflow growth is declining.
- Cost = High: Expensive for licenses. Licensing structure does not scale well.
library(tidyquant)
library(ggrepel)

data_apps <- tribble(
  ~application, ~business_capability, ~ease_of_learning, ~trend, ~cost,
  "R",          10,                   4,                 10,     "Free",
  "Python",     7,                    4,                 10,     "Free",
  "Excel",      4,                    10,                7,      "Low",
  "Tableau",    6,                    7,                 6,      "Low",
  "PowerBI",    5,                    8,                 6,      "Low",
  "Matlab",     6,                    2,                 1,      "High",
  "SAS",        8,                    4,                 3,      "High"
)

cap <- paste0(
  "Why R? Tools like Excel, Tableau, PowerBI are easier to learn, but have lower ",
  "Business Capability. Tools like Python, SAS, and Matlab have high ",
  "Data Science Capability, but lack the visualization and interactive ",
  "application tools needed for business. R has the best data science, visualization, ",
  " and interactive tools plus it's free!"
  )

data_apps %>%
  ggplot(aes(x = business_capability, y = ease_of_learning,
             color = cost, size = trend)) +
  geom_point() +
  geom_label_repel(aes(label = application, fill = application),
                   size = 3.5,
                   fontface = 'bold', color = 'white',
                   box.padding = 0.1, point.padding = 0.5,
                   segment.color = 'grey50', segment.size = 1) +
  geom_smooth(color = palette_dark()[[1]], method = "lm", se = FALSE, show.legend = F) +
  expand_limits(x = c(0, 10), y = c(0, 10)) +
  theme_tq() +
  theme(legend.direction = "vertical") +
  scale_fill_tq() +
  scale_color_tq() +
  scale_y_continuous(breaks = seq(0, 10, 2)) +
  scale_x_continuous(breaks = 0:10) +
  scale_size_continuous(range = c(2, 14)) +
  labs(title = "DS4B Tools: Capability Vs Learning Curve",
       subtitle = "R has a longer learning curve but has a massive business capability rating",
       caption = label_wrap_gen(115)(cap),
       x     = "Data Science For Business Capability Rating",
       y     = "Learning Curve Rating",
       color = "Cost",
       size  = "Trend",
       fill  = "Tool")
R Resources