SweetViz: Automated Exploratory Data Analysis (EDA) in Python
Written by Matt Dancho
SweetViz is a Python library that makes exploratory data analysis (EDA) fast and effective. Learn how to investigate feature relationships using correlation and associations in the automated SweetViz report.
Python Tips Weekly
This article is part of Python-Tips Weekly, a bi-weekly video tutorial that shows you step-by-step how to do common Python coding tasks.
Here are the links to get set up. 👇
Video Tutorial
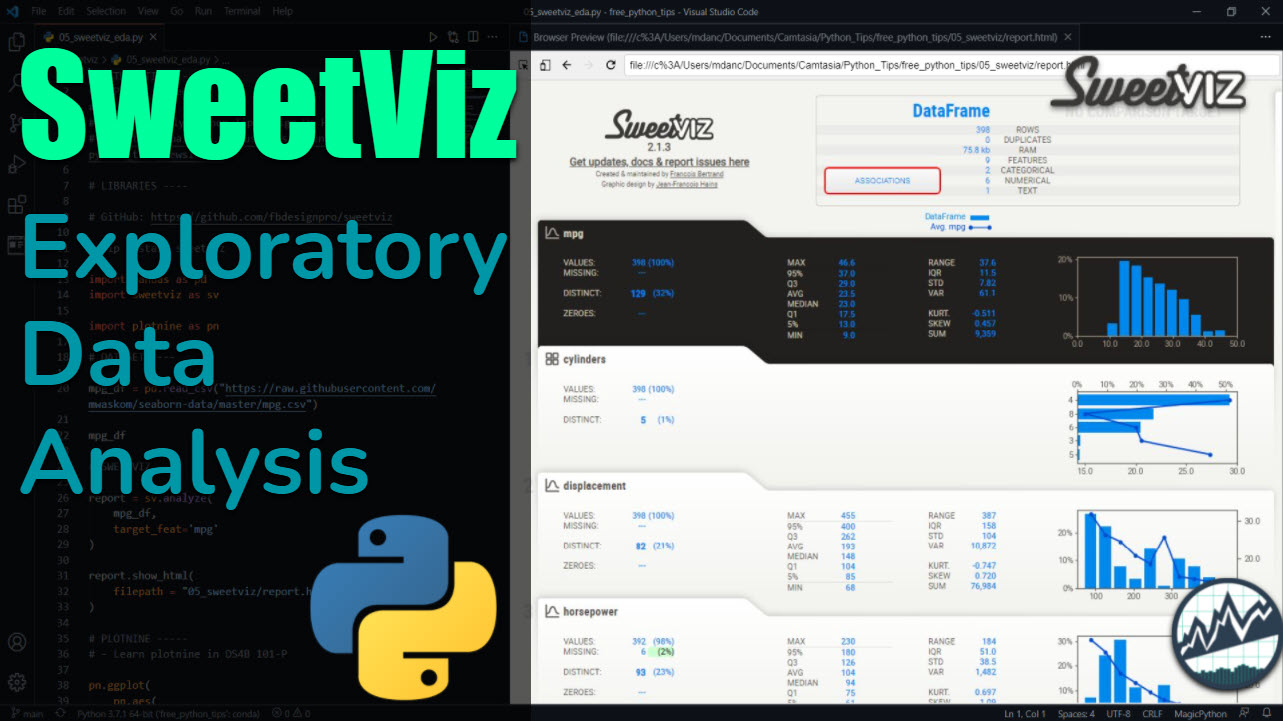
Follow along with our Full YouTube Video Tutorial.
Learn how to use SweetViz to make and investigate an automated EDA Report.
(Click image to play tutorial)
Before we get started, get the Python Cheat Sheet
The Python Ecosystem is LARGE. To help, I’ve curated many of the 80/20 Python Packages, those I use most frequently to get results. Simply Download the Ultimate Python Cheat Sheet to access the entire Python Ecosystem at your fingertips via hyperlinked documentation and cheat sheets.
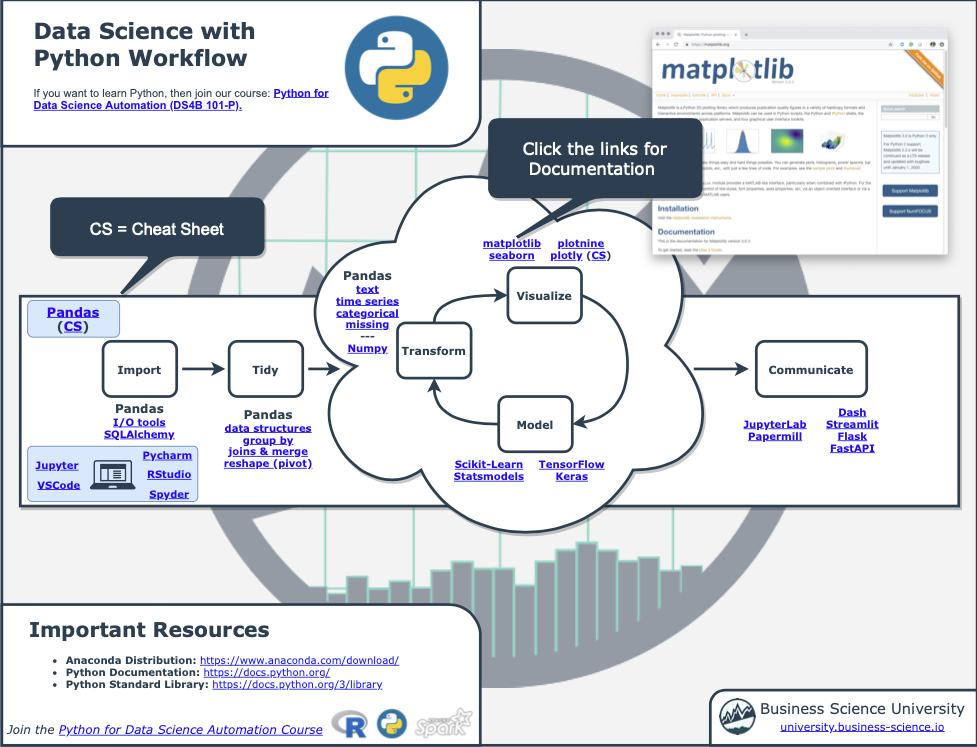 (Click image to download)
Onto the tutorial.
SweetViz: Automating EDA
Let’s check out how to automate an exploratory data analysis report with SweetViz.
Get the code.
Step 1: Load Libraries and Data
First, let’s load the libraries and data. From the libraries, we’ll import pandas, sweetviz and my favorite plotting library, plotnine.
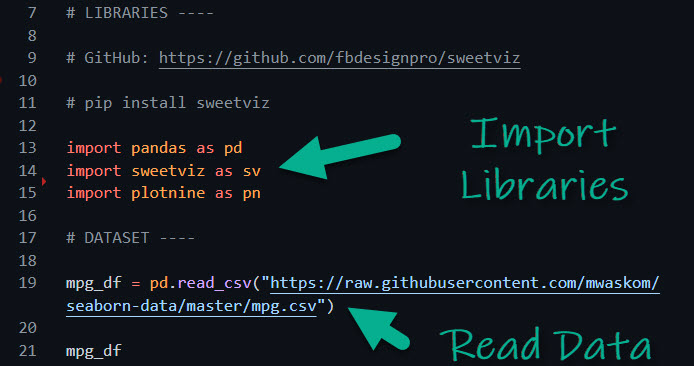
Get the code.
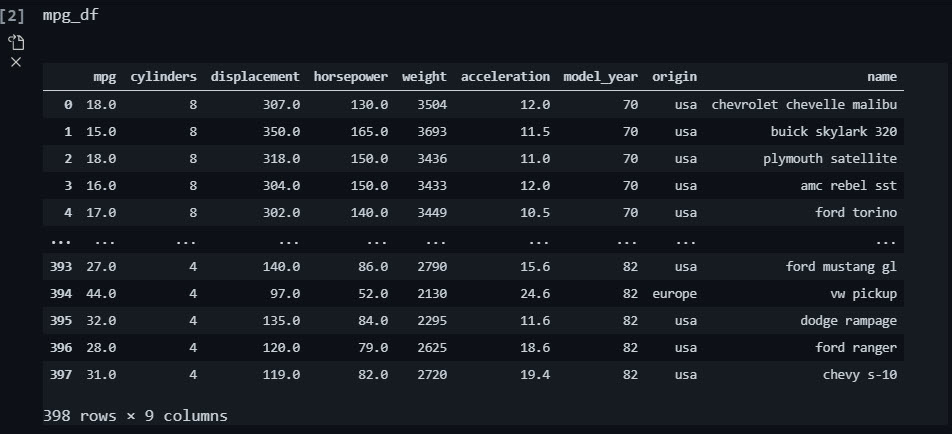
The mpg_df data set contains information on fuel efficiency (mpg) along with important vehicle attributes for 398 vehicles.
Get the code.
Step 2: Make the SweetViz EDA Report in 2 Lines of Code
Goal: Understand the relationship between Fuel Economy (MPG) and features in this dataset
We can assess the relationship between vehicle fuel economy and the explanatory features using the sweetviz report. SweetViz automates the process of creating the EDA report in two lines of code.
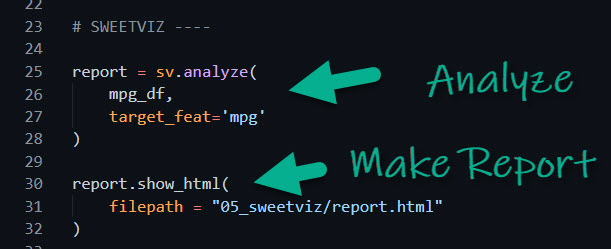
Get the code.
This creates the SweetViz EDA Report.
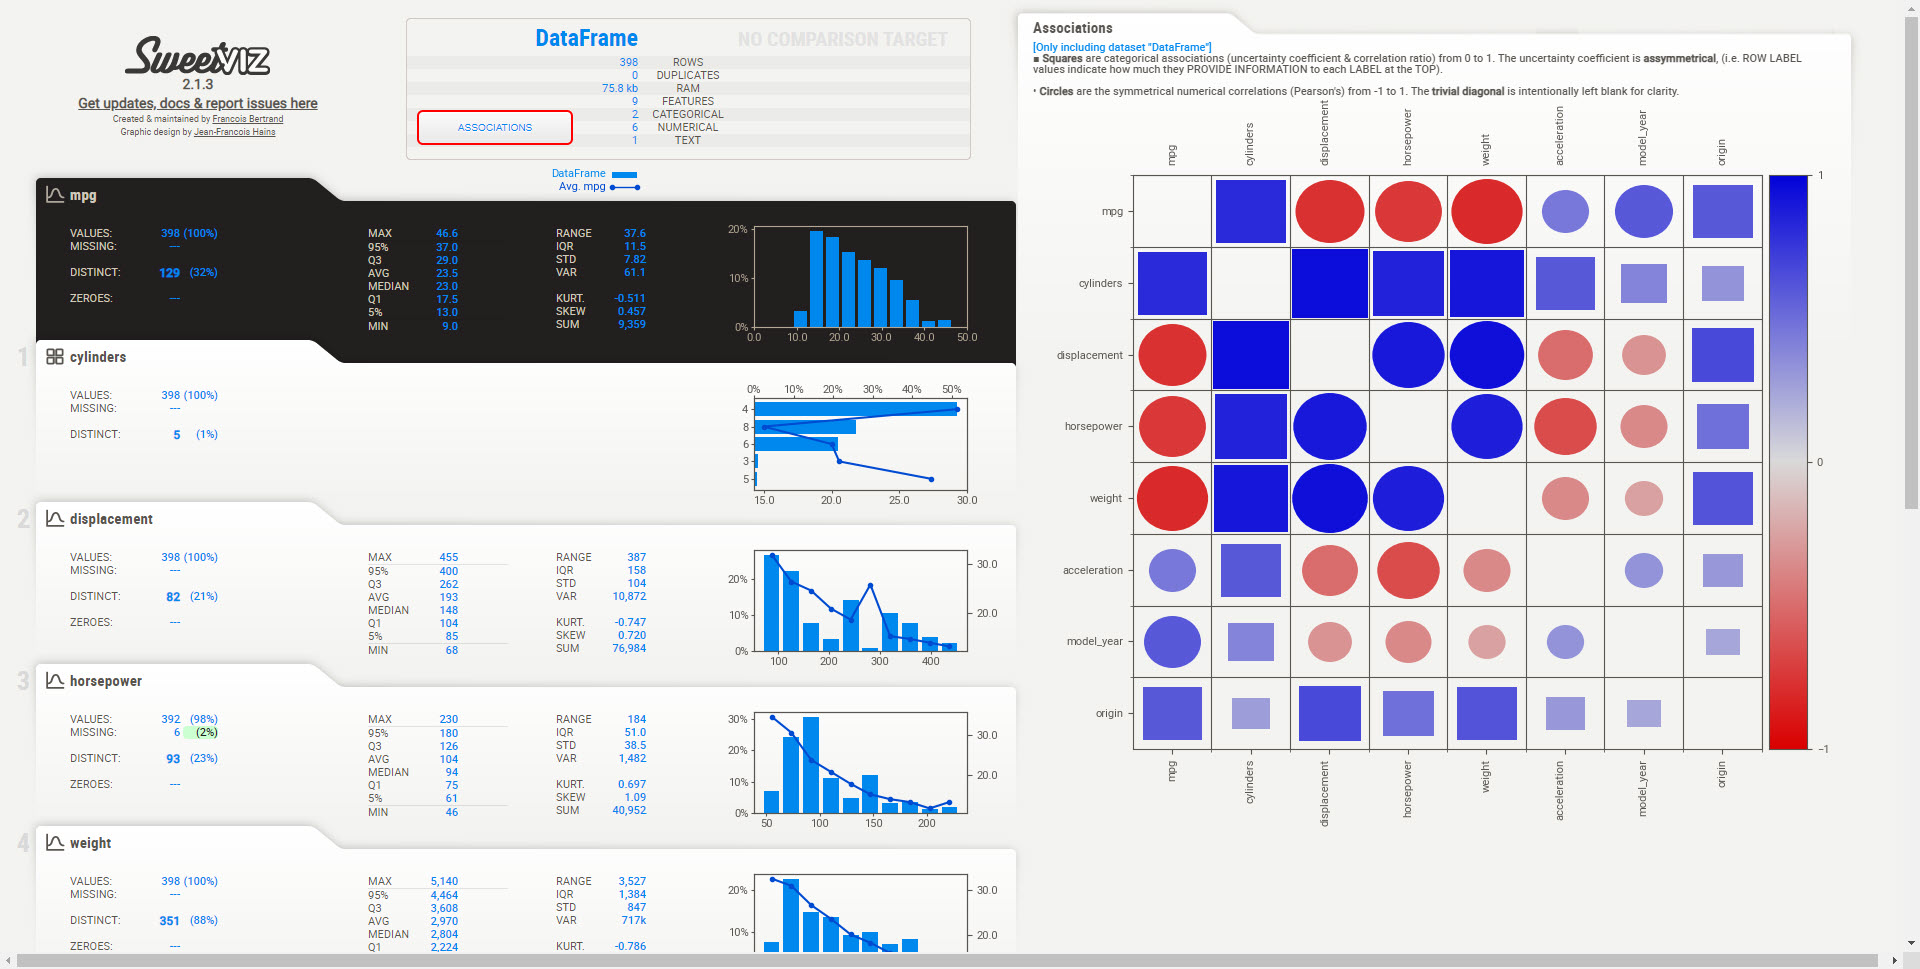
Step 3: Investigate the Feature Correlation (Associations)
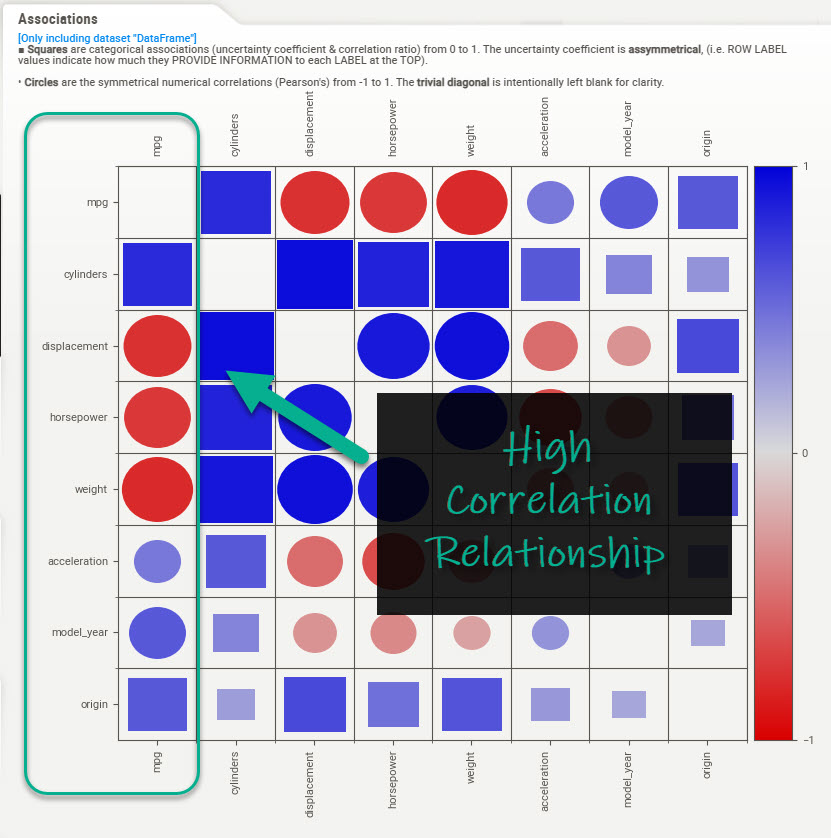
We can investigate the feature associations / correlations and see that number of cylinders (engine size), displacement (engine volume), horsepower, weight have a relationship to vehicle fuel efficiency.
3A: High-Level Correlations (Associations)
We start with an overall view of the high-level relationships.
-
The squares are categorical features. Their relationships range from 0 to 1 indicating associative strength only. We need to need to inspect tabs for categories like cylinder, which has a high associative strength to determine its effect on MPG.
-
The circles are numeric features. Their relationships range from -1 to 1 following a Pearson Correlation. We can see positive and negative relationships indicated by the sign (+/-) and strength of relationship (closer to +/-1 is strong, closer to zero is weak).
3B: Distribution Analysis: Individual Features
We can take a step further and investigate individual features to see how each relate to the target by comparing their distributions.
Feature Tabs
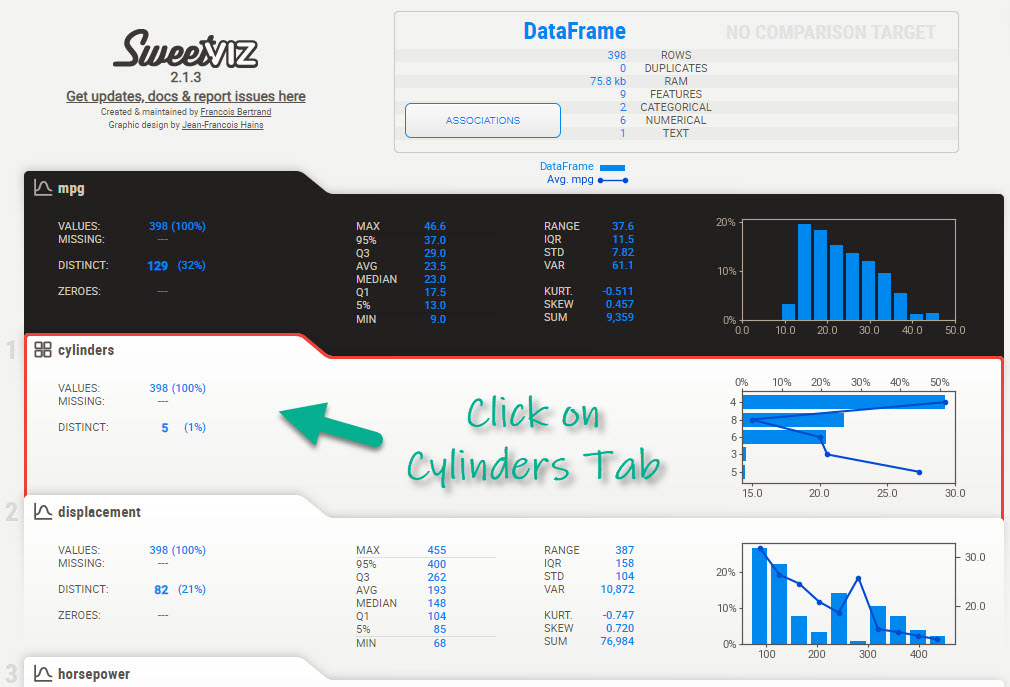
For example, we can investigate “cylinders” to see how the distributions co-vary. Just click on the “cylinders” tab.
Exploratory Panels
This opens up an exploratory panel with useful information that compares the distribution of vehicles by cylinder to their average MPG.
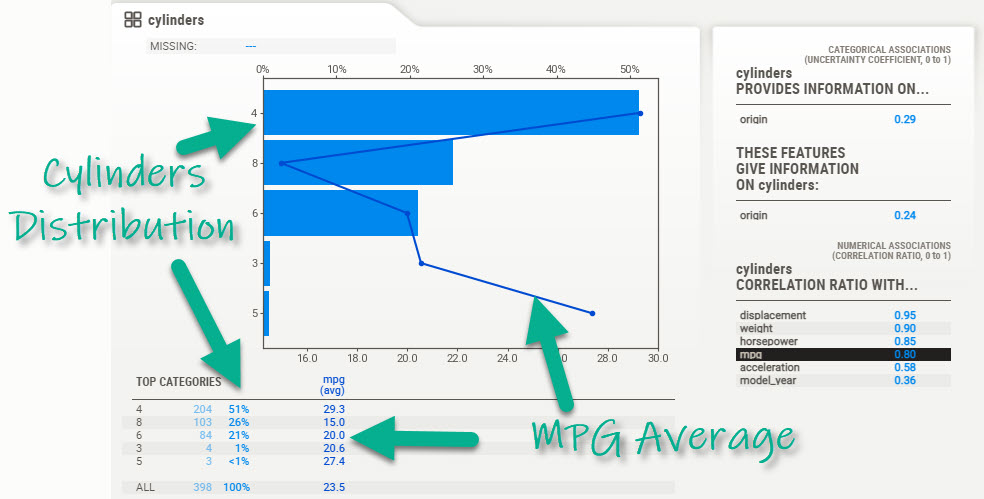
We can see that:
- 4 Cylinder Engines: Have the highest average MPG
- 8 Cylinder Engines: Have the lowest average MPG
It’s that easy to explore your dataset!
Summary
Exploratory data analysis can be automated with the python SweetViz reporting package. SweetViz makes it fast and easy to explore features and determine relationships to a target. In our case, we saw that 4 cylinder engines have the highest average MPG while 8 cylinder engines have the lowest average MPG.
Learn More: Business Process Automation with Python
Businesses are transitioning manual processes to Python for automation. Learn how in our new course, Python for Data Science Automation. Perform and end-to-end business forecast automation using pandas, sktime, and papermill, and learn Python in the process.