Siuba: Data wrangling with dplyr in Python
Written by Matt Dancho
This article is part of Python-Tips Weekly, a bi-weekly video tutorial that shows you step-by-step how to do common Python coding tasks.
Here are the links to get set up. 👇
Siuba Video Tutorial
For those that prefer Full YouTube Video Tutorials.
Learn how to use Siuba in our free 10-minute YouTube video.
(Click image to play tutorial)
Watch our full YouTube Tutorial
What is Siuba?
The siuba python library brings the power of R’s dplyr and the tidyverse to Python. Gain access to functions like:
-
select() - keep certain columns of data.
-
filter() - keep certain rows of data.
-
mutate() - create or modify an existing column of data.
-
summarize() - reduce one or more columns down to a single number.
-
arrange() - reorder the rows of data.
Before we get started, get the Python Cheat Sheet
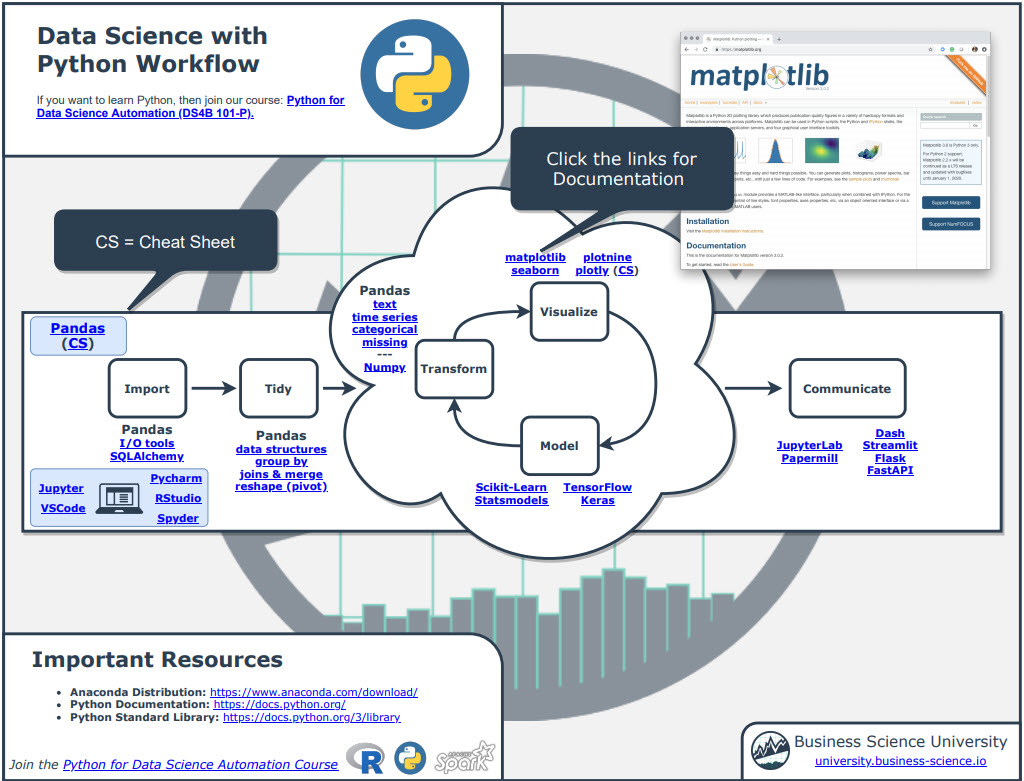
Siuba is great for data wrangling in Python if you are coming from an R background. But, you might want to explore documentation for the entire Python Ecosystem. I’ll use the Ultimate Python Cheat Sheet.
Ultimate Python Cheat Sheet:
First, Download the Ultimate Python Cheat Sheet. This gives you access to the entire Python Ecosystem at your fingertips via hyperlinked documenation and cheat sheets.
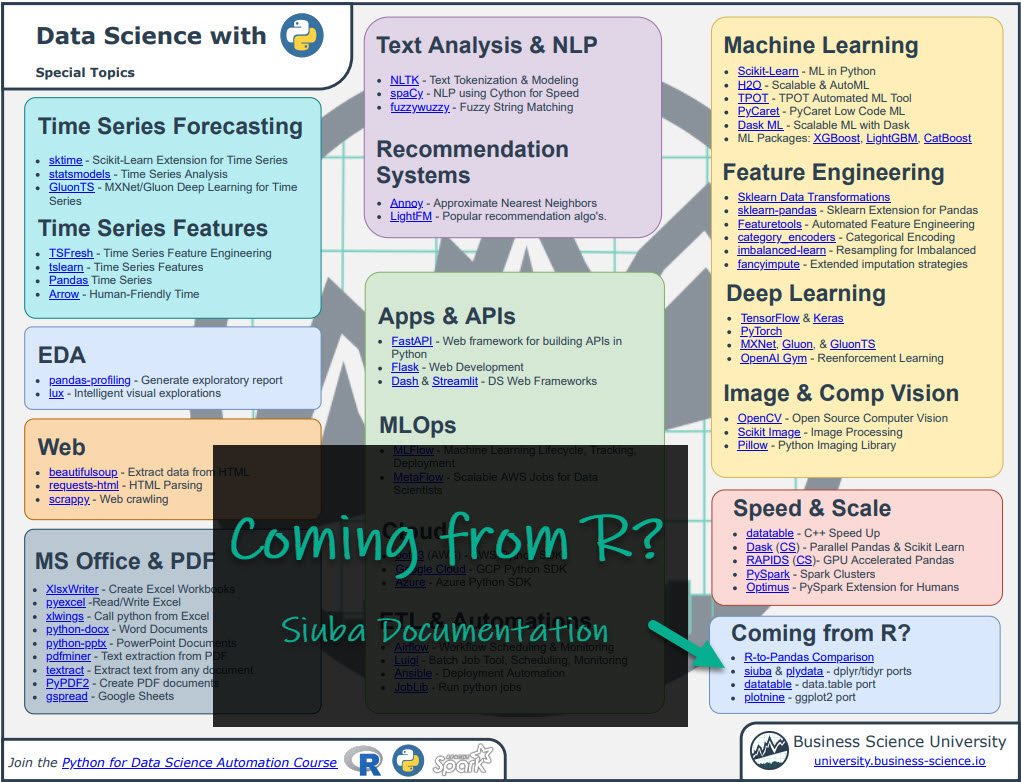
Navigate to “Coming From R?” Section
Next, go to the section, “Coming from R?”. You can quickly get to the Siuba Documentation.
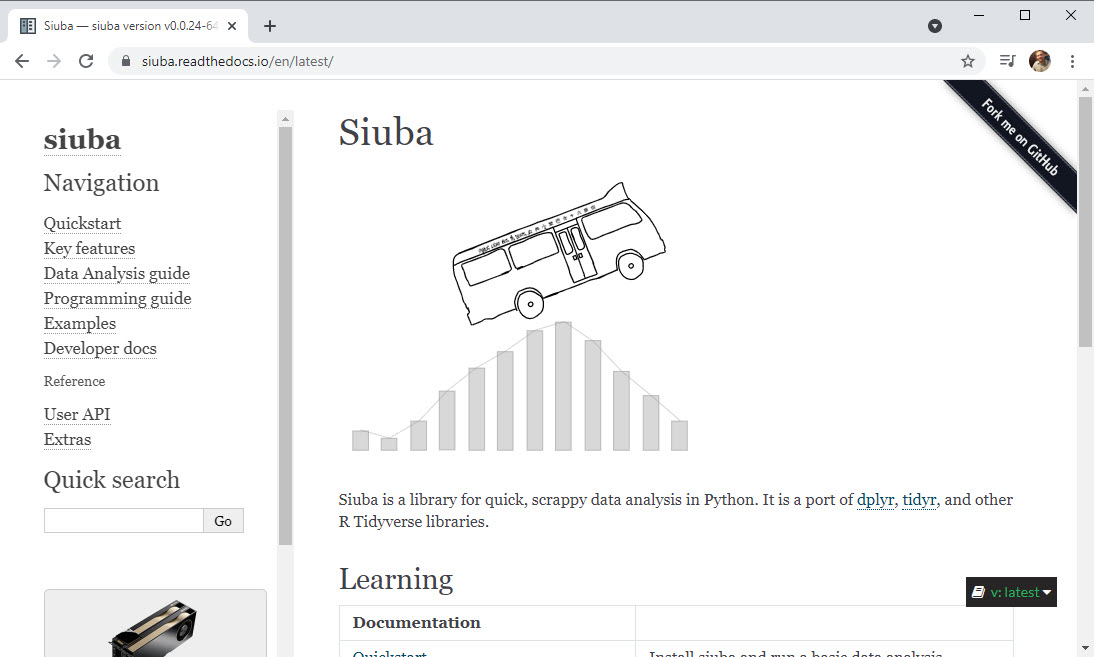
Explore Siuba
You have access to the Siuba Documentation at your fingertips.
Onto the tutorial.
How Siuba Works
From the Siuba Documentation, you can see that there are “verbs”, “siu expressions”, and the pipe (>>). We’ll test these out in our tutorial.
| concept |
example |
meaning |
| verb |
group_by(...) |
a function that operates on a table, like a DataFrame or SQL table |
| siu expression |
_.hp.mean() |
an expression created with siuba._, that represents actions you want to perform |
| pipe |
mtcars >> group_by(...) |
a syntax that allows you to chain verbs with the >> operator |
Taking Siuba for a Test Spin
Let’s try out siuba’s data wrangling capabilities.
Step 1: Load Libraries and Data
First, let’s load the libraries and data. From the libraries, we’ll import numpy and pandas along with:
-
_: Needed to create “siu expressions”
-
dplyr.verbs: We’ll import group_by(), summarize(), and mutate()
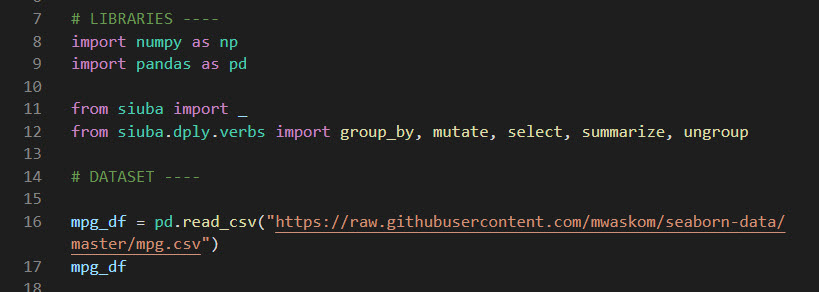
Get the code.
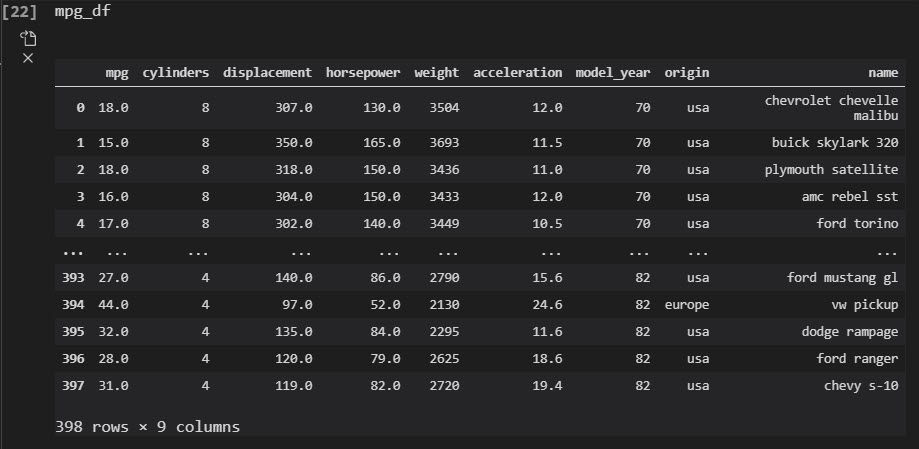
We’ll also load the mpg_df data set.
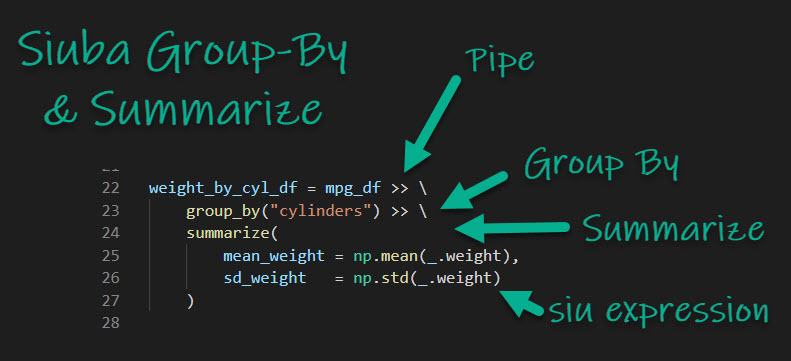
Step 2: Group By and Summarize
Goal: Mean and Standard Deviation of weight by engine size
We’ll perform a basic operation: group_by() and summarize() to get the mean and standard deviation of vehicle weight by engine size.
Group-By Summarize Code
Get the code.
Let’s explain each operation in detail so you understand what’s going on.
-
Pipe (>>): This sends the output of a previous call (a Pandas DataFrame) as the first input of the next function.
-
Group By (group_by()): This tells python that we want to perform an operation group-wise. We specify by the “cylinder” column.
-
Summarize (summarize()): This tells python that, for each group, we want to summarize the weight to return the mean and standard deviation.
-
Inside the Summarize, we use “siu expressions”, which allow us to reference columns (e.g. _.weight) while we perform the summarization.
-
We take advantage of numpy for our summarization, using np.mean() and np.std() to calculate mean and standard deviation.
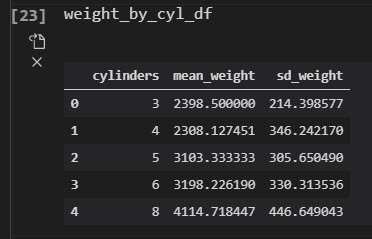
Code Output
This returns the vehicle weight summarized by the engine size (number of cylinders).
Step 3: More Advanced Example (Group By and Mutate)
Goal: De-mean the mpg by average of each cylinder
We’ll go through a more complex example using a group_by() and mutate(). See if you can figure out what’s going on here. Tip - Try reading it like a paragraph in a text.
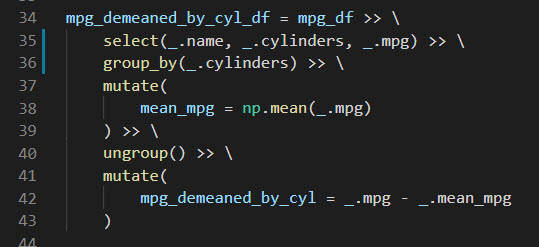
Get the code.
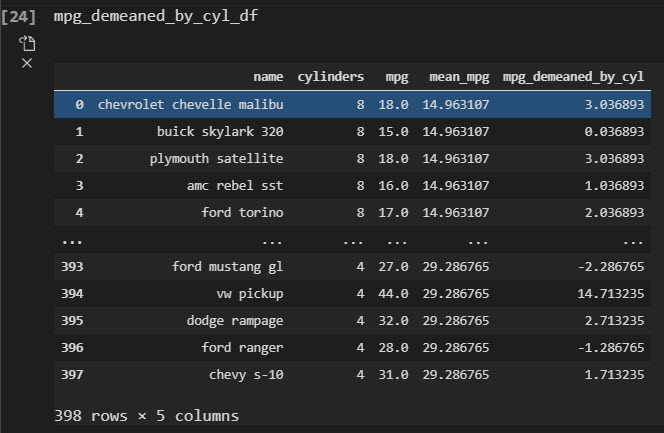
This returns the vehicle fuel efficiency (mpg) de-meaned (removing the average by cylinder class). So now we can compare how the fuel efficiency of each vehicle model compares to the average fuel efficiency within groups of the same engine size.
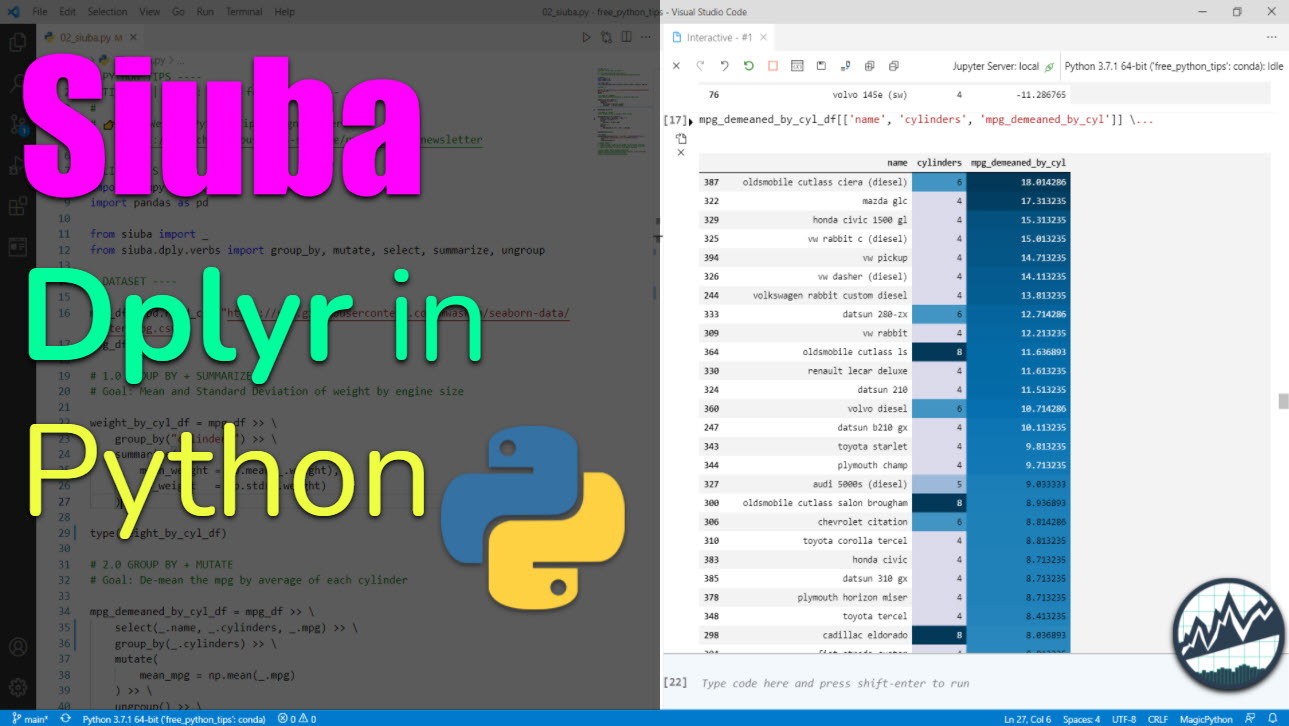
Step 4: From Siuba To Pandas
Goal: Format the de-meaned MPG to highlight most fuel efficient vehicles by engine size.
Siuba is great. It returns a DataFrame, which means we can use Pandas. One thing you might want to do is format the background in the table to highlight if vehicle model’s fuel efficiency is above or below the average by engine size. We can do this with Pandas Table Styles.
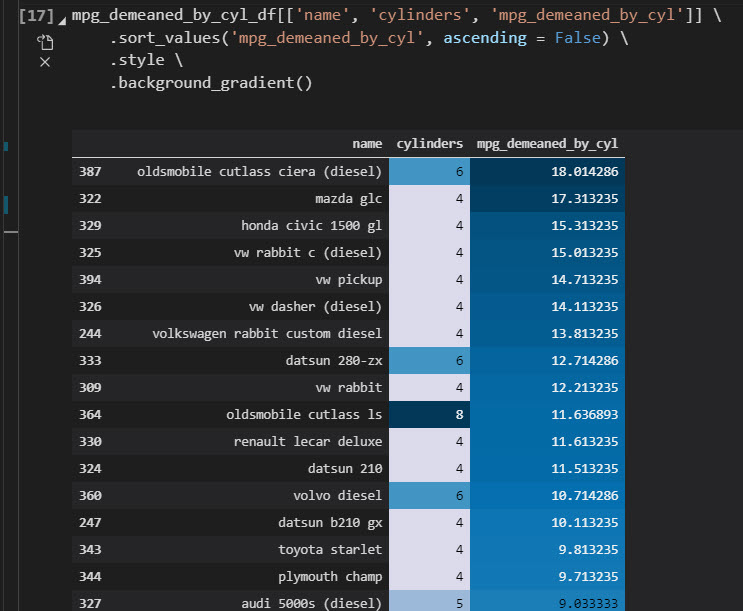
Get the code.
Summary
This was a short introduction to siuba, which brings dplyr to python. If you’re coming from R, siuba is a great package to warm yourself up to Python.
With that said, you’re eventually going to want to learn pandas, the most widely used data wrangling tool in Python. Why?
- Most Python Teams use Pandas
- 99% of data wrangling code is written in Pandas
So, it makes sense to eventually learn Pandas to help with communication and working on R/Python teams.
If you’d like to learn data science for business with Python and Pandas from an R-programmers guidance, then read on. 👇
My Journey Learning R and Python
Everyone knows me as the R guy. With the launch of my new Python course, I’m reflecting on my journey.
I started learning R in 2013 after Excel let me down (many many times with the dreaded blue screen of death). I had it. My data was too big, and I needed new tools that I could count on.
I turned to R for it’s statistical and reporting capabilities. The combination of dplyr and ggplot2 were like thunder & lightning. Add on Rmarkdown for reporting, and game over. Then I found out about shiny, and I was in heaven.
Why Python then?
It’s been an amazing learning experience, but now I recognize it was one dimensional.
Over the past 12 months I’ve been learning Python. I started by building my first R/Python Integration: Modeltime GluonTS, which ports into R the AWS GluonTS library written in Python.
This was my first realization that R and Python can work in harmony. Seeing the deep learning forecasts from GluonTS being shared in R was beautiful.
So I decided 12-months ago it was time to begin teaching Python. And I began working on a course plan.
My course philosophy
It’s my belief that Data Science Teams are changing. They now need to:
This is why I built Python for Data Science Automation.
So learners like me can begin learning Python in a project-focused way that shows the beauty of the language for data science + software engineering. It’s a beginner course too.
How I can help
If you are interested in learning Python and the ecosystem of tools at a deeper level, then I have a streamlined program that will get you past your struggles and improve your career in the process.
It’s called the Python for Data Science Automation. It’s an integrated course that teaches you Python by integrating tools and solving real business problems.

The result is that you break through previous struggles, learning from my experience & our community of 2000+ data scientists that are ready to help you succeed. You’ll learn a ton going through our Business Process Automation project.
Best of All: I am an R-Programmer that has Learned Python
My background is R-programming. Yet, I’ve found that learning to use both R and Python is absolutely the future of data science.
Ready to take the next step?
Then let’s get started.
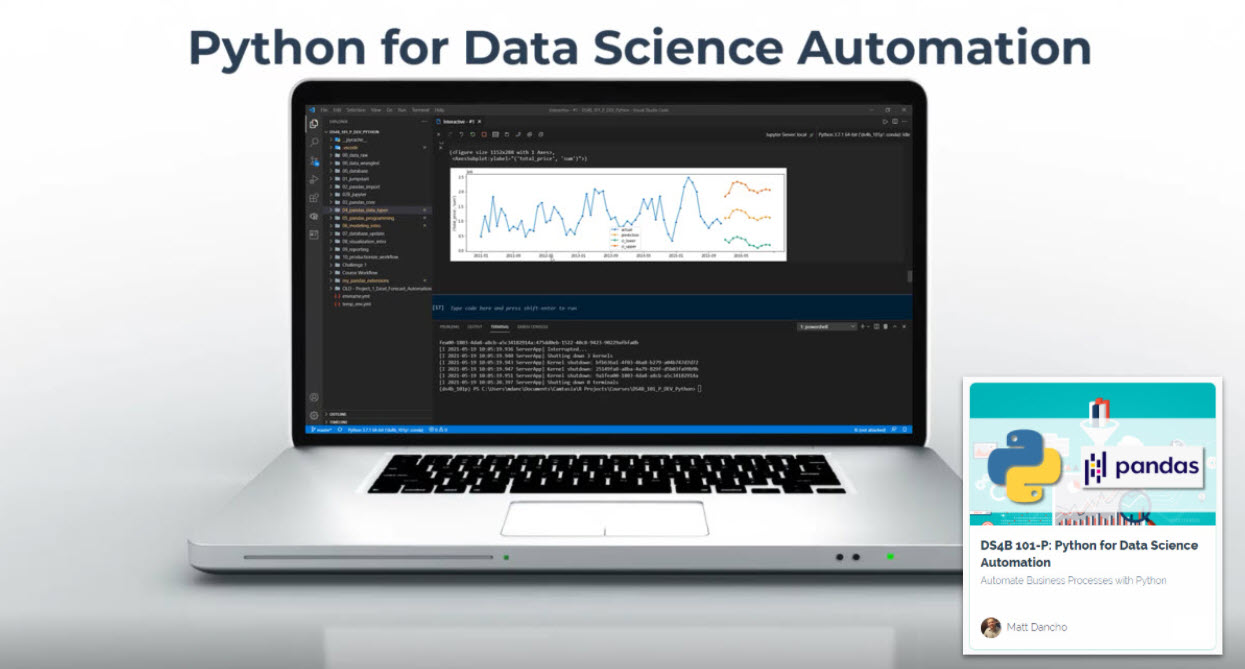 (Click image to go to course)