Pandas Profiling: Make Exploratory Data Analysis Reports
Written by Matt Dancho
This article is part of Python-Tips Weekly, a bi-weekly video tutorial that shows you step-by-step how to do common Python coding tasks.
Here are the links to get set up. 👇
Pandas Profiling Video Tutorial
For those that prefer Full YouTube Video Tutorials.
Learn how to use Pandas Profiling in our free 8-minute YouTube video.
 (Click image to play tutorial)
Watch our full YouTube Tutorial
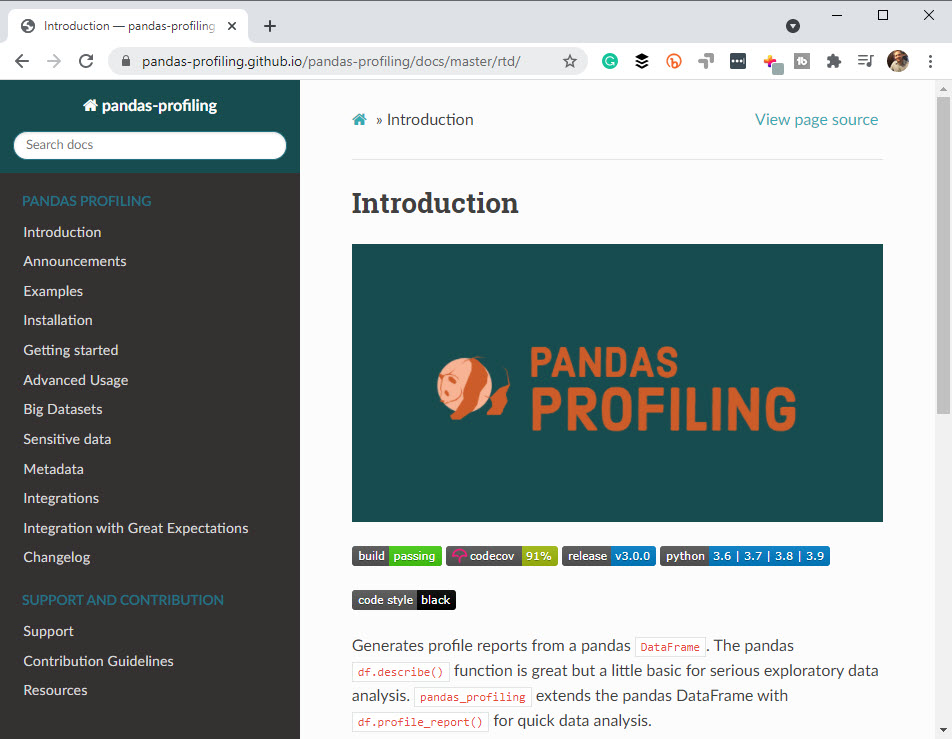
What is Pandas Profiling?
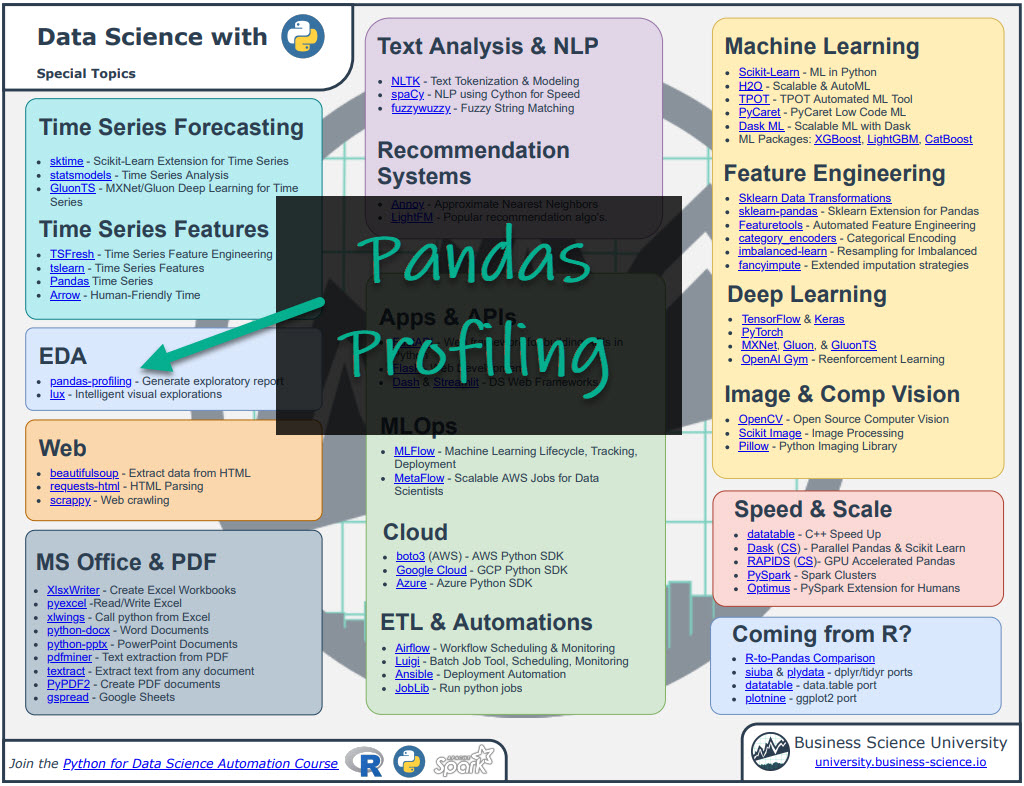
Pandas Profiling is an awesome python package for Exploratory Data Analysis (EDA). It extends pandas for statistical summaries including correlations, missing values, distributions, and descriptive statistics. It’s great for understanding Data Quality too!
Before we get started, get the Python Cheat Sheet
Pandas Profiling is great for exploring data. But, you’ll still need to learn how to wrangle data with pandas and visualize data with plotnine. For those topics, I’ll use the Ultimate Python Cheat Sheet to refer to pandas and plotnine code in my workflow.
Quick Example:
Download the Ultimate R Cheat Sheet Then Click the “Pandas Profiling” on Page 2, which opens the Pandas Profiling Documentation.
Now you’re ready to quickly reference Pandas Profiling functions.
Onto the tutorial.
How Pandas Profiling Works
Pandas profiling is super simple to run. Simply:
- Import Packages
- Read data
- Run the
ProfileReport()
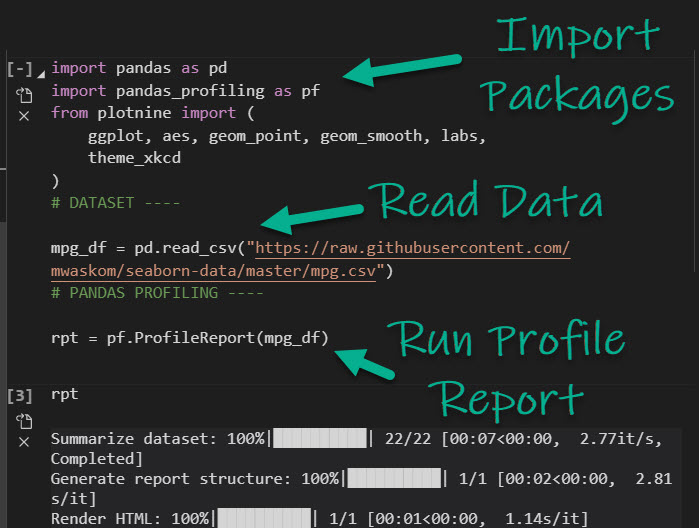
Get the code.
This generates the Pandas Profiling Report.

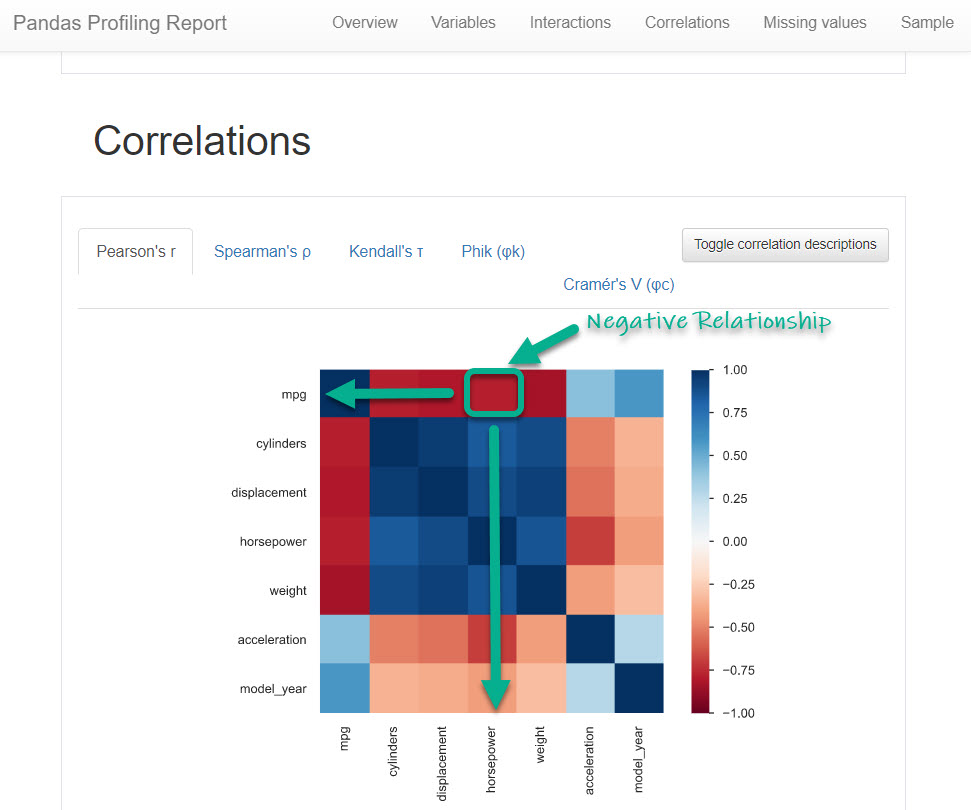
Getting Insights from the Pandas Profiling Report
Let’s quickly pan to the “Correlation” Report Section. We can see that there is a negative correlation between Fuel Economy (mpg) and Engine Horsepower. But how to we explore this negative relationship further?
Get the code.
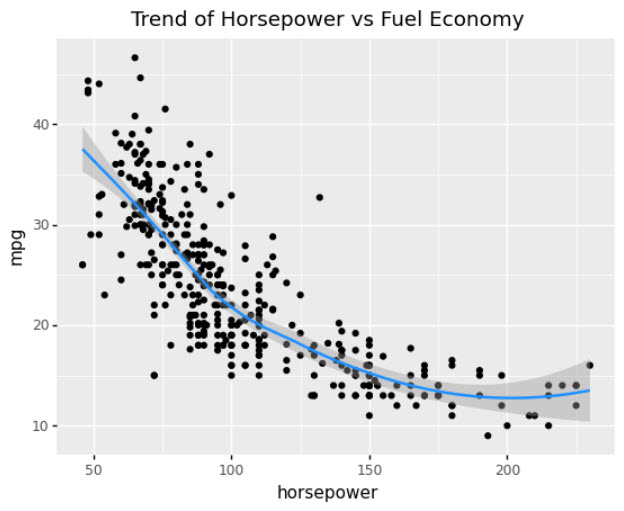
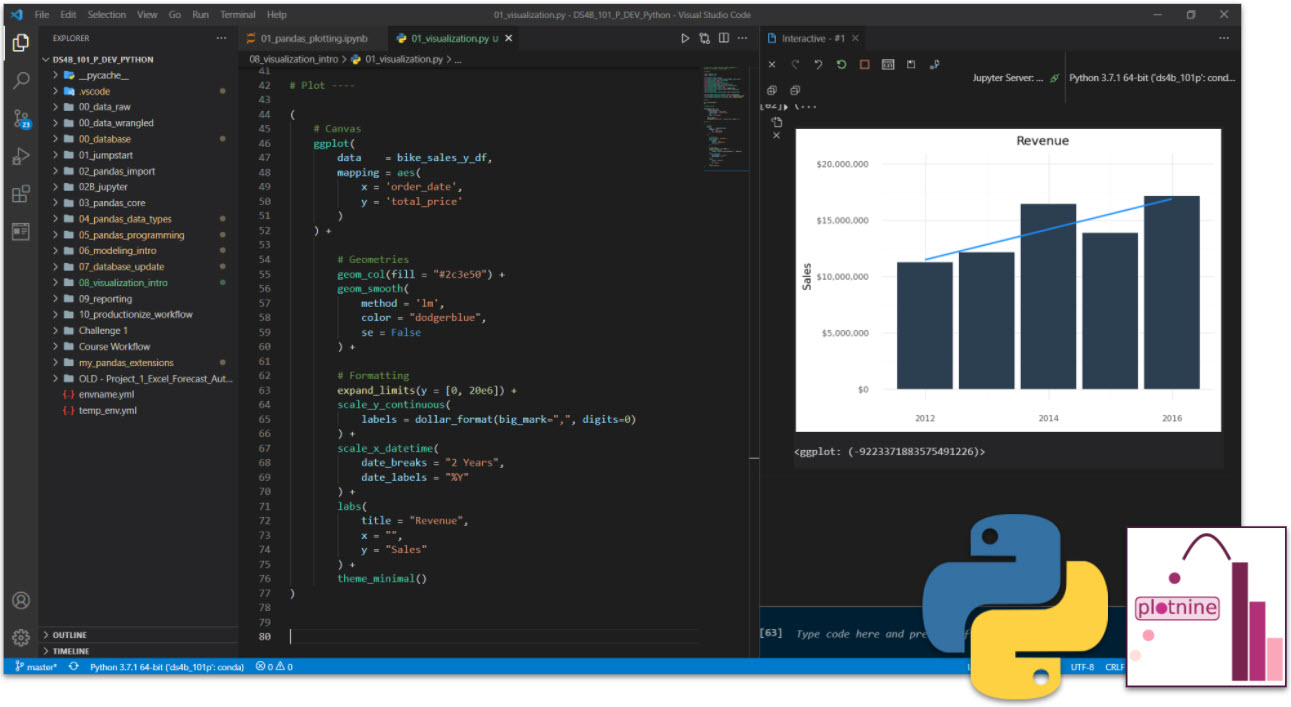
Plotnine to the Rescue
ggplot2 for Python Users
We can use plotnine to quickly make a visualization using geom_point() and geom_smooth(). This highlights the relationship and showcases that its nonlinear. It drops fast initially but beyond 150 HP the horsepower stabilizes.
Get the code.
Why Learning plotnine is essential
I wouldn’t be nearly as effective as a data scientist without knowing plotnine. In fact, data visualization has been one of two skills that have been critical to my career (with the other one being data transformation).
Career Tip: Learn plotnine
If I had one piece of advice, it would be to start learning plotnine. Let me explain.
Learning plotnine in Python (and ggplot2 in R) helped me to:
- Explain complex topics to non-technical people
- Develop good reports that showcased important points visually
- Make persuasive arguments that got the attention of Senior Management and even my CEO
So, yes, learning plotnine / ggplot2 was absolutely essential to my career. I received many promotions and got the attention of my CEO using plotnine effectively.
If you’d like to learn plotnine and data science for business, then read on. 👇
My Struggles with Learning Data Science
It took me a long time to learn data science. And I made a lot of mistakes. I specifically had a tough time navigating the ever increasing landscape of tools and packages, trying to pick between R and Python, and getting lost along the way.
If you feel like this, you’re not alone.
In fact, that’s the driving reason that I created Business Science and Business Science University (You can read about my personal journey here).
What I found out is that:
-
Data Science does not have to be difficult, it just has to be taught smartly
-
Anyone can learn data science fast provided they are motivated.
How I can help
If you are interested in learning Python and the ecosystem of tools at a deeper level, then I have a streamlined program that will get you past your struggles and improve your career in the process.
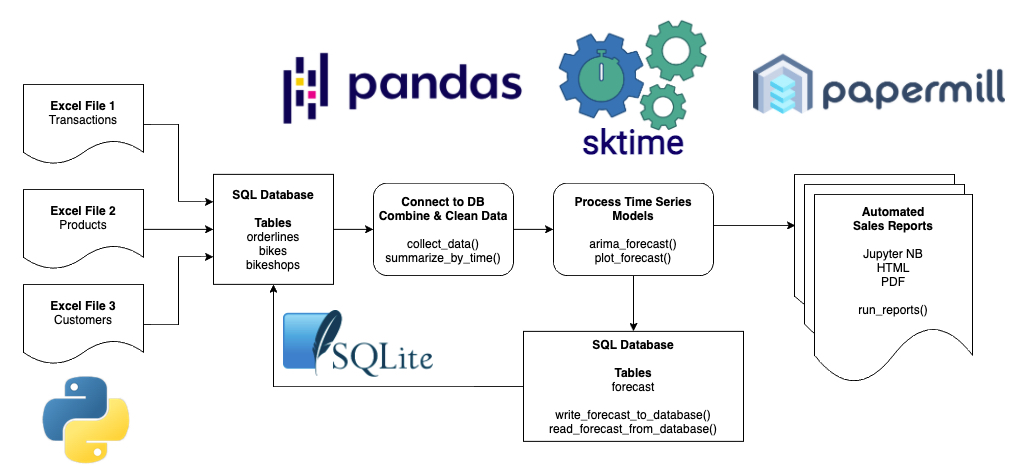
It’s called the Python for Data Science Automation. It’s an integrated course that teaches you Python by integrating tools and solving real business problems.

The result is that you break through previous struggles, learning from my experience & our community of 2000+ data scientists that are ready to help you succeed. You’ll learn a ton going through our Business Process Automation project.
Ready to take the next step?
Then let’s get started.
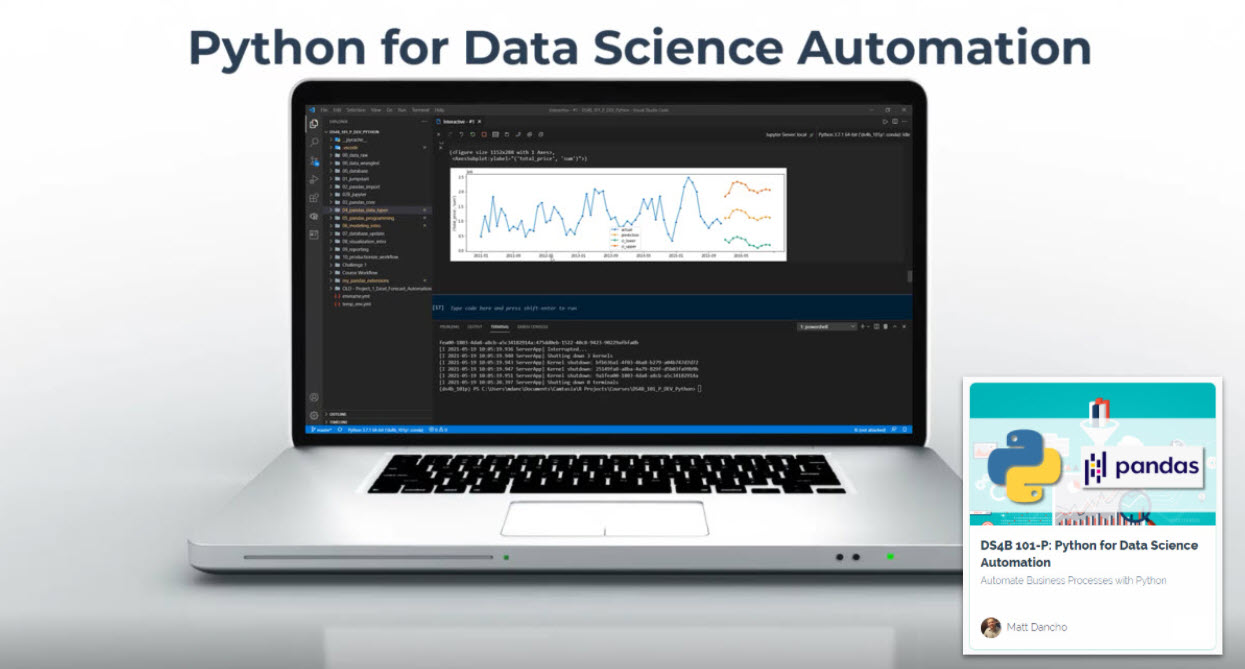 (Click image to go to course)