How I Started My Data Science Business
Written by Matt Dancho
Updated July 2021
This is a true story based on how I created my data science company from scratch. It’s a detailed documentation of my personal journey along with the company I founded, Business Science, and the data science educational university I started, Business Science University.
Before we get started, if you are entertaining the idea of getting started on this journey I will cut to the chase. It’s been an amazing, life-altering journey. It’s also been a heck of a lot of work, effort, time, and energy. I’ve gotten lucky too.
The journey will try your patience. You will question yourself. You will be spread thin. You will need to learn from failure. You will have to pick yourself up when you get knocked down. You will need to depend on friends. You must be willing to ask for help.
But most importantly… If you love it, you will do what it takes to build it no matter what.
The Beginning
My company, Business Science, was founded in February of 2017. But, that wasn’t the beginning. Not even close.
The official beginning was in 2013 when I made the leap to learning the R programming language. It was the best decision I’ve ever made.
I started learning R because of a change in my career. I’d recently been promoted into a sales management role (I was previously a mechanical engineering manager). Knowing nothing about sales, I searched for how I could add value to the organization.
My conclusion was that I was good with data and analytics. I had just started taking my MBA at the time, and for every class assignment I was the team member doing the analysis. Typically in Excel.
In parallel, I had been managing a portfolio of my personal investments since 2007. I got my butt handed to me during the financial crisis of 2008. By 2011, I had bounced back and even grew my investments. However, I knew I needed to be smarter about what I was doing. I began performing investment analyses also in Excel.
One day at work, I was trying to read all of our sales data into Excel. This was silly because Excel breaks at about 50MB. The data I was trying to read in was over 1M rows by 60 columns or so. Guess what happened.
Excel crashed.

...Excel just crashed my PC for the 8th time today.
Trying Python and R
I’d been searching for better ways to work with data, and I (vaguely) knew of Python and R. It turned out Excel crashing was what I needed to get started learning.
The goal at the time was to solve my Excel problem. I wanted to work with data larger than 50MB. That’s it. It wasn’t to learn machine learning or data science. I don’t think those terms even existed back then.
I started with Python. It was a good language, but for me something was a bit off. I was using Jupyter notebooks to develop report-ish files that contained text and code. However, it felt like coding and not exploring.
A coworker that was fresh out of engineering school recommended I check out R. I began investigating, and although quirky I found the R programming language oddly satisfying. It was more statistical in nature, which lent itself well to exploring data, finding insights, and enabling me to critically think about the analysis. Plus it was free!
After about a week of using R, I was hooked (aka obsessed). I was using it at work. I was using it on the weekends. I was basically using it all the time.
Obsessed with R. A new fragrance by Business Science.
Quite naturally, I logged in a lot of hours with R very quickly. I probably had my 10,000 hours in within a couple years.
How did I master R?
- I used R for everything. Scraping data from the web, reading SQL queries at work, building Shiny web application dashboards to analyze trends and forecast sales, creating competitive analysis PDF reports pulling in stock and alternative data, performing investment calculations to reduce correlation, volatility, while maximizing return.
- MOOCs became very popular. I downloaded a bunch of Udemy courses and eventually took the John’s Hopkins Coursera Data Science Specialization.
- I strategically googled every problem I ran into. I found StackOverflow very useful for specific problems. I found blog tutorials very useful for concepts and techniques.
- I began blogging. R had awesome tools for finance (my hobby) and business (my profession), both of which I enjoy. Naturally, I began writing about my experiences and teaching others how to do what I was doing.
Creating An R Package
In 2016, I was in the process of completing the Coursera Johns Hopkins Data Science Specialization. It took several months to complete all 10 courses, and I was in the capstone project when I got a crazy idea, one that almost made me stop the capstone mid-project (My Sales Dashboard project, the culmination of my $450 investment and 10 months of work).
What caused me to consider stopping?
I’d been blogging on my personal website (www.mattdancho.com, now www.business-science.io). I had just wrote an article called “Quantitative Stock Analysis Tutorial: Screening The Returns For Every S&P500 Stock In Less Than 5 Minutes”. During this time the “tidyverse” had become very popular as a set of tools for following a manageable workflow for data science (see R For Data Science if you are interested in learning the tidyverse).
However, the financial ecosystem within R had not experienced the same infiltration of “tidy”-esque packages.
Further, in writing the S&P 500 Analysis article, I was constantly converting back and forth between data frame and xts (two different data structures in R each with benefits that I will not go into).
A light bulb went off in my head!
What if I put together a set of functions to do all of these financial calculations without ever leaving the tidyverse? That would save me and everyone else a ton of coding time.
Over the next month I began coding what became known as tidyquant, an R package that enables financial analysis of the xts system to be performed entirely with data frames in the “tidyverse”.
I released tidyquant to CRAN (CRAN is like the Apple App Store for R packages) on December 31, 2016.
Watching the recorded sessions from the RStudio Conference from my hotel room of a work trip 3 weeks later (RStudio is the major company in the R data science space, and their conference is where a lot early adopters go to learn about the latest cutting edge R work), I saw a presentation by Hadley Wickham (the most famous data scientist in R, he built the early version of the tidyverse).
Hadley was fielding some questions at the end of his Keynote speech that kicked off the RStudio conference.
Someone asked about time series in the tidyverse, and Hadley responded saying he just heard of a new package called “tidy… finance… maybe…” (check out minute 45 of his talk). Then someone in the crowd screamed out TIDYQUANT!!! Hadley proceeded to pull up the CRAN homepage for tidyquant in front of everyone at the conference. This was awesome and a massively important step towards becoming a company!
Business Science Was Born
The tidyquant package picked up steam. It was open source (meaning free for everyone) so people began using it, testing it, and word spread.
Within 2 months I personally began getting requests for data science projects. These were mainly early adopters of tidyquant that had odd jobs that a person of my skillset could help them with.
In February of 2017, I formed Business Science.
Forming a business was something I’ve always wanted to do, but at this point it was more a strategic way to manage liability. At any rate, it was cool. I was working hard at my 9-5, but now I could actually make some money on the side doing what I enjoyed: R Programming!
Business Science initially started out serving clients as a consulting firm. We’d help them create Shiny web apps and other time series and financial coding jobs that we were uniquely qualified to handle.
In September of 2017, we received a big opportunity when a Fortune 500 company signed us up to do a quick turn data science job. We had just released our article “HR Analytics: Using Machine Learning To Predict Employee Turnover” that went viral. We received a job to quickly collect and report predictive insights on a Workday database (Cloud-based software for HR data). The client was to present to executive management the following week and wanted to show predictive insights from their data.
The job with my first Fortune 500 Client did not go well
We received the data on Friday, and were to present findings on Monday so the executives could integrate into a presentation for Wednesday of the following week. I contracted an HR Specialist out of Houston. He and I worked non-stop from Friday through to Monday analyzing their data, extracting insights, and creating a detailed report that documented our entire analysis. We actually created a pretty cool algorithm that detected 13 or so employees that were not currently being targeted for the “executive track” but should have been based on their data.
But this report and algorithm was not what was wanted. Our contacts were expecting something different than what we interpreted from the conversations (still I do not know what they wanted). What we delivered was overly technical, not in a format they could easily integrate into their presentation, and - bottom line - not what they wanted.
Ugh! I felt horrible.
Signing up for this job was not smart but an excellent learning experience that paved the way for data science education.
I learned that if Business Science was going to be successful, we needed a plan.
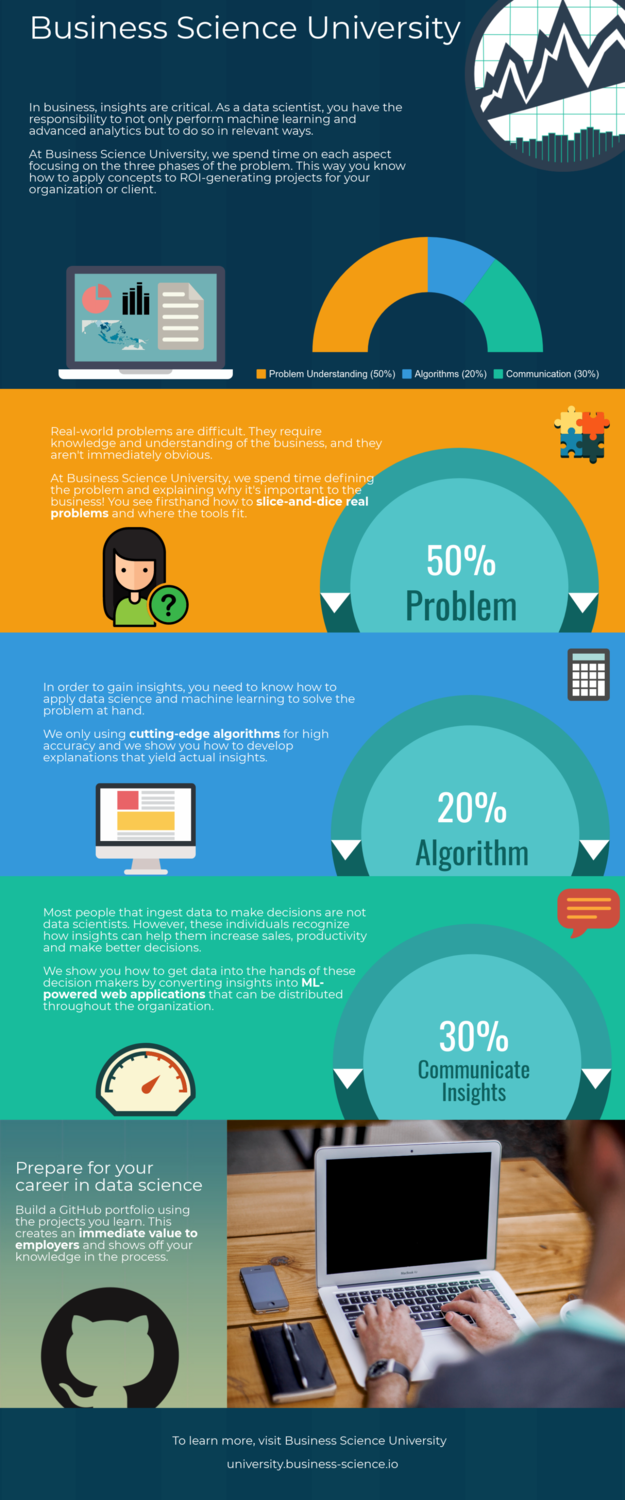
The Business Science Problem Framework
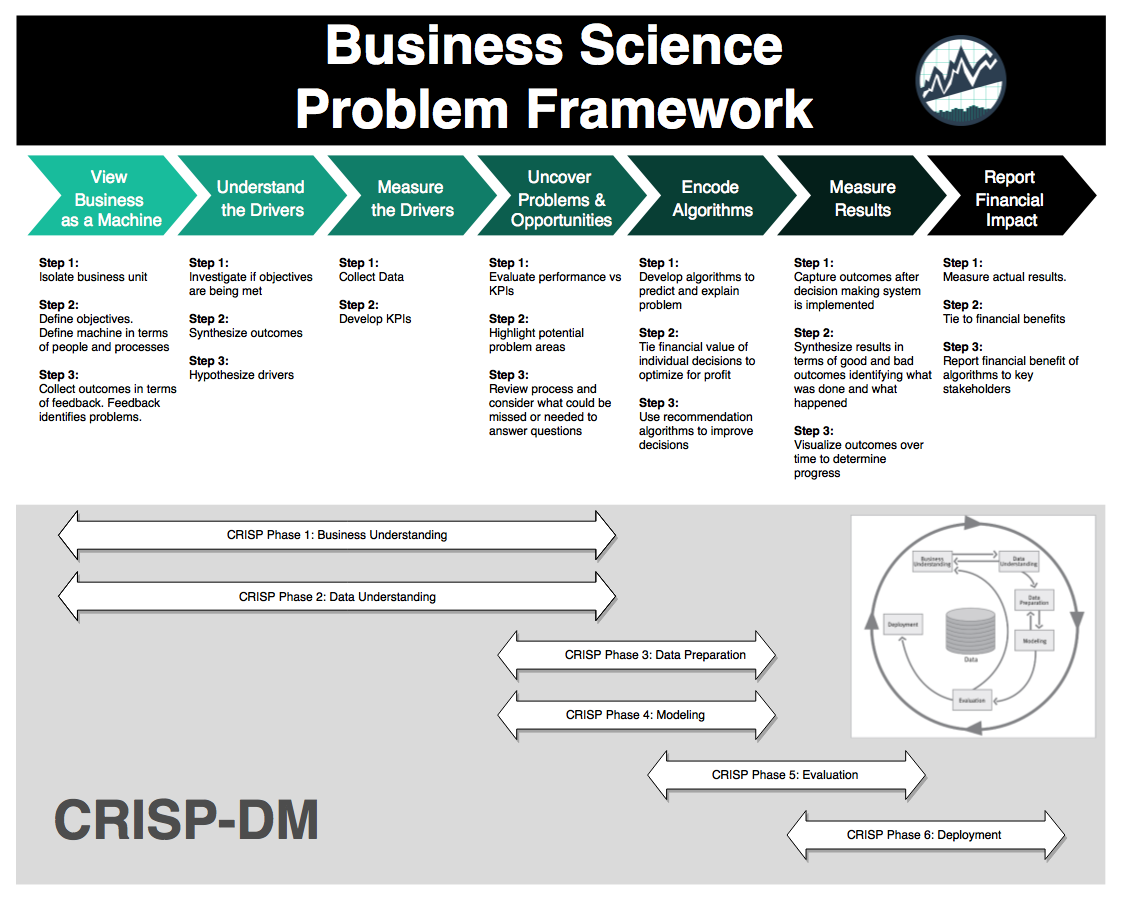
The Business Science Problem Framework (or BSPF for short) was a systematic process that I developed after reading the book Principles by Ray Dalio. It incorporated many of Ray’s concepts for business improvement, and I was able to integrate it with another popular, high-level framework called CRISP-DM that I’d been experimenting with.
The BSPF was successful for a few key reasons:
- It provided a clear plan that I could discuss with executives and align their interests with a return-on-investment (ROI) oriented framework.
- It exposed the key steps in a data science project in a way that exec’s understood
- It showed that it takes several weeks if not months to do a data science project right
- It helped bring client questions up front in early discussion, which we were able to answer and build into the project scope
- It gave the clients a sense of confidence that we knew what we were doing (and we did!)
We began using the BSPF framework on every job. We saw client satisfaction skyrocket.
Pivoting Into Education
Client jobs were going well, but my real passion was helping data scientists become serious assets to their organizations. As we were working with clients, we’d routinely see how they just hired a bunch of data scientists and cut them loose to solve all of their data problems.
The problem with this data science shotgun approach was it wasn’t working. The data scientists were well versed in the tools and techniques, but there was a gap between the business goals and the data science team’s direction.
To tackle this new problem (aka bridging the gap), we developed a plan for an educational workshop.
In January 2017, I formed a small team of data scientists that I knew we could combine efforts to build an integrated program. The goal was to teach the aspiring data scientists being hired in droves to understand the needs of the enterprise and to learn how to apply our systematic framework plus our methods plus advanced tools within a business context.
Enter Business Science University
Business Science University was established as a way to take beginner-to-intermediate data scientists to an advanced level quickly within a business context. We focused on results first (hence everything we teach is in the pursuit of ROI). We utilized cutting-edge tools like H2O, Keras, and xgboost. Most importantly, we taught how to size a data science problem financially and how to link the predictive models to expected savings or profitability.
We launched in April of 2018.
The program was well received by the data scientists. In the first month we had about 100 data scientists enroll in our first course: Data Science For Business With R (DS4B 201-R).
Over the first few months I met with many of the students to understand why they signed up.
They joined for a variety of reasons.
- Some were data scientists that wanted to further their knowledge of how to apply data science in business.
- Some just loved our software and our blog.
- Some were consultants at companies like Accenture, Deloitte, and smaller firms seeking an edge that they can use with their clients.
- Some were students seeking to learn skills not offered in their current data science programs.
- All had one thing in common - the desire to learn.
Measuring Success
Measuring the success of a new product is difficult. Some people look at sales numbers. Others want to see monthly active users. People often look at measures of growth and trend improvement.
I don’t focus on any of these. Not for a new product at least.
The single metric I care about is the first question on the Student Survey at the conclusion of Chapter 2 of the Data Science For Business With R Course:
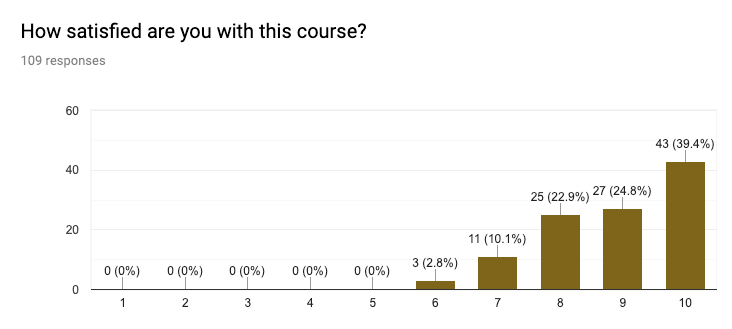
“How Satisfied Are You With This Course?”
This question is important to me because it is the culmination of the students thoughts and feelings after about 2-3 weeks of taking the 10-week course. It’s a measure of quality, of student-perceived effectiveness, and their judgement on whether or not their likely to stick with it. All rolled into one.
At the moment we are averaging 8.9 / 10.0. This is very good, and with room for improvement.
How Did I Know I Was Ready For Full Time Business Science?
On Friday, August 3rd, 2018, I decided to go full time. It was a difficult decision, one that my wife and I had to seriously weigh.
On the one hand, I have a successful career with a job in which I get to apply data science to sales data every day and I have a part-time job building a successful business that positively impacts data scientists.
On the other hand, if I went full-time Business Science, I could focus and create many more educational products (blogs, courses, workshops) and really expand our reach while positively impacting many more data scientists.
The decision for me was based on how much impact I could have.
Growing the Business
A lot has changed in the year since starting Business Science University.
-
We have since grown to 2000+ students that are taking courses in R and Python. We’ve learned a ton through the process by specifically focusing on student transformations (how to transform a student from no-prior experience to high proficiency as fast as possible). This focus has helped us change the game for students that have previously struggled learning data science for business.
-
We now have a full 5-Course R-Track Program that is streamlined, integrated, and has resulted in many amazing accomplishments for my students (Don’t believe me, check out the testimonials.)
-
I have rekindled my relationship with Python. In fact, I’ve been studying python extensively beginning in late 2020. Why? Because of the strengths that each language has and they can now work together. Read about the strengths of R and Python here and why R is for Research, Python is for Production here.
-
I’ve even launched my first Python Course: Python for Data Science Automation. It’s helped many R users learn Python and beginners alike.
-
And there’s now a Continuous Education Program called Learning Labs PRO for Data Scientists to go beyond the tools learned in the courses.
And we have a lot more coming!
The most important safety net you can have is having a strong community of support behind you. I’ve been very fortunate along my path to meet many data scientists and make lasting relationships. Without these people, I wouldn’t be where I am or who I am.
I’d like to shout out to a few friends that have helped me along this journey:
-
Jonathan Regenstein - Jonathan is the Director of Financial Services Practice at RStudio. He’s a super friend. Jonathan and I speak regularly and work together to provide machine learning workshops in the financial space. I’ve been lucky to have met him. He’s a great guy, always lending a helping hand.
-
Beau Walker - I took his marketing course about a year ago. He’s the one that introduced me to the power of LinkedIn and how you can connect with an entire community in a positive way. Since then we’ve remained close friends, even partnering our two companies.
-
Kristen Kehrer - Kristen is the founder of Data Moves Me, and is a data science consultant. We share the same values about helping data scientists grow. Kristen has even become a student of Business Science University, and she has an amazing story of how she completed a Shiny App 3-days after beginning the 102 course!
-
Favio Vazquez - Favio and I have been enjoying each others blog content for a while, and we recently made the decision to work together on building courses for Business Science University. He’s so talented knowing Python, Spark, and R, along with a host of other data science tools.
-
Kelly O’Briant - Kelly and I have been working together since inception of Business Science University. She is lead developer for the Shiny App Course coming soon. She’s a brilliant software engineer / data scientist that knows how to make a great looking and performing Shiny app.
-
Davis Vaughan - Davis helped immensely with R package development efforts. He was the lead for the tibbletime package, and helped grow functionality in tidyquant. He was one of the earliest adopters of tidyquant, and he brought some great ideas along with new R packages.
-
Eric Webber - I was recently introduced to Eric. Eric and I share the same excitement about helping data scientists grow. It’s an exciting time, and that’s what you feel when you speak with Eric.
-
Kate Strachnyi - I just recently got an opportunity to chat with Kate. She’s a mother of 2 and still kicking butt building an awesome career in data science. I’m looking forward to our Humans Of Data Science episode that we are set to record soon.
-
Kirill Eremenko - I’ve been fortunate to be on Kirill’s podcast twice. I’ve also taken Hadelin and his courses on Udemy. He’s a class act.
-
Mike Delgado - Mike is the director of Social Media at Experian and most know Mike from his DataTalk video series. He’s one of the friendliest people I know. And it comes out in each of his DataTalks.
Parting Thoughts
Often we don’t know the trajectory we are on. You may think you want to create a consultancy and wind up building an educational institution. It’s how you handle the journey that’s important.
-
Sometimes you are going to make mistakes. Make sure you learn from them. If I never crashed and burned with a major client, I wouldn’t have created the Business Science Problem Framework.
-
Sometimes you will need exposure. One of the best ways you can get your name out there is to contribute to a worthwhile cause. For me, I enjoy building software and writing blog articles. This is how I give back.
-
Sometimes you will need to change course. Consulting is a fine job, but if your passion is education, find a way to make it work.
-
Sometimes you will need help. Make friends, help each other, and use LinkedIn to your advantage.
Last, I hope you’ve learned from this article about how I did it (starting my data science business, that is). The story isn’t finished. It’s just beginning.
Follow Business Science if you’re interested in seeing where we go.
Thank you!
Matt Dancho
Founder of Business Science
Lead Instructor at Business Science University