Enhance Your Storytelling - Interactive Slide Decks with Rmarkdown
Written by Matt Dancho
This article is part of a R-Tips Weekly, a weekly video tutorial that shows you step-by-step how to do common R coding tasks.
Slide Decks are so important for storytelling in business. We can use Rmarkdown to tell our story with engaging interactivity thanks to the xaringan library. Here’s how to make PowerPoint-style Slide Presentations that are interactive straight from R.
Here are the links to get set up. 👇
 (Click image to play tutorial)
RMarkdown can make Interactive Presentations
Slide Decks are so important for storytelling in business. We can use Rmarkdown to tell our story with engaging interactivity thanks to the xaringan library. Here's how to make PowerPoint-style Slide Presentations that are interactive straight from R.
 Boost your story-telling with
 Rmarkdown & Xaringan
Get started with Xaringan Presentations
The easiest way is to take 10-minutes and watch the YouTube video. Here are quick parts that you'll especially enjoy.
- Rmarkdown Capabilities - Why Interactive Slides are Powerful
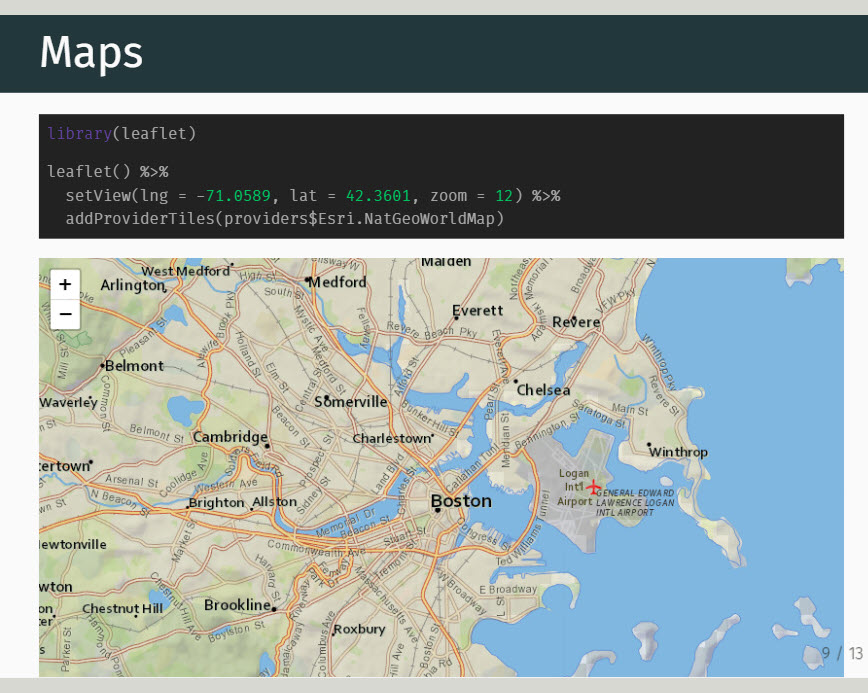
- Adding Interactive Maps -
Leaflet
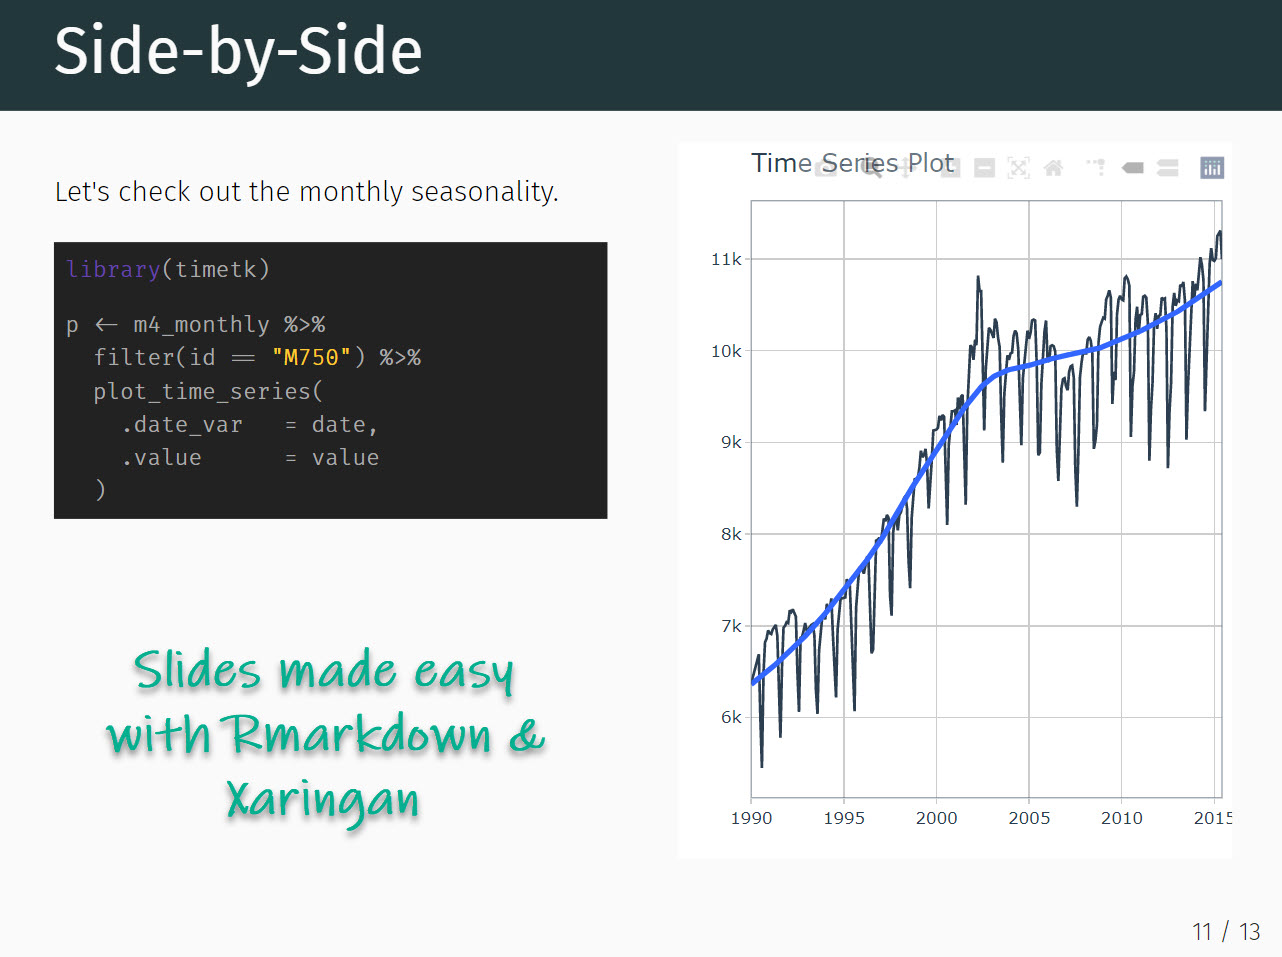
- Interactive Time Series -
Timetk
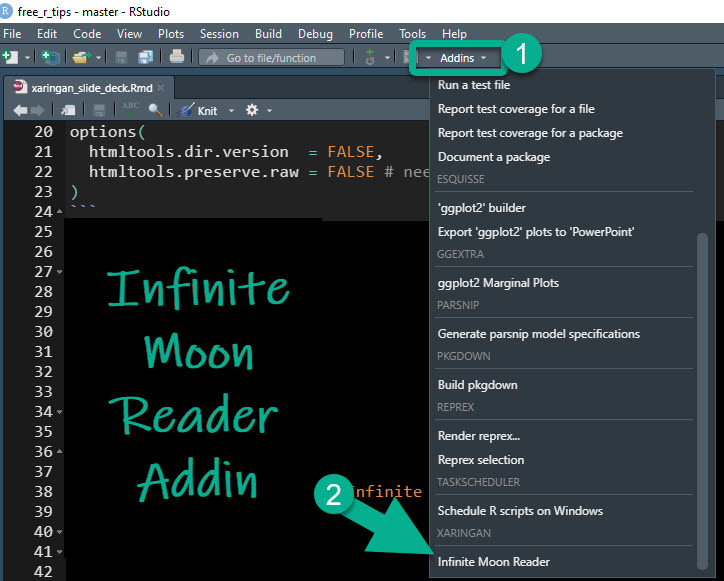
Tip - Infinite Moon Reader (Very Useful)
The most important part is to set up the Moon Reader (Code & Moon Reader Setup). This RStudio Addin helps you load presentation changes on the fly, which enhances your productivity when making edits by automatically updating the Xaringan slides.
Make Slides
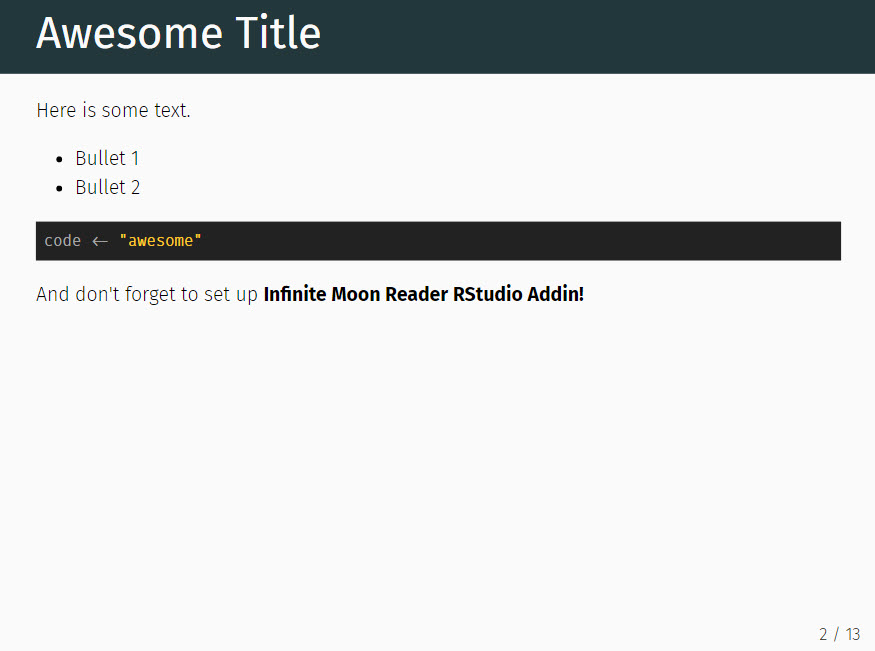
Slides are made with Rmarkdown code. By examining the code structure, we can see how markdown gets converted into a slide.
Here is the code:

...that produces this slide:
Add Interactive Plots and Maps
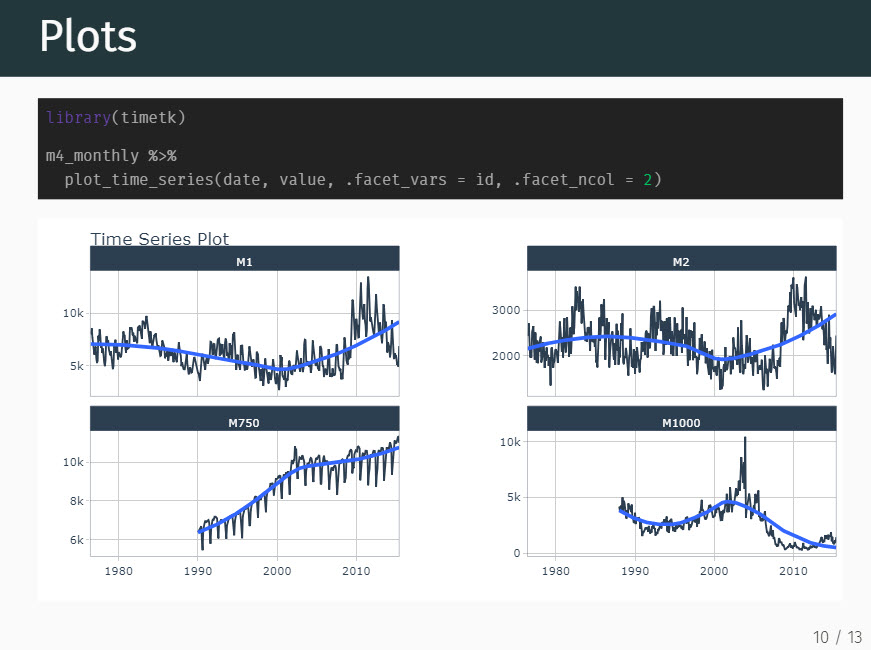
The best part of markdown is the ability to add interactivity to HTML documents. With Xaringan, we can add this interactivity to HTML Slide Decks. We can add:
- Interactive Maps
- Interactive Time Series Plots
- Interactive Data Tables
Learning Rmarkdown
To make powerful reports and slide-decks that tell your story, you'll need to learn rmarkdown. Here are a few learning tips.
Pro Tip 1 - Use the Cheat Sheet
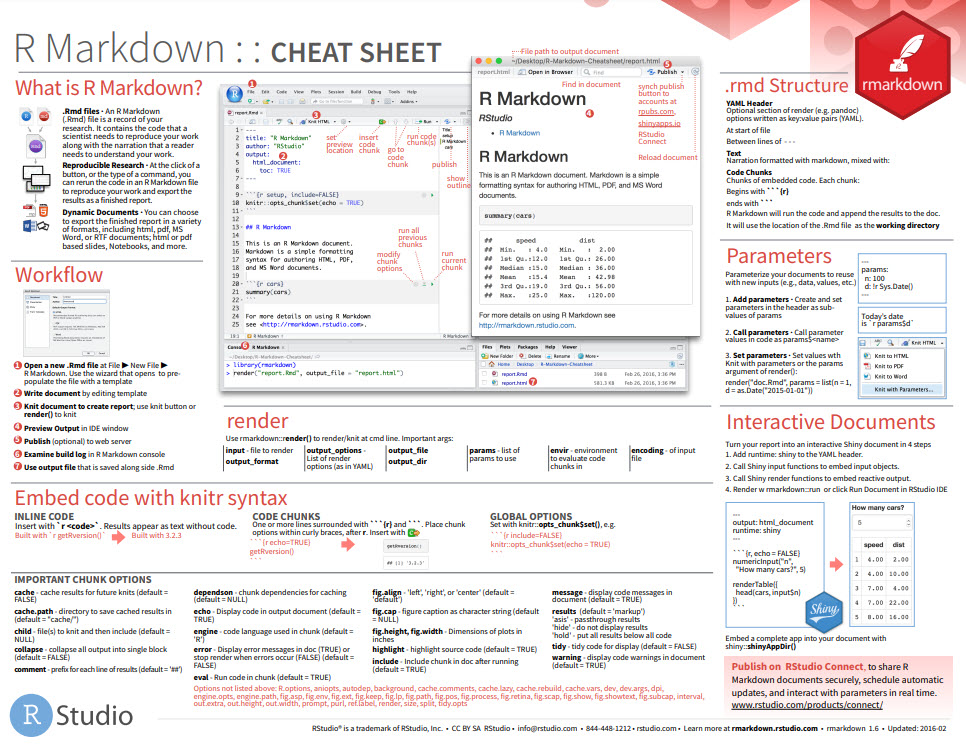
Making interactive PowerPoint-Style slide decks with Rmarkdown is super simple if you know Rmarkdown. Rmarkdown is an 80/20 tool shown on the first page of my Ultimate R Cheat Sheet. When you download the cheatsheet, you get access to the entire ecosystem of R packages.
Click the "CS" next to Rmarkdown.

Clicking the "CS" opens the Rmarkdown Cheat Sheet. Now you're ready to begin learning Rmarkdown.
PRO TIP 2 - Learn Rmarkdown in my Business Analysis with R Course
It might be difficult to learn Rmarkdown on your own. I have a course that walks you through the entire process from analysis to reporting.
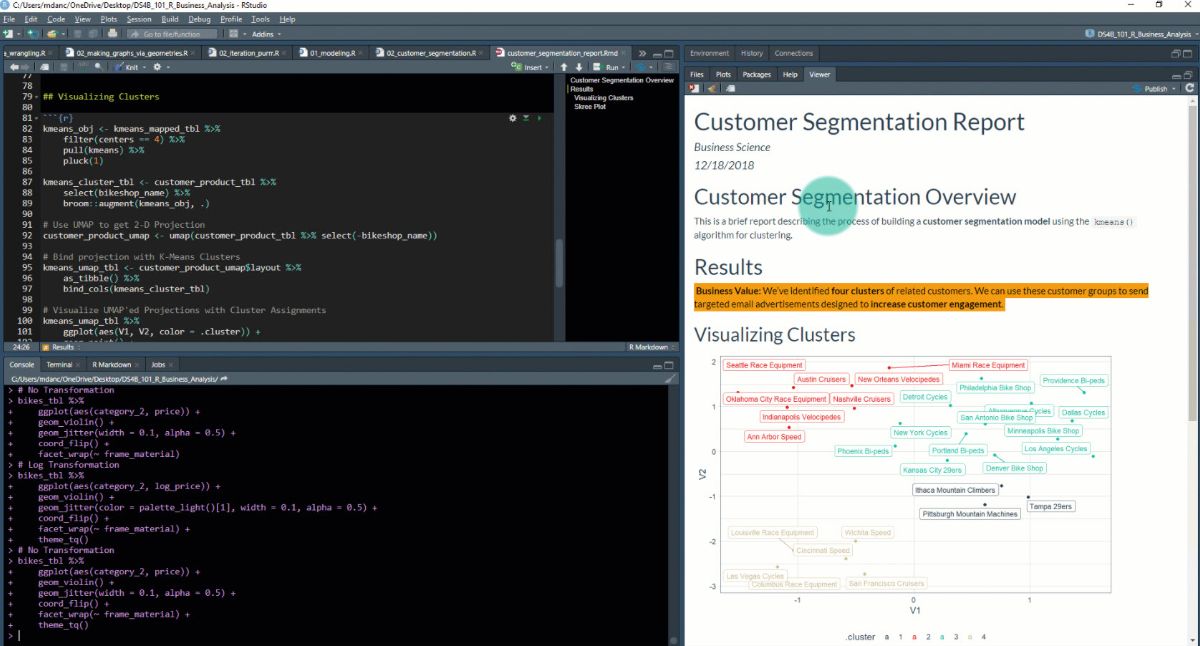
The R for Business Analysis 101 Course is the first course in my R-Track program. You'll make a two reports:
- Customer Segmentation Report
- Product Pricing Estimation and Gap Analysis
Here's the Customer Segmentation Report.
In Summary
You just built an amazing Interactive Slide Deck all thanks to `RMarkdown` and `Xaringan`!! Congratulations.