Forecasting Time Series ARIMA Models (10 Must-Know Tidyverse Functions #5)
Written by Matt Dancho

This article is part of a R-Tips Weekly, a weekly video tutorial that shows you step-by-step how to do common R coding tasks.
Making multiple ARIMA Time Series models in R used to be difficult. But, with the purrr nest() function and modeltime, forecasting has never been easier. Learn how to make many ARIMA models in this tutorial. Here are the links to get set up. 👇
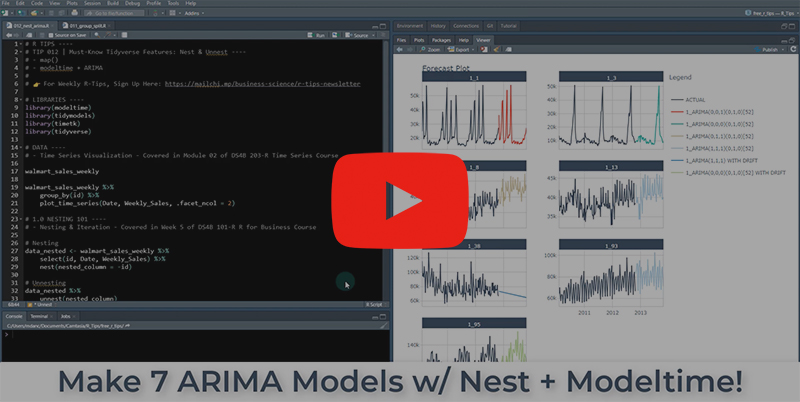 (Click image to play tutorial)
What is Nest?
Nesting is a data frame reshaping tool that produces a “nested” structure.
The nested structure is super powerful for modeling groups of data. We’ll see how.
Let’s check nest() out. With 3 lines of code, we turn an ordinary data frame into a nested data frame.
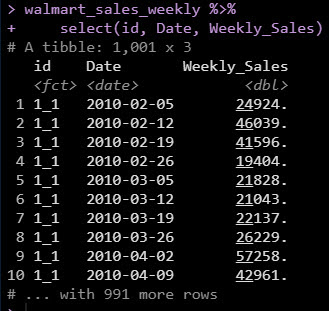
Before
Unnested time series data with many groups of time series.
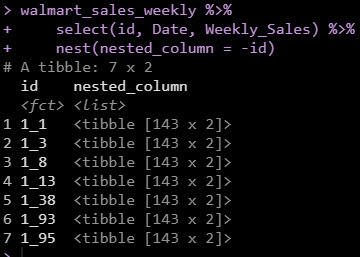
After
Nested Time Series Data that we can model!
ARIMA Modeling with Modeltime
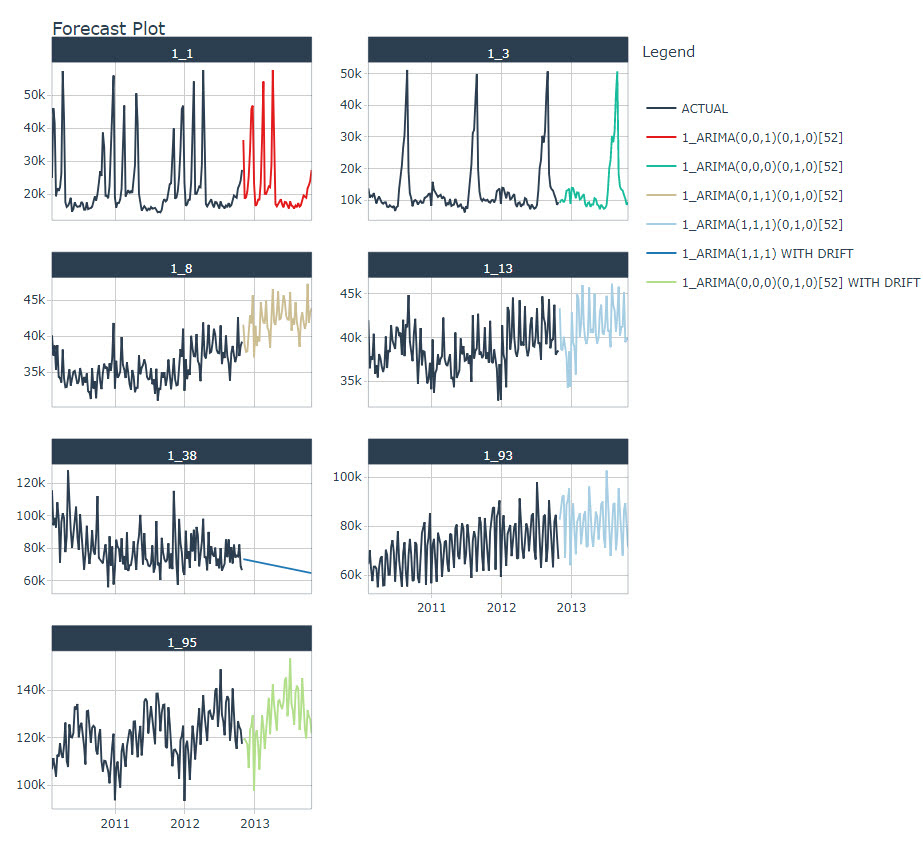
So what can we do with a “Nested” Data Frame? How about making 7 ARIMA Forecasts!
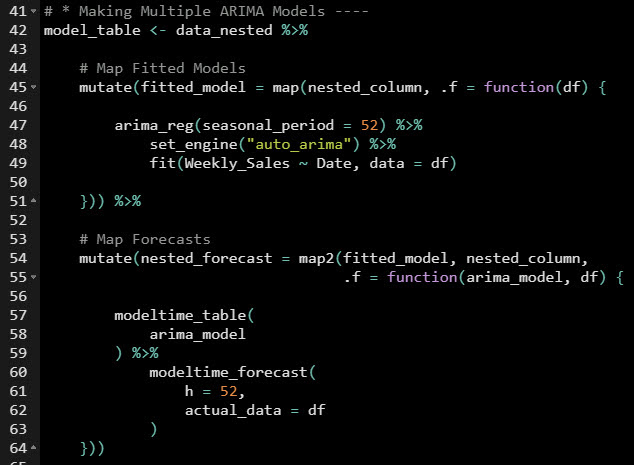
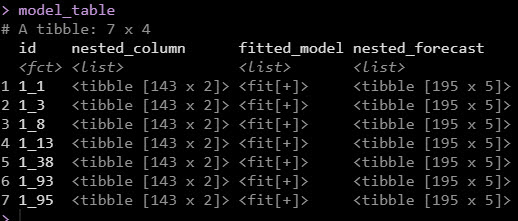
And with a little extra work (thanks to my Modeltime R Package), we can create this INTERACTIVE ARIMA FORECAST! 💥💥💥

The look on your coworker's face speaks volumes. 👇

But you don’t have the force yet!
Here’s how to master R programming and become powered by R. 👇

…Your executive management review after you’ve launched your your first Shiny App. 👇

This is career acceleration.
SETUP R-TIPS WEEKLY PROJECT
-
Get the Code
-
Check out the R-Tips Setup Video.
Once you take these actions, you’ll be set up to receive R-Tips with Code every week. =)