Detect Relationships With Linear Regression (10 Must-Know Tidyverse Functions #4)
Written by Matt Dancho
This article is part of a R-Tips Weekly, a weekly video tutorial that shows you step-by-step how to do common R coding tasks.
Group Split and Map are SECRET TOOLS in my data science arsenal. Combining them will help us scale up to 15 linear regression summaries to assess relationship strength & combine in a GT table. Here are the links to get set up 👇
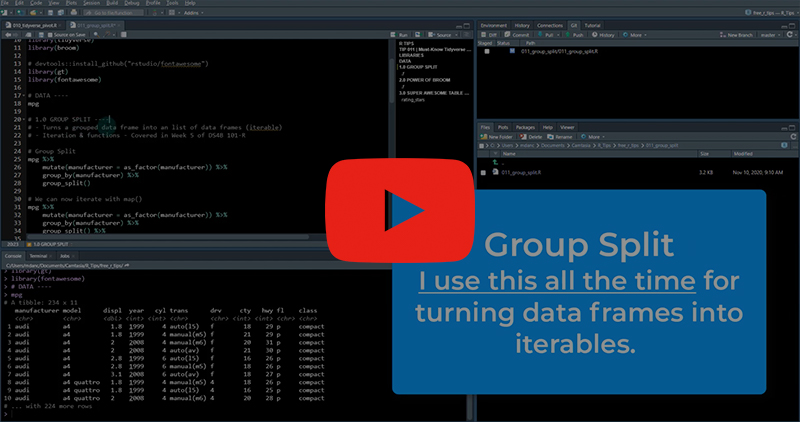 (Click image to play tutorial)
My secret weapon
Group split is SERIOUSLY POWERFUL.
In fact, I use group_split() almost every day. I use to convert data frames to iterable lists:
- Shiny Apps (making iterable cards)
- Modeling (Regression by Sub-Groups)
- Doing complex group-wise calculations - things you can’t do with group_by()
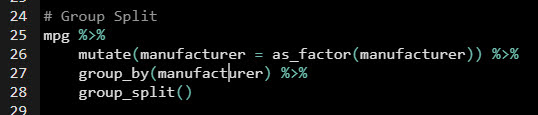
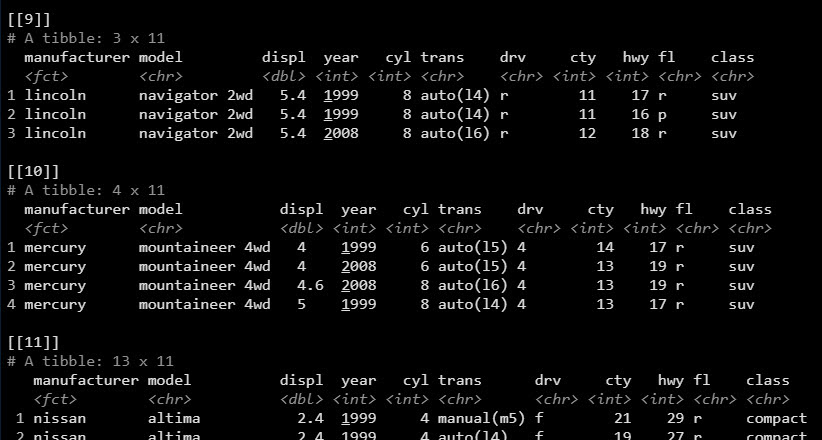
Let’s check group_split() out. With 3 lines of code, we turn an ordinary data frame into an iterable.
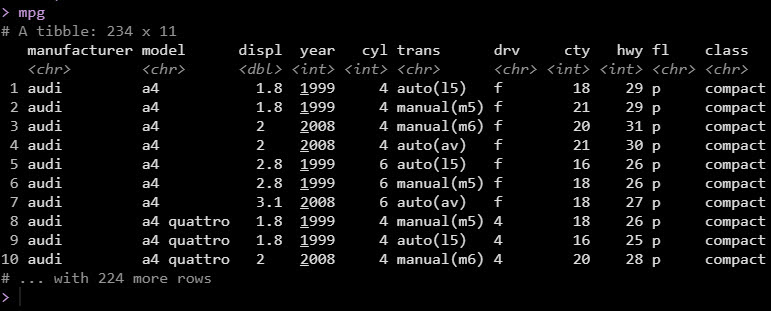
Before
Boring old data frame.
After
Now we have a list of data frames (i.e. an iterable)
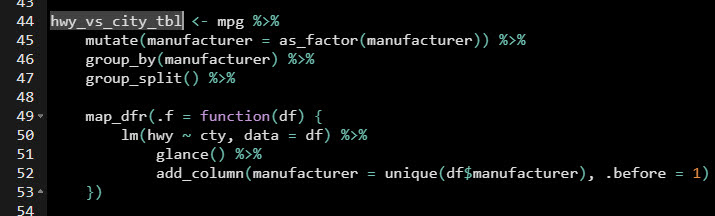
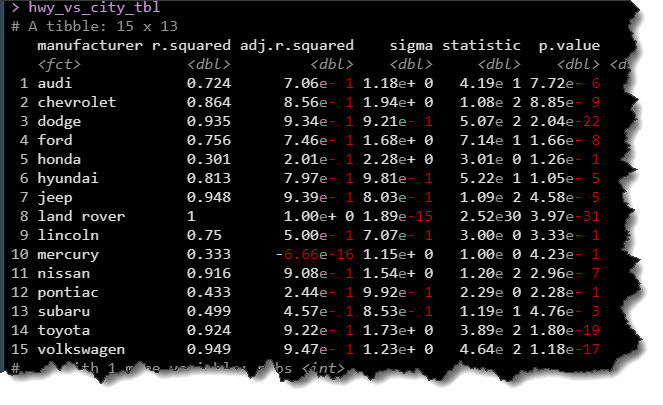
Modeling with Broom
So what can we do with this “iterable”?
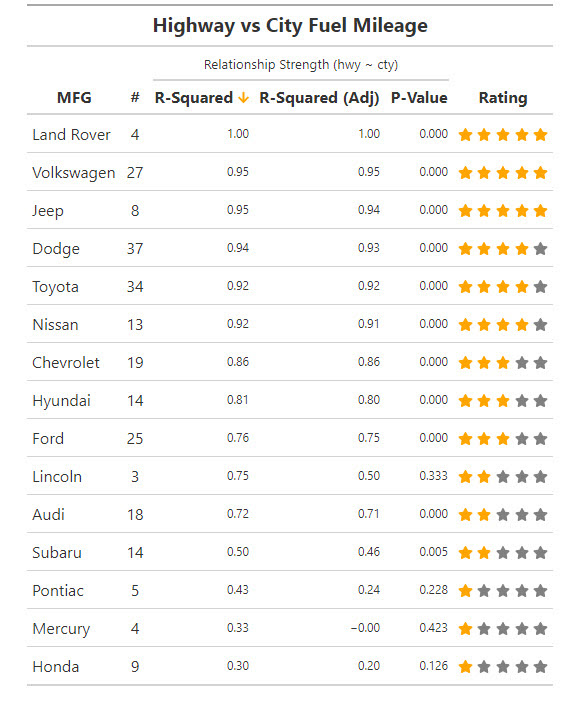
How about detect relationships with a Linear Regression Model using Broom’s Glance Function!
And with a little extra work (thanks to Thomas Mock @rstudio & the gt R package), we can create this INSANE TABLE! 💥💥💥
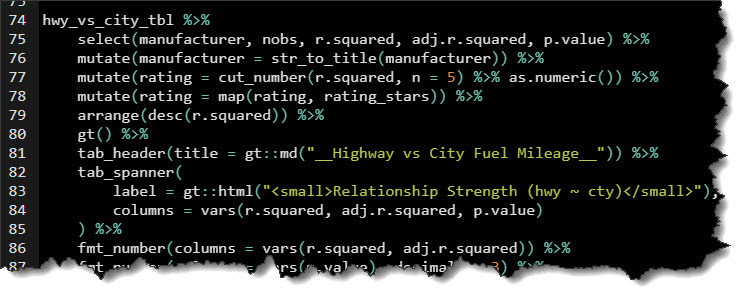
That was ridiculously easy.

But you’re NOT a Wizard yet!
Here’s how to master R programming & save the world Harry Potter Style. 👇

…And the look on your boss’ face after seeing your first Shiny App. 👇

This is career acceleration.
SETUP R-TIPS WEEKLY PROJECT
-
Get the Code
-
Check out the R-Tips Setup Video.
Once you take these actions, you’ll be set up to receive R-Tips with Code every week. =)