10 Must-Know Tidyverse Functions: #3 - Pivot Wider and Longer
Written by Matt Dancho

This article is part of a R-Tips Weekly, a weekly video tutorial that shows you step-by-step how to do common R coding tasks.
Learn how to use pivot_wider() and pivot_longer() to format data like a data wizard:
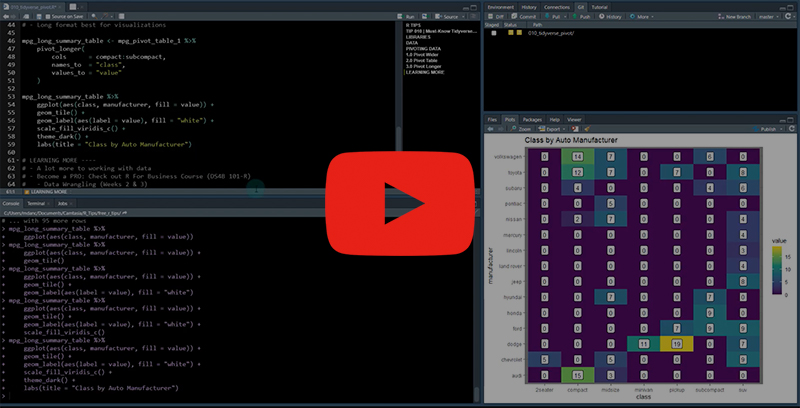 (Click image to play tutorial)
Why Pivot Wider?
Pivoting wider is essential for making summary tables that go into reports & help humans (like you and me) understand key information.
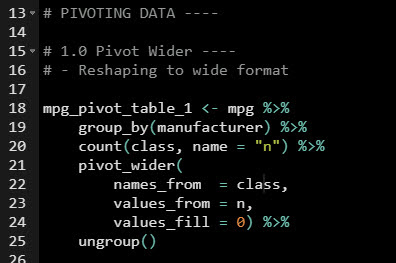
Let’s say we have some automobile manufacturer data that we want to format into a table that people can read.
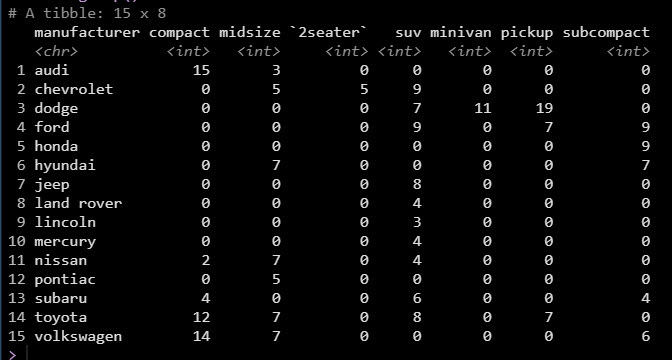
We can summarize and pivot the data by manufacturer and class to understand the number of vehicle classes that each manufacturer produces.
The result is a table that I can glean for insights.
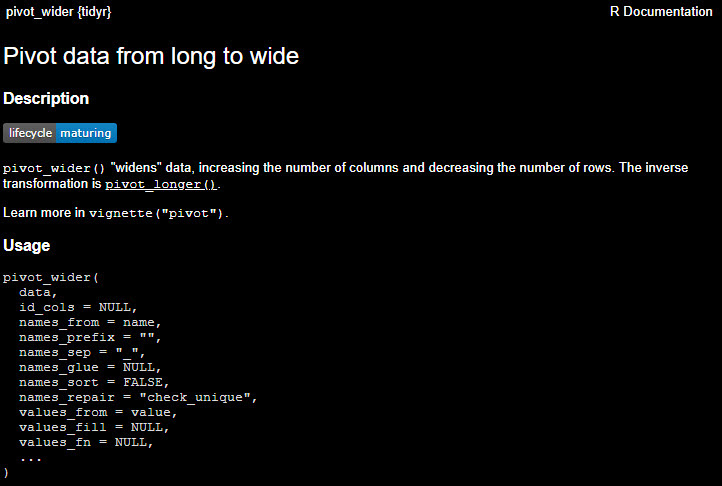
Why Pivot Longer?
Pivot longer lengthens data, increasing the number of rows and decreasing the number of columns.
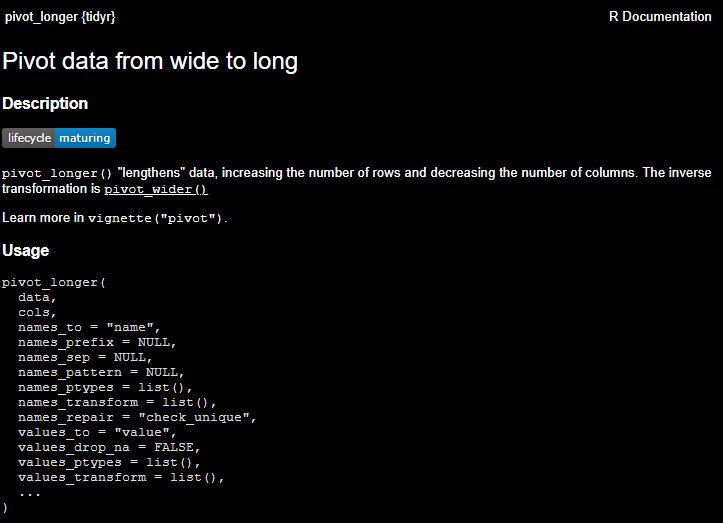
We can convert from wide to long with Pivot Longer, which gets it into the correct format to visualize with GGPLOT HEATMAP. 💥💥💥
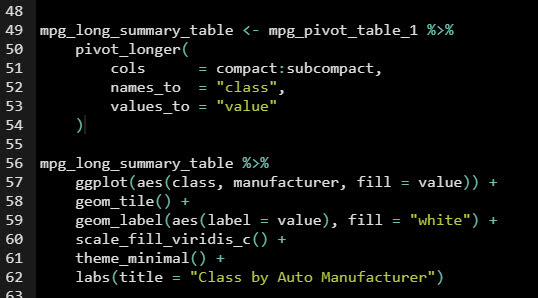
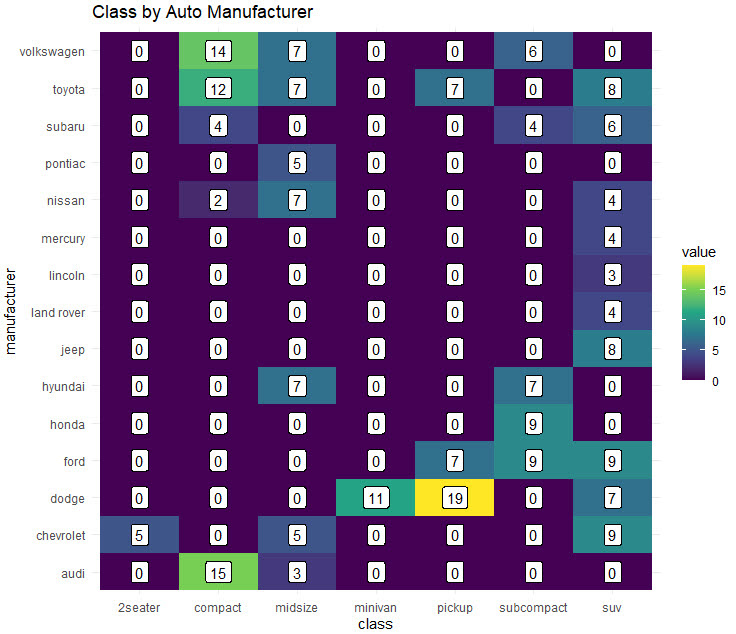
That was ridiculously easy. Keep it up & you’ll become a tidyverse rockstar.

You Learned Something New!
Great! But, you need to learn a lot to become an R programming wizard.
What happens after you learn R for Business from Matt 👇

…And the look on your boss’ face after seeing your first Shiny App. 👇

This is career acceleration.
SETUP R-TIPS WEEKLY PROJECT
-
Get the Code
-
Check out the R-Tips Setup Video.
Once you take these actions, you’ll be set up to receive R-Tips with Code every week. =)