10 Must-Know Tidyverse Functions: #2 - across()
Written by Matt Dancho

This article is part of a R-Tips Weekly, a weekly video tutorial that shows you step-by-step how to do common R coding tasks.
The across() function was just released in dplyr 1.0.0. It’s a new tidyverse function that extends group_by and summarize for multiple column and function summaries.
Learn how to use across() to summarize data like a data wizard:
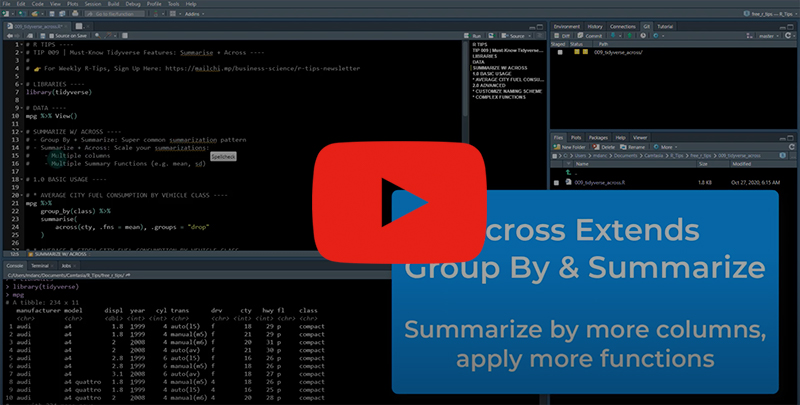 (Click image to play tutorial)
Why Across?
Across doesn’t do anything you can’t with normal group_by() and summarize(). So why across()? Simply put, across() allows you to scale up your summarization to multiple columns and multiple functions.
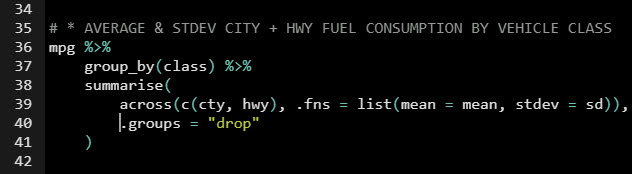
Across makes it easy to apply a mean and standard deviation to one or more columns. We just slect the columns and functions that we want to apply.
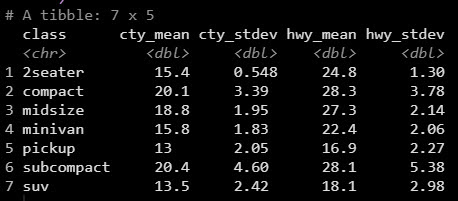
That was ridiculously easy. Keep it up & you’ll become a tidyverse rockstar.

You Learned Something New!
Great! But, you need to learn a lot to become an R programming wizard.
What happens after you learn R for Business from Matt 👇

…And the look on your boss’ face after seeing your first Shiny App. 👇

This is career acceleration.
SETUP R-TIPS WEEKLY PROJECT
-
Get the Code
-
Check out the R-Tips Setup Video.
Once you take these actions, you’ll be set up to receive R-Tips with Code every week. =)