10 Must-Know Tidyverse Functions: #1 - relocate()
Written by Matt Dancho

This article is part of a R-Tips Weekly, a weekly video tutorial that shows you step-by-step how to do common R coding tasks.
Let’s learn how relocate, a new function that speeds up column arrangements.
 (Click image to play tutorial)
Tidyverse relocate() Tutorial
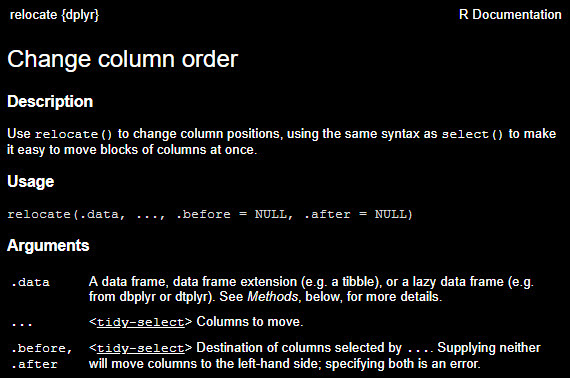
Today we are covering a new R function available in dplyr 1.0.0
Select vs Relocate
First, let’s compare the 2 column reordering functions: select() and relocate()
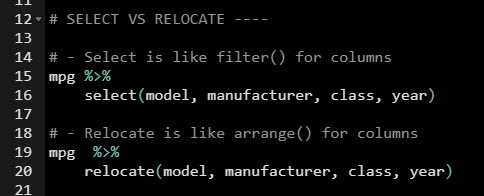
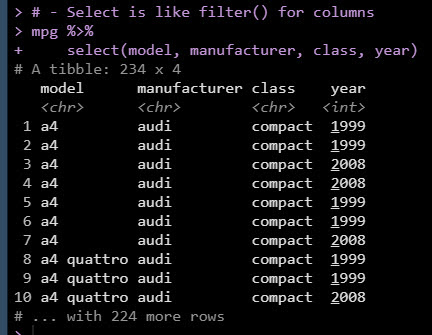
Select is like filter() but for columns. We just get the columns that we specify.
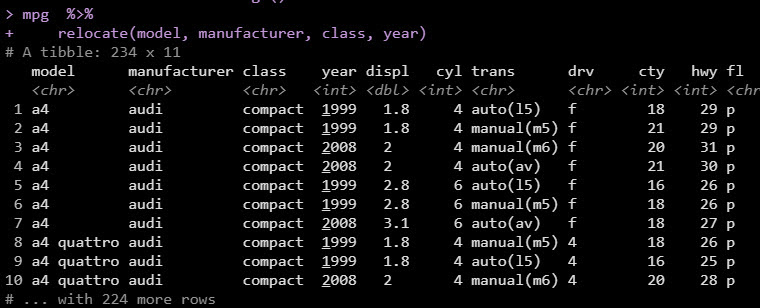
Relocate is like arrange() for columns. It keeps all of the columns, but provides much more flexibility for reordering. Notice how all of the columns are returned.
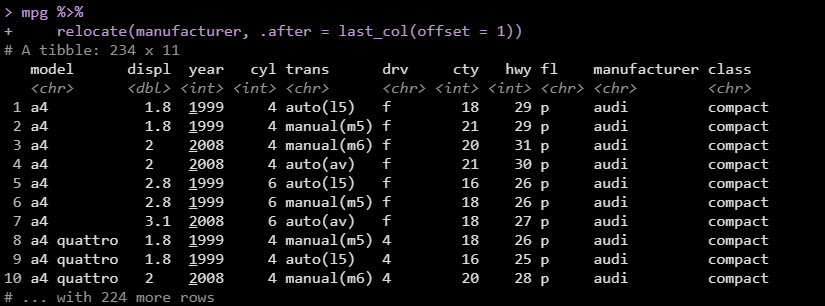
With relocate(), we can take advantage of special tidy-selectors including last_col() with an offset to provide very specific relocation patterns.
Congrats - You’ve just zapped that data.

You Learned Something New!
Great! But, you need to learn a TON to master the Blue Steel pose.
What happens after you learn R for Business from Matt 👇

…And the look on your boss’ face after seeing your first Shiny App. 👇

I call this, “career acceleration”.
SETUP R-TIPS WEEKLY PROJECT
-
Get the Code
-
Check out the R-Tips Setup Video.
Once you take these actions, you’ll be set up to receive R-Tips with Code every week. =)