Assess Your DATA QUALITY in R with skimr
Written by Matt Dancho
This article is part of a R-Tips Weekly, a weekly video tutorial that shows you step-by-step how to do common R coding tasks.
Skimr is my go-to R package for fast data quality assessment, and Skimr is my first step in exploratory data analysis. Before I do anything else, I check data quality with skimr.
Here are the links to get set up. 👇
 (Click image to play tutorial)
Use Skimr for Data Quality
Exploratory Data Analysis
The Data Quality Report from skimr
Rapid Data Quality Checks in R
Automatic Data Quality Reporting
Data Scientists spend 80% of their time understanding data, exploring it, wrangling and preparing for analysis.
This is way too long!
We can speed this up. One tool I use in EVERY SINGLE DATA PROJECT is called skimr. It's my go-to.
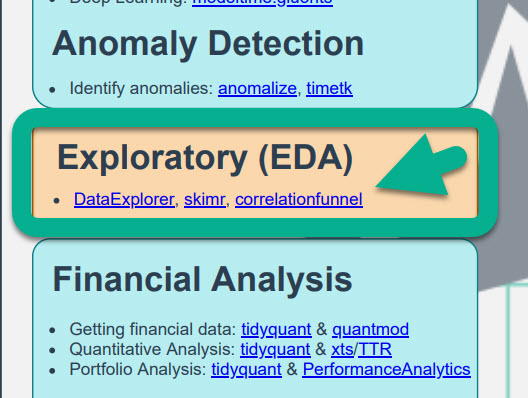
PRO TIP: I've added links to skimr and two more SUPER-IMPORTANT R PACKAGES FOR EDA on Page 3 of my Ultimate R Cheatsheet. 👇
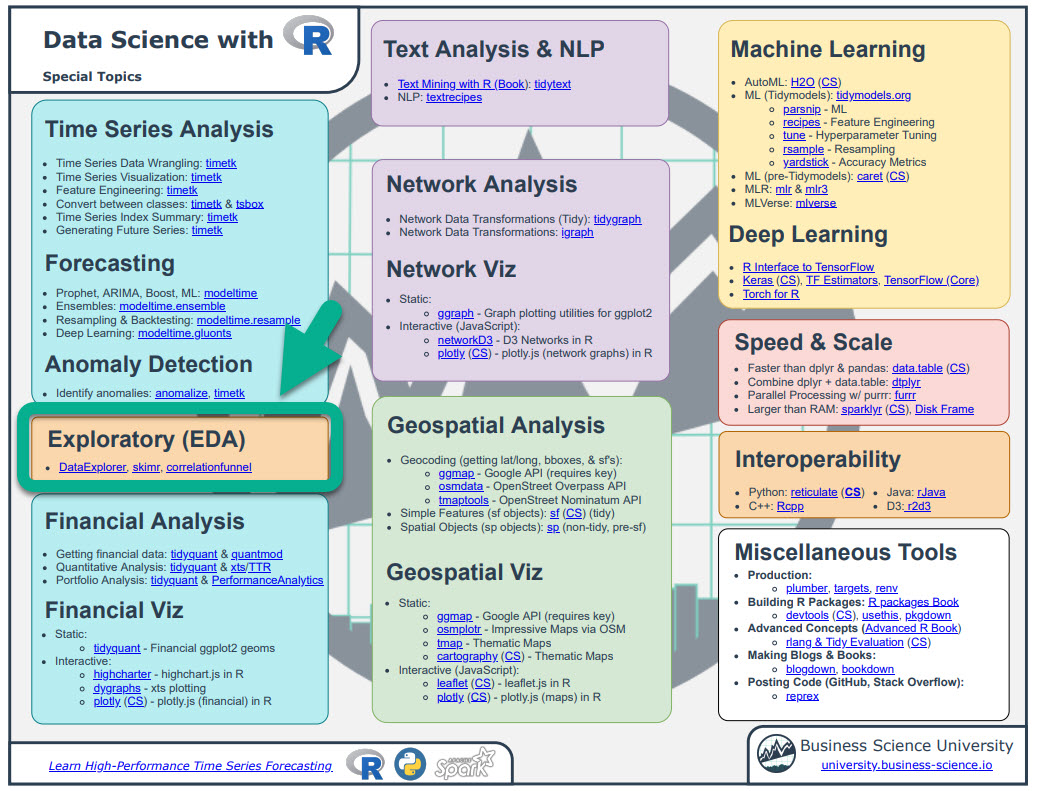
You can use my Ultimate R Cheatsheet to help you learn R. It consolidates the most important R packages (ones I use every day) into one cheatsheet. Here's where skimr is located.
How Skimr Works
Automatic Data Quality Reporting
One of the coolest features of Skimr is the ability to create a Data Quality Report in 1 line of code. This automates:
- Date Profiling
- Works with Numeric, Categorical, Text, Date, Nested List Columns, and even Dplyr Groups
Ultimately, this saves the Data Scientist SO MUCH TIME. ⌛
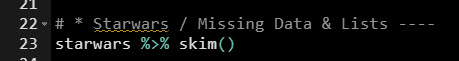
Missing Data, Categorical & Numeric Reporting (Starwars)
The "starwars" data set has a 87 starwars characters with various attributes. This is a messy data set containing a lot of missing values and nested list-columns.
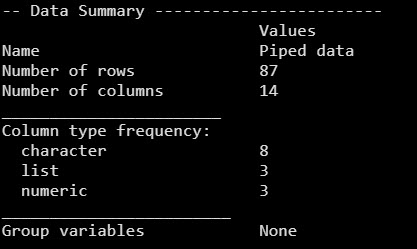
Overall Data Summary
Number of Rows/Columns, Data Types by Column, Group Variables.
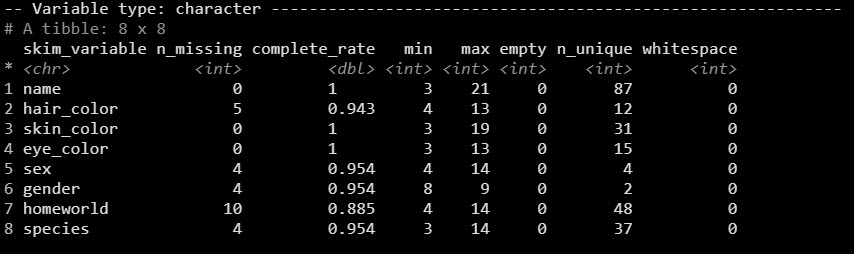
Character Summaries
Missing / completion rate, number of unique observations, and text features.
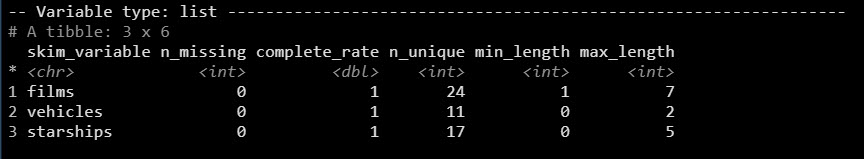
List Summaries (nested column)
Number of unique elements in each list.
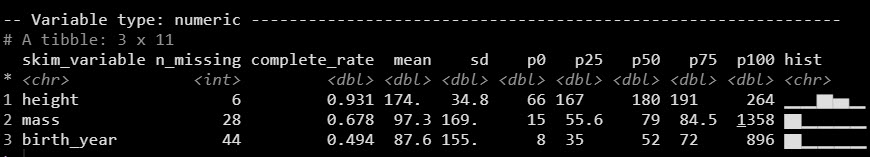
Numeric Summaries
Missing/completion rates and distributions.
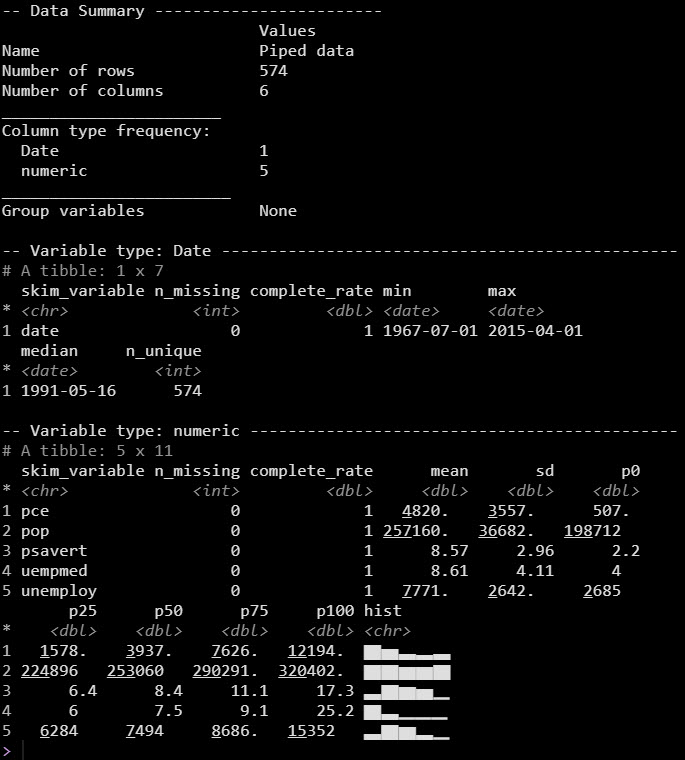
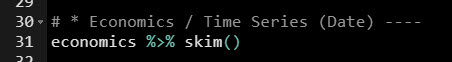
Time Series Reporting (Economics)
The "economics" data set has a date feature called "Date" and several numeric features. We'll focus on the date feature.
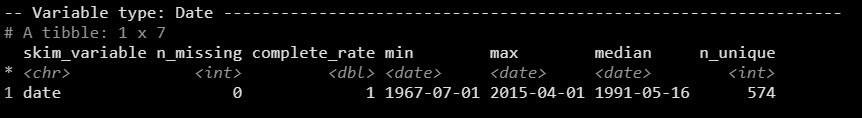
Date Summaries
Missing/completion rates, min/max dates, and the number of unique dates.
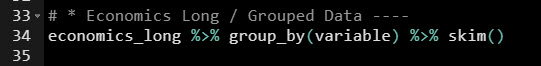
Grouped Time Series Reporting (Economics Long)
The "economics_long" data set has been pivoted so each time series from "economics" is stacked on top of each other - perfect for a groupwise skim analysis.
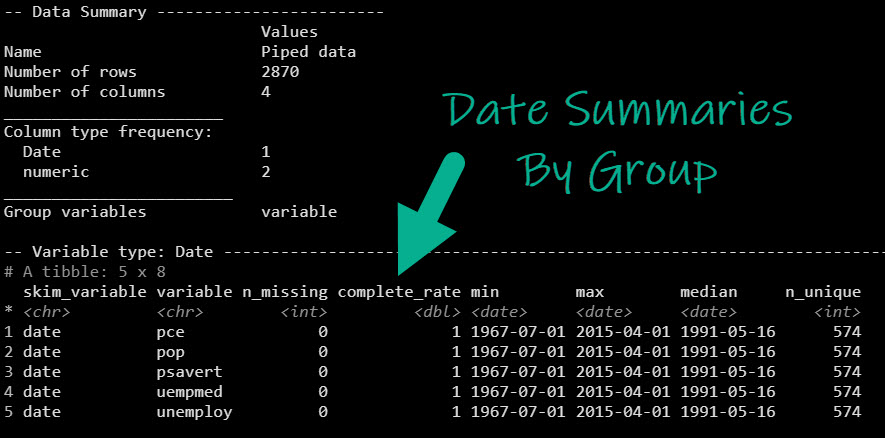
Grouped Date Summaries
Each of these are provided by group: Missing/completion rates, min/max dates, and the number of unique dates.
Assessing data quality with skimr is like:

Just skim your data.