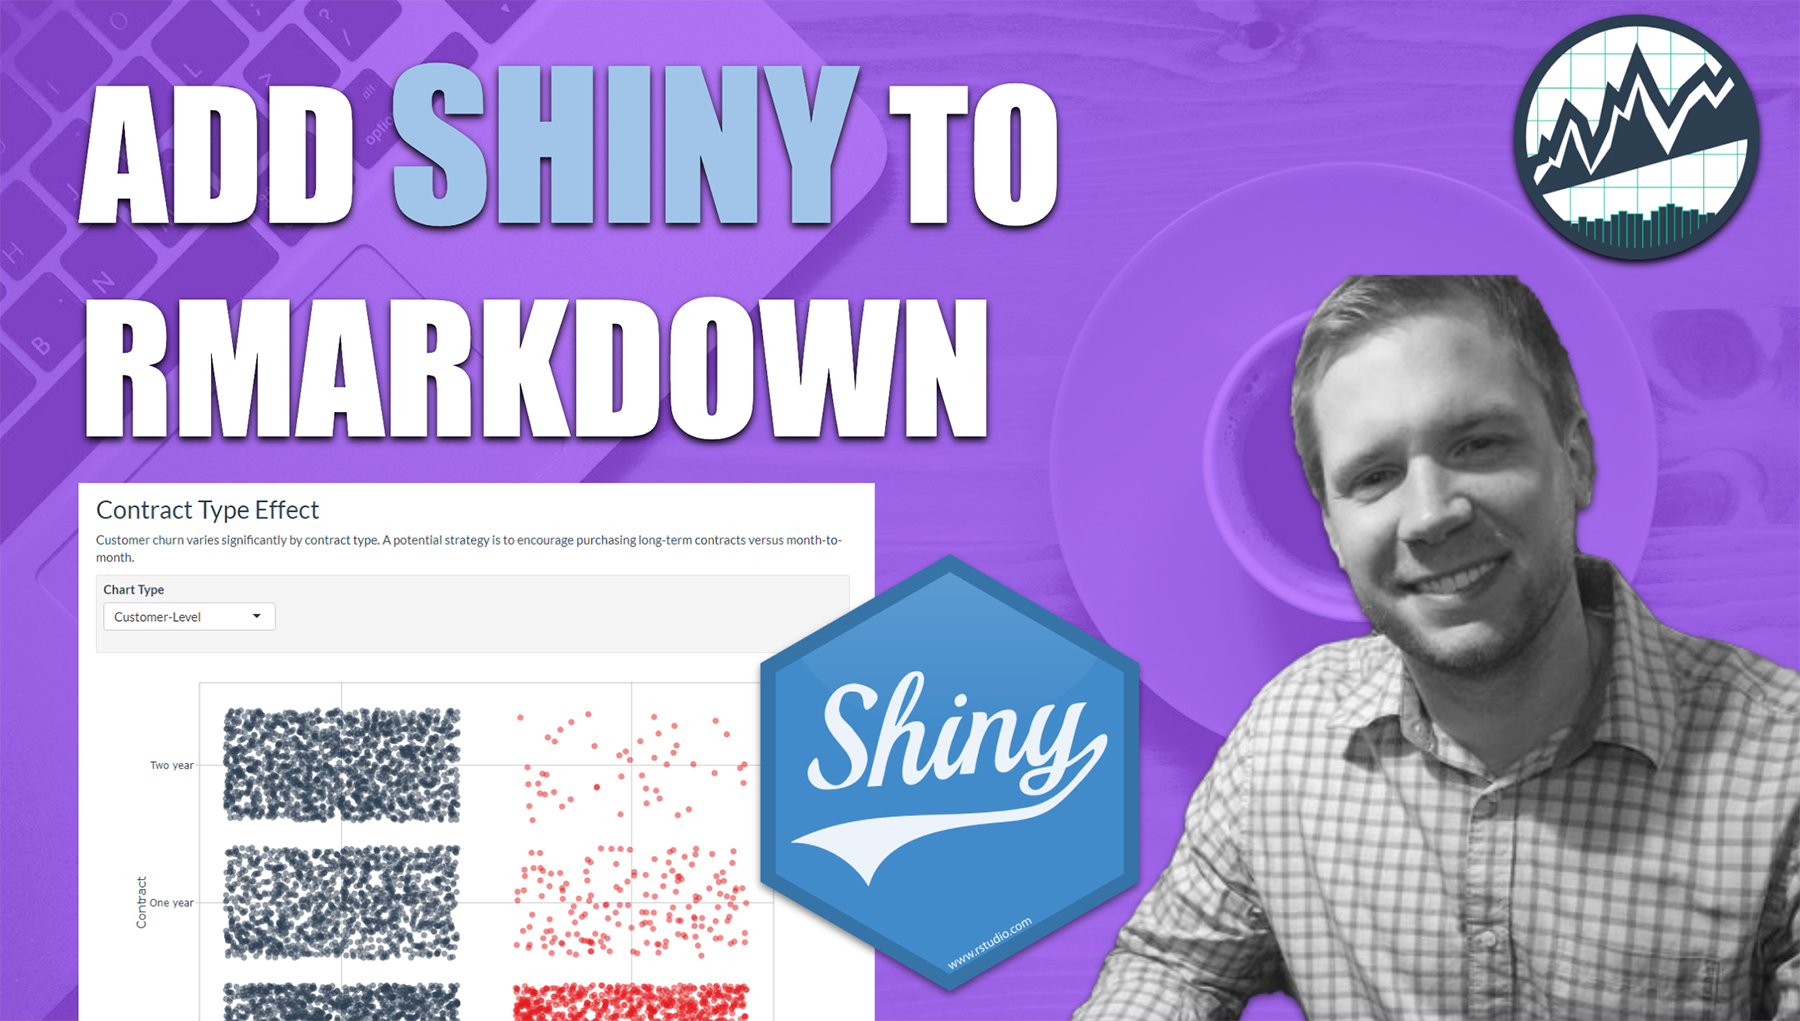
How to Add Shiny to Rmarkdown
Written by Matt Dancho
This article is part of a R-Tips Weekly, a weekly video tutorial that shows you step-by-step how to do common R coding tasks.
Here are the links to get set up. 👇
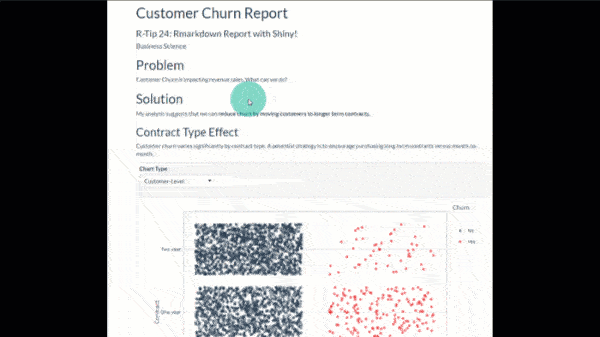
 (Click image to play tutorial)
Powering Rmarkdown Reports with Shiny
In this weekly R-Tip, we’re making a “Customer Churn Report” that uses both Rmarkdown (R Report Generator) and Shiny (Interactive Web Framework) to SPICE UP our business reports.
Rmarkdown
A great tool for business reporting. We can quickly convert our analysis to a business report by combining data, text, code, and visualizations.
Shiny
An R web framework with a HUGE ECOSYSTEM of interactive widgets, themes, and customizable user interfaces called the “Shinyverse”. We use Shiny to make our R Markdown Report interactive.
PRO TIP: I’ve streamlined the “Shinyverse” ecosystem on Page 2 of my Ultimate R Cheatsheet.
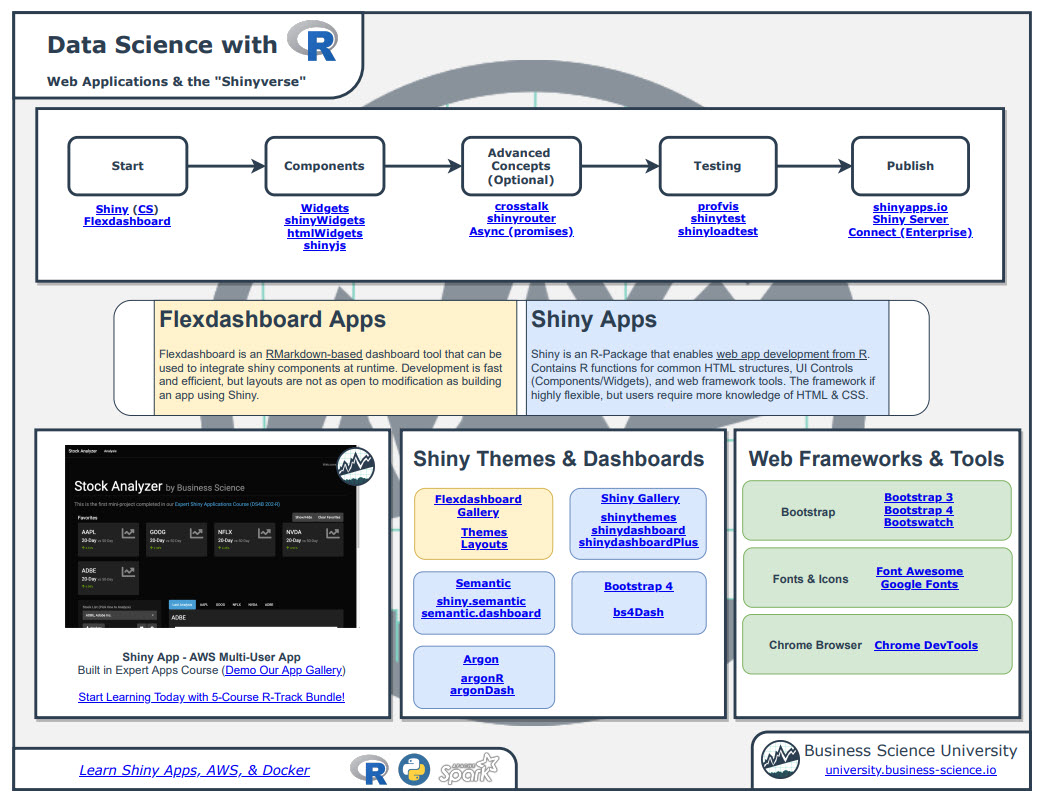
As you follow along, you can use my Ultimate R Cheatsheet. It consolidates the most important R packages (ones I use every day) into 1 cheatsheet.
How Shiny in Rmarkdown Works
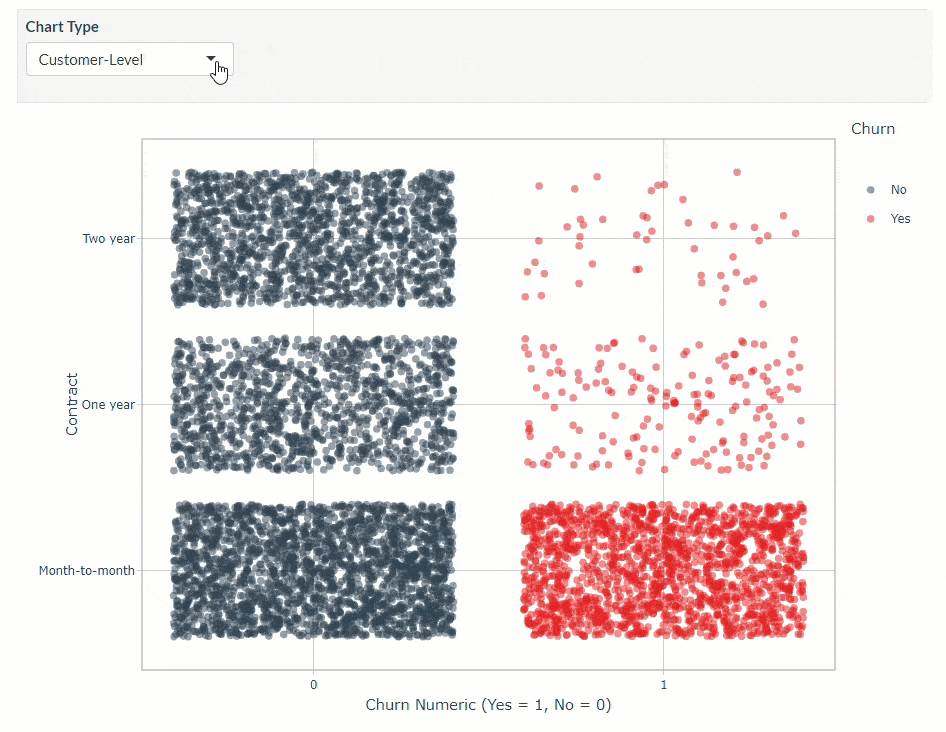
Combining Rmarkdown reports with Interactive Shiny Widgets
This is a shiny widget in an R-Markdown Report. Shiny uses a rendering engine (called shiny server) to power the widgets. This gives us advanced control over our analytics.
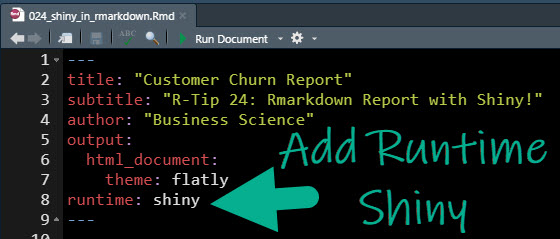
Adding Shiny to Rmarkdown
Make your reports buzz-worthy
Shiny can be added to Rmarkdown’s HTML report. We just simply need to add runtime: shiny to the Rmarkdown Header (YAML).
Get the Full GitHubCode
When we click “Run Document”, a shiny server will run the document instead of a static HTML page is generated. This has a BIG ADVANTAGE - We can use Shiny in our Report.
Using Shiny in Your Report
An interactive report that encourages engagement.
Using shiny requires a bit of reactive programming experience (I teach predictive shiny dashboards and expert shiny with AWS as part of my 5-Course R-Track Program).
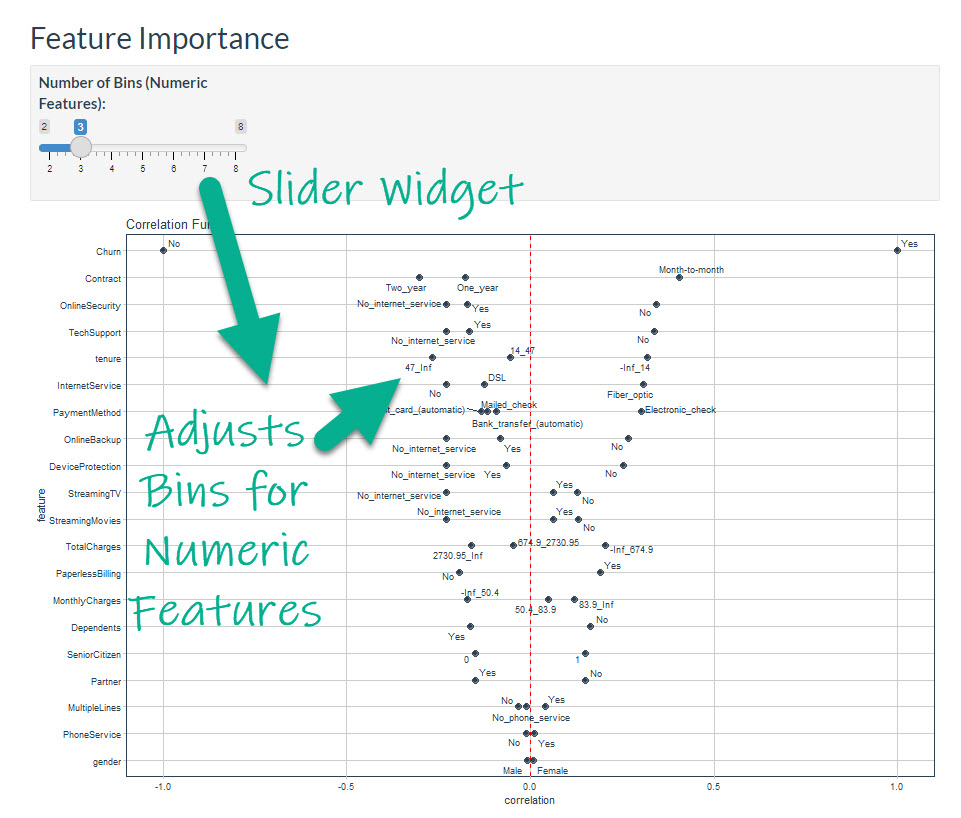
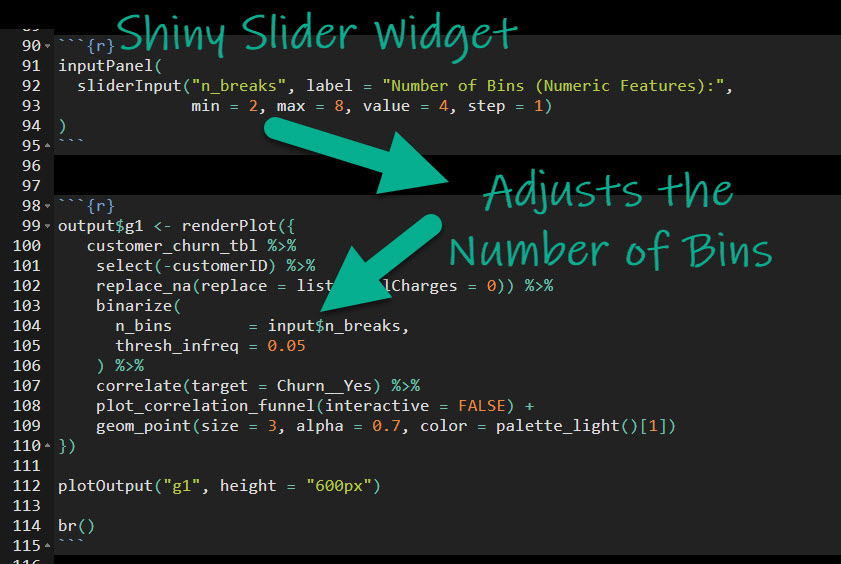
Here’s a snapshot of the code that powers this section of the report. We can see it’s a decorated version of ggplot code that connects the slider widget to the reactive plot.
Get the Full GitHub Code
Wow, you’re going to make an impression the next time you’re tasked with presenting a report.
But if you really want to improve your data skills...
What happens after you learn R for Business from Matt
The look on your Boss’ Face when they see your organization’s gains with production shiny apps.