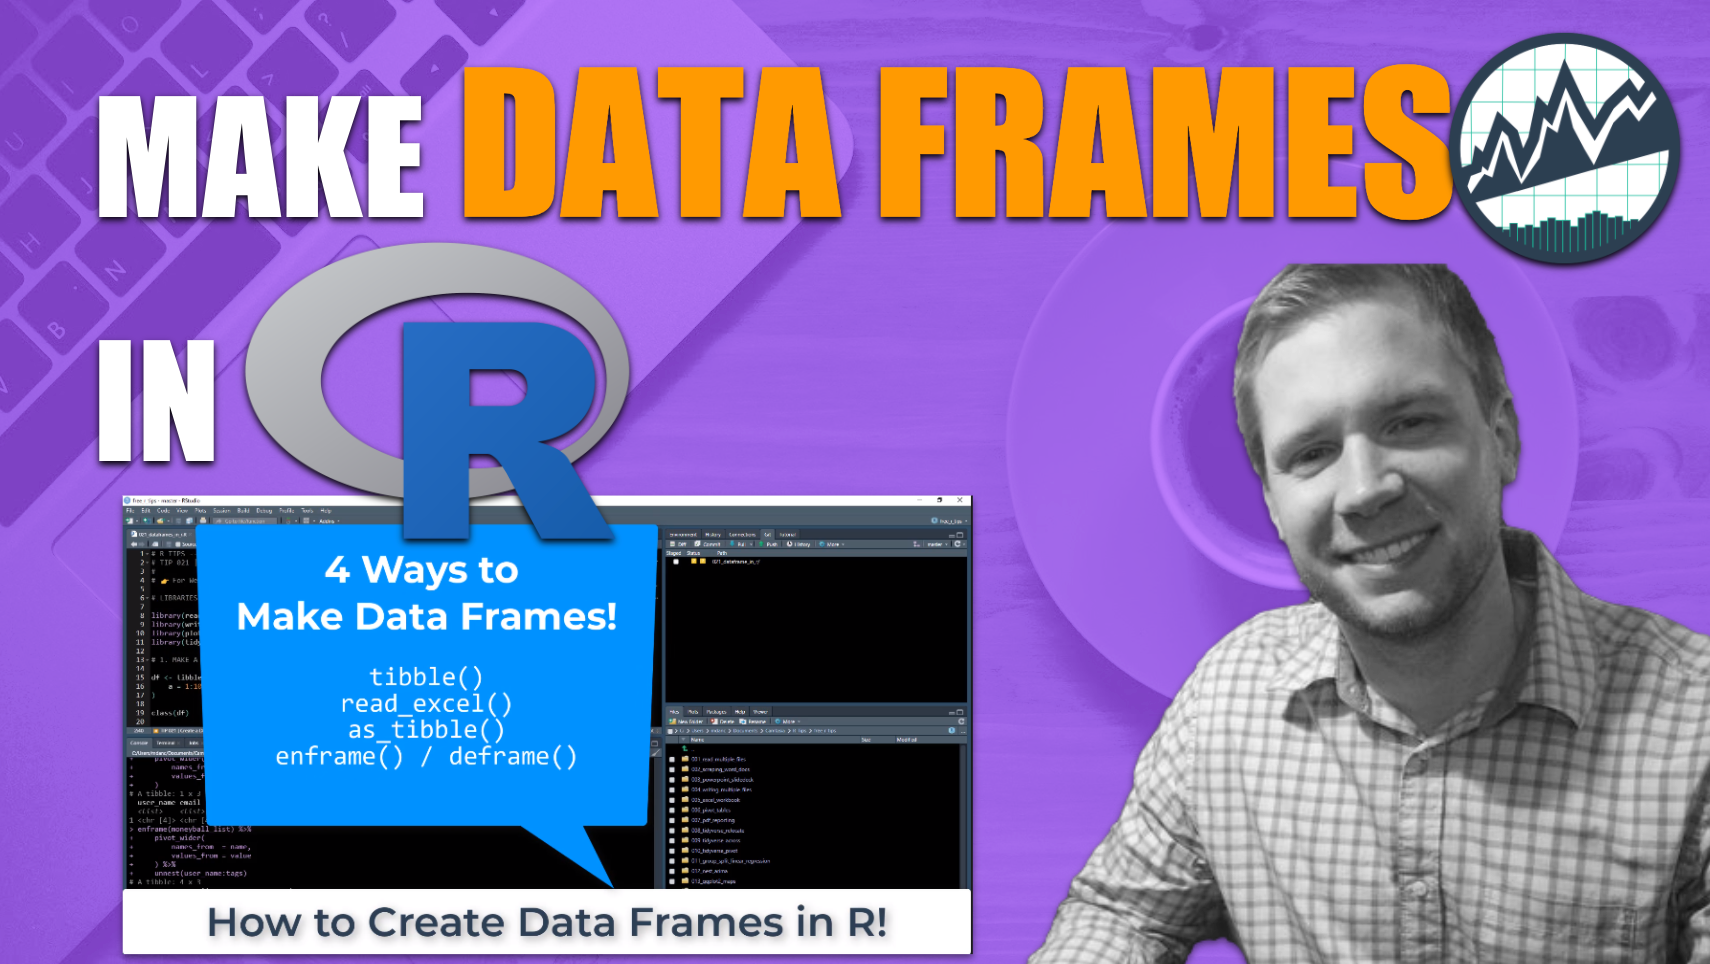
4 Ways to make Data Frames in R!
Written by Matt Dancho
This article is part of a R-Tips Weekly, a weekly video tutorial that shows you step-by-step how to do common R coding tasks.
Data frames (like Excel tables) are the main way for storing, organizing, and analyzing data in R. Here are 4 ways using the tidyverse: tibble, as_tibble(), read_excel(), and enframe()/deframe().
Here are the links to get set up. 👇
 (Click image to play tutorial)
Making Data Frames in R
Data frames are the most important data structure in R. They are just like Excel Tables. They keep your data organized.
We’re going to shed light on 4 SUPER POWERFUL ways to create data frames (from beginner to intermediate):
tibble() - For making simple data frames from scratchread_excel() - For importing data from Excel worksheets as data frames.as_tibble() - For converting lists and matrix objects to data framesenframe() - A SUPER-POWER. Convert ANYTHING to a data frame 🤯
As you go along, you can use my Ultimate R Cheatsheet for getting R importing & data wrangling down. It consolidates the most important R packages I use every day into one cheatsheet.
Method 1: Using tibble()
Make simple data frames from scratch.
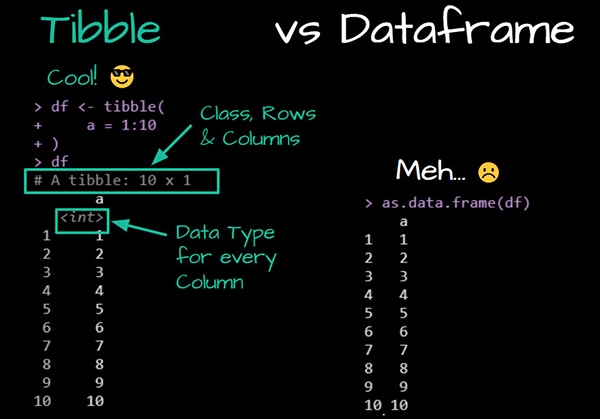
The tidyverse uses a structure called a “tibble”, which is simply a Data Frame (like an excel table) but with more informative printing than the default data frame.
We use the tibble() function to create a “tibble” from scratch. Here’s a simple tibble I created and compared to a basic R dataframe. The tibble printing is much more informative.
Method 2: Using read_excel()
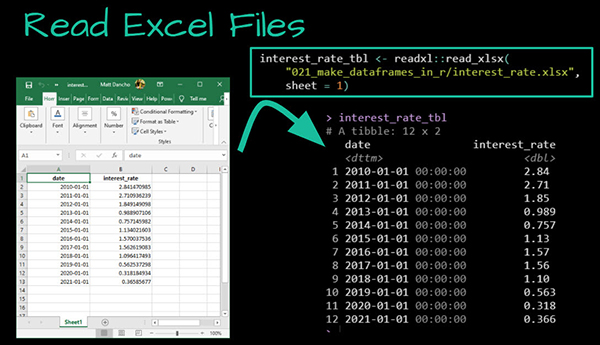
Use read_excel() to read excel worksheets.
Data importing is how we get data into R. There are a ton of ways to import data (check out my Ultimate R Cheatsheet for getting R importing down).
If we are working in Excel, we can import the data as a tibble using the readxl package’s read_excel() function.
Method 3: Using as_tibble()
For converting from other data structures
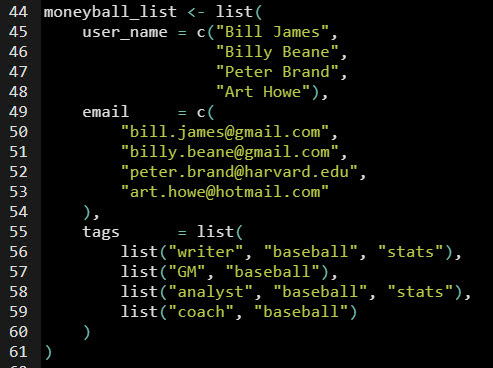
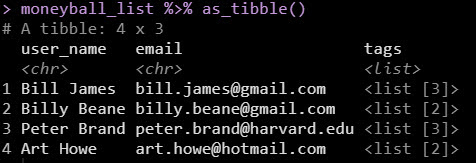
The next function, as_tibble(), helps convert from list or matrix data structures to tibbles. Here we have a pretty complex (nested) list.
Using as_tibble(), we just made it an organized data frame that’s ready for analysis!
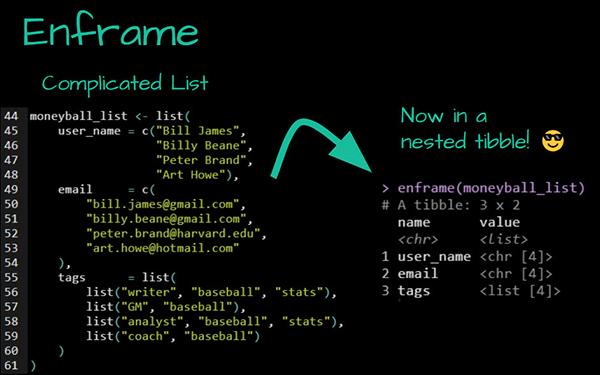
Method 4: Using enframe()
For converting ANYTHING to a data frame.
The last function, enframe(), is a MORE POWERFUL / FLEXIBLE version of as_tibble().
Why do we need enframe()?
When as_tibble() fails, enframe() is your Plan B.
You’re becoming a data ninja one R-tip at a time
But if you really want to improve your productivity…
Here's how to master R. 👇
What happens after you learn R for Business.

When your CEO gets word of your Shiny Apps saving the company tons of $$$ (cha-ching!). 👇

This is career acceleration.
SETUP R-TIPS WEEKLY PROJECT
-
Get the Code
-
Check out the R-Tips Setup Video.
Once you take these actions, you’ll be set up to receive R-Tips with Code every week. =)