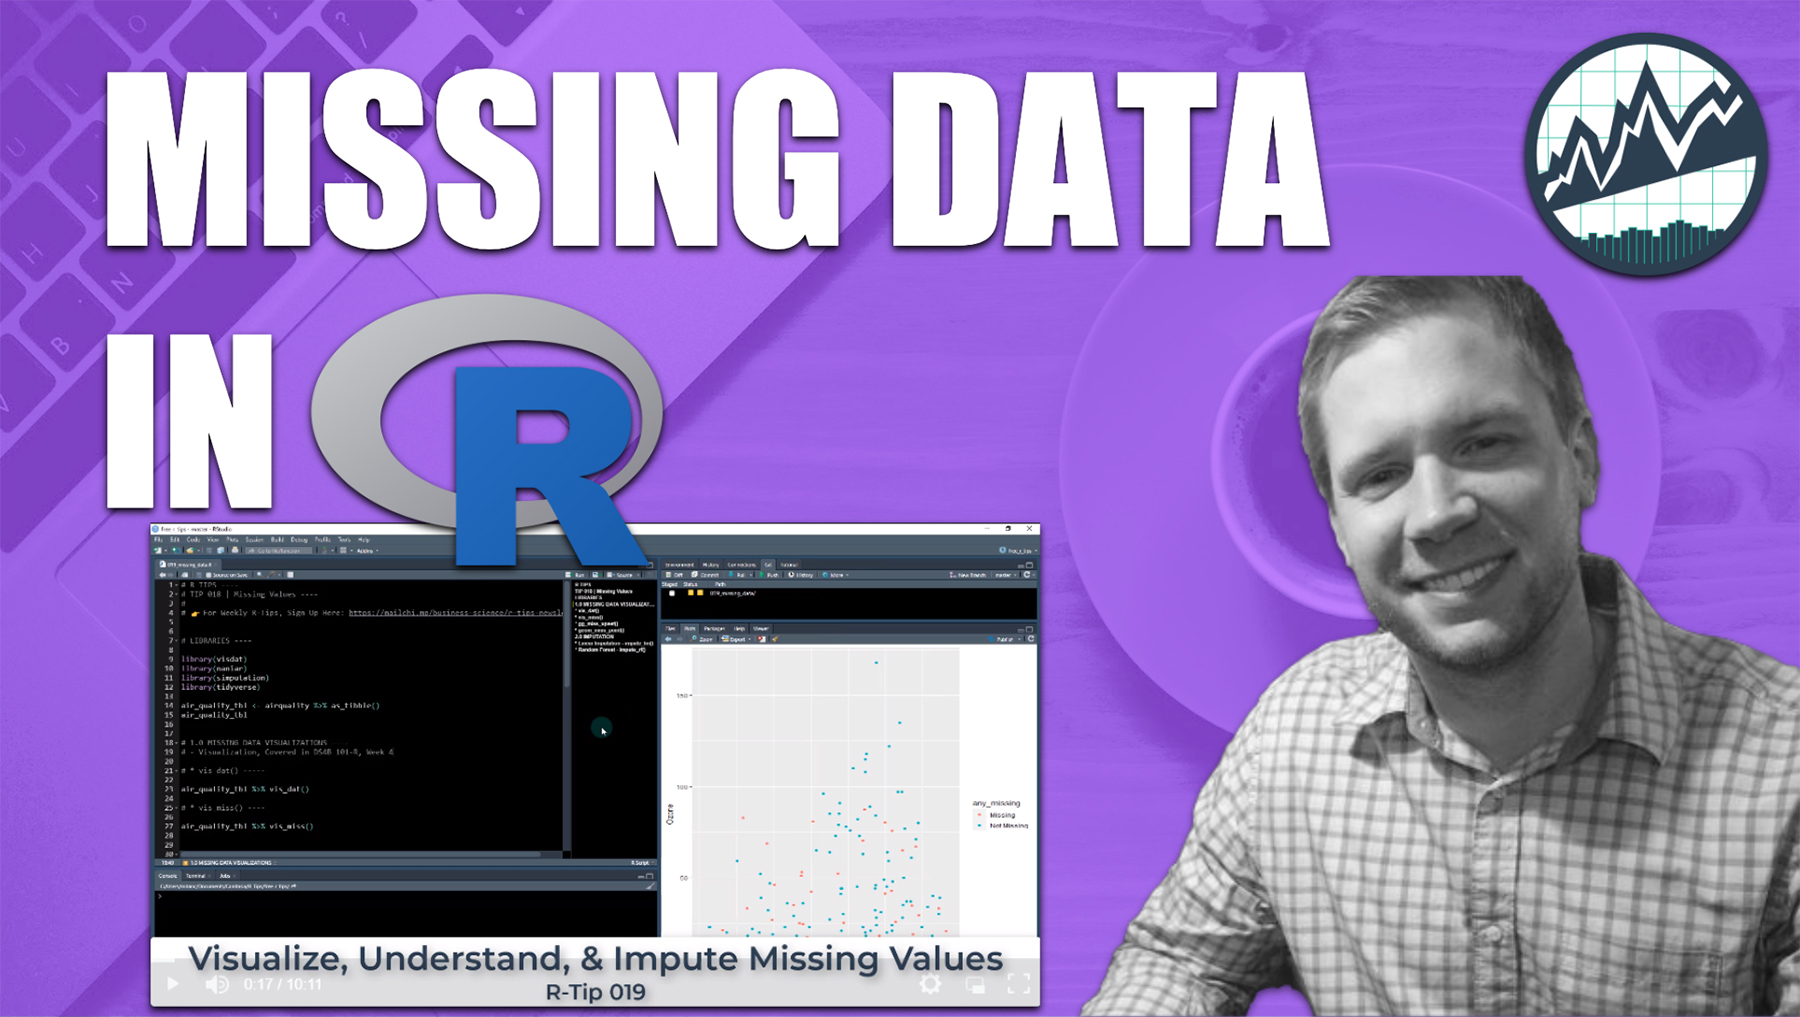
How to Handle Missing Data in R with simputation
Written by Matt Dancho
This article is part of a R-Tips Weekly, a weekly video tutorial that shows you step-by-step how to do common R coding tasks.
Missing values used to drive me nuts… until I learned how to impute them! In 10-minutes, learn how to visualize and impute in R using ggplot dplyr and 3 more packages to simple imputation.
Here are the links to get set up. 👇
Handling missing values
We’re going to kick the tires on 3 key packages:
visdat - For quickly visualizing datananiar - For working with NA’s (missing data)simputation - For simple imputation (converting missing data to values)
So let’s get started!
Visualizing Missing Data
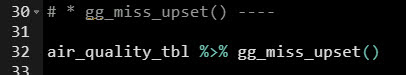
Using vis_miss(), gg_miss_upset() and geom_miss_point()
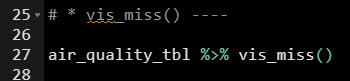
Quickly Skim Missing Data
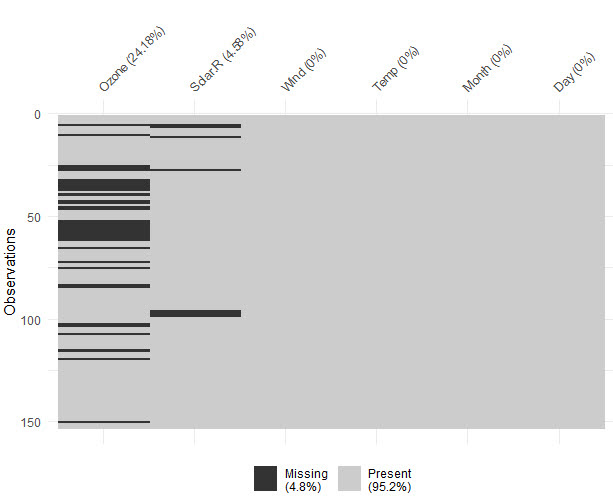
It doesn’t get any easier than this. Simply use visdat::vis_miss() to visualize the missing data. We can see Ozone and Solar.R are the offenders.
Identify Interactions in Column Missingness
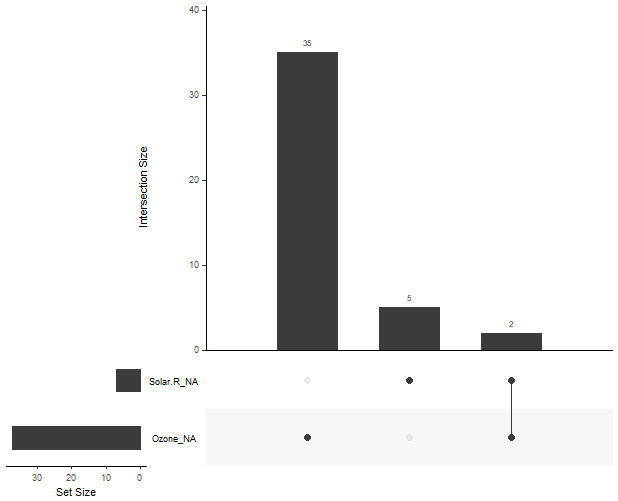
Use Case: It often makes sense to evaluate the interactions between columns containing missing data. We can use an “upset” plot for this.
Start with a good question:
“Is it often that we have both Ozone and Solar.R missing at the same time?”
We can answer this with gg_miss_upset(). We can see that 2 of 5 Solar.R (40%) happen at the same observation that Ozone is missing. Might want to check for IOT sensor issues!
Visualize Missing Observations in a Scatter Plot
Use Case: This is a great before/after visual.
For our final exploratory plot, let’s plot the missing data using geom_miss_point(). It works just like geom_point(), but plots where the missing data are located in addition to the non-missing data.
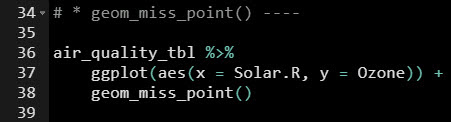
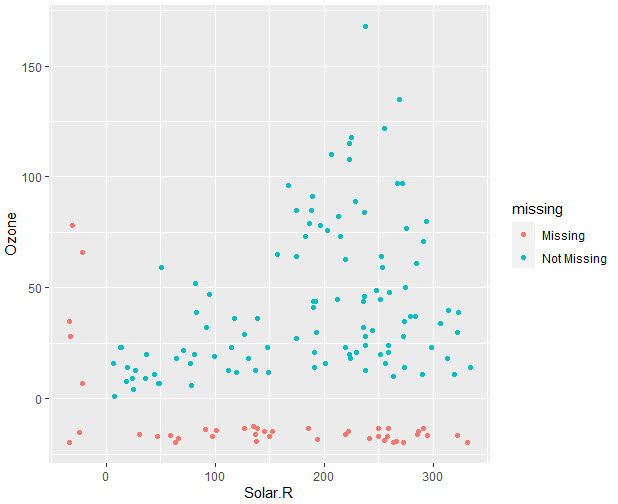
Before Imputation. Using geom_miss_point()
Imputation
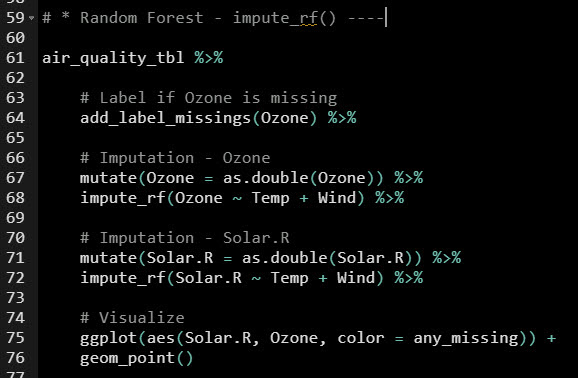
impute_rf()
The simputation library comes with a host of impute*()_ functions. We’ll focus on impute_rf(), which implements a random forest to do the imputation.
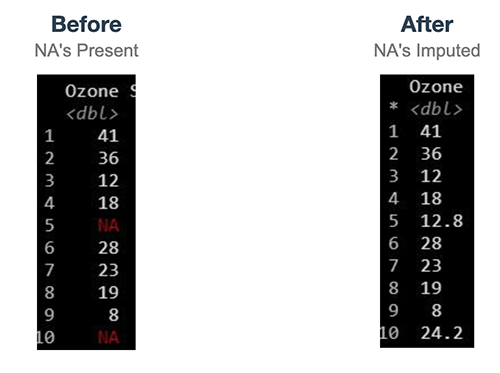
This imputes the NA’s, replacing the missing Ozone and Solar.R data. We can see the missing data follows the distribution of the non-missing data in the updated scatter plot.
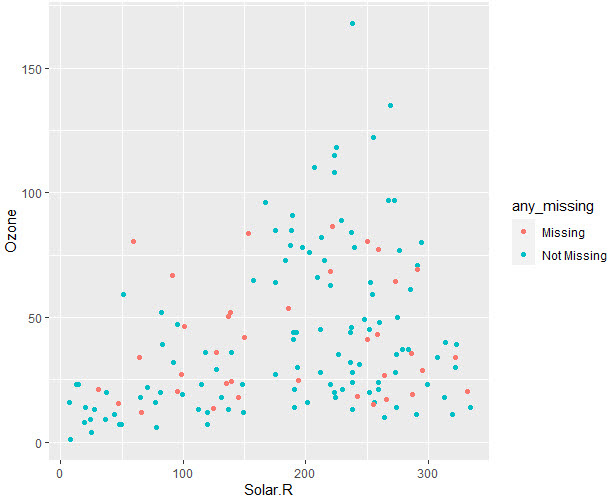
After Imputation. Using impute_rf() and geom_point()
Reminders:
- Full code in the Github Repository.
- Watch the YouTube Video for detailed instructions.
Time for an air-guitar celebration with your co-worker. 👇

But if you really want to improve your productivity…
Here's how to master R programming and become powered by R. 👇
What happens after you learn R for Business.

When your CEO gets word of your Shiny Apps saving the company $$$. 👇

This is career acceleration.
SETUP R-TIPS WEEKLY PROJECT
-
Get the Code
-
Check out the R-Tips Setup Video.
Once you take these actions, you’ll be set up to receive R-Tips with Code every week. =)