sklearn: Make your first linear regression model in Python [Video]
Written by Matt Dancho
Scikit Learn is a powerful package for making machine learning models. In this Python Tip, we cover how to make your first Linear Regression Model that adds a trendline to a plot.
In this short tutorial, you’ll make a Linear Regression Trendline Plot with Sklearn.
This article is part of Python-Tips Weekly, a bi-weekly video tutorial that shows you step-by-step how to do common Python coding tasks.
Get the code
Here are the links to get set up. 👇
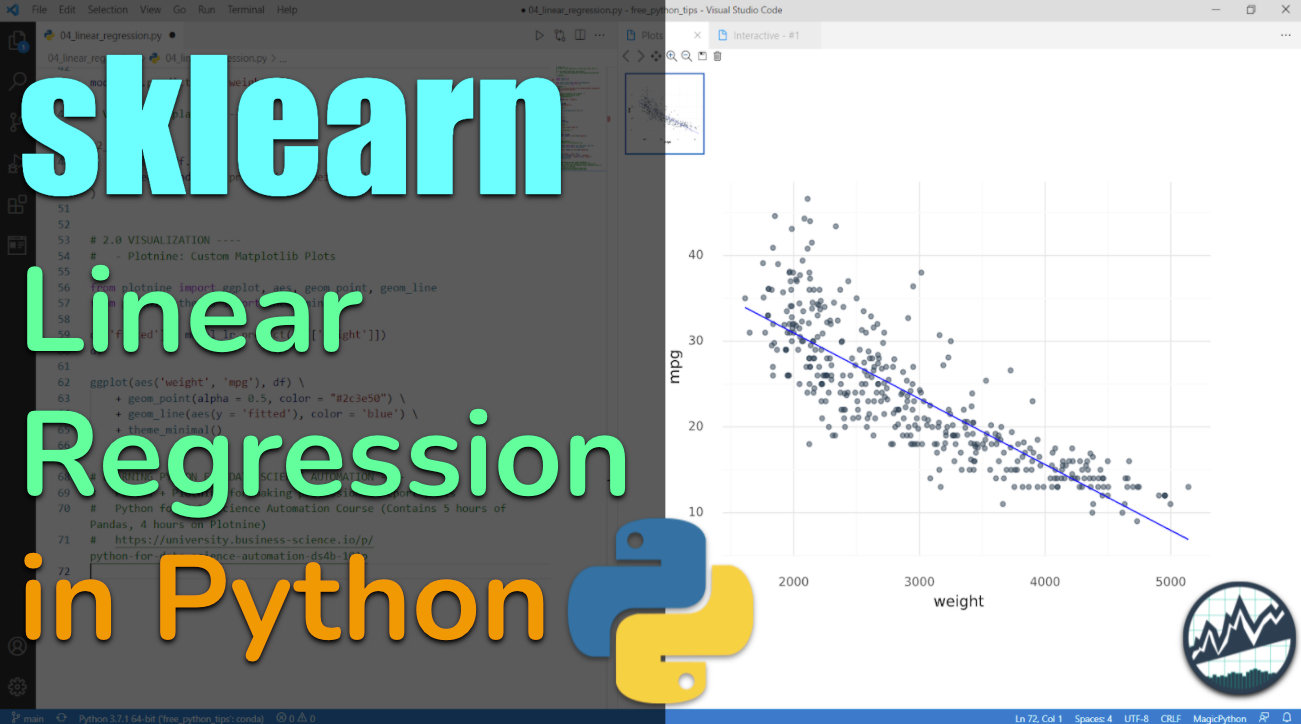
Sklearn Linear Regression Modeling Video Tutorial
For those that prefer Full YouTube Video Tutorials.
Learn how to use sklearn to make a linear regression model and plot with a trendline.
(Click image to play tutorial)
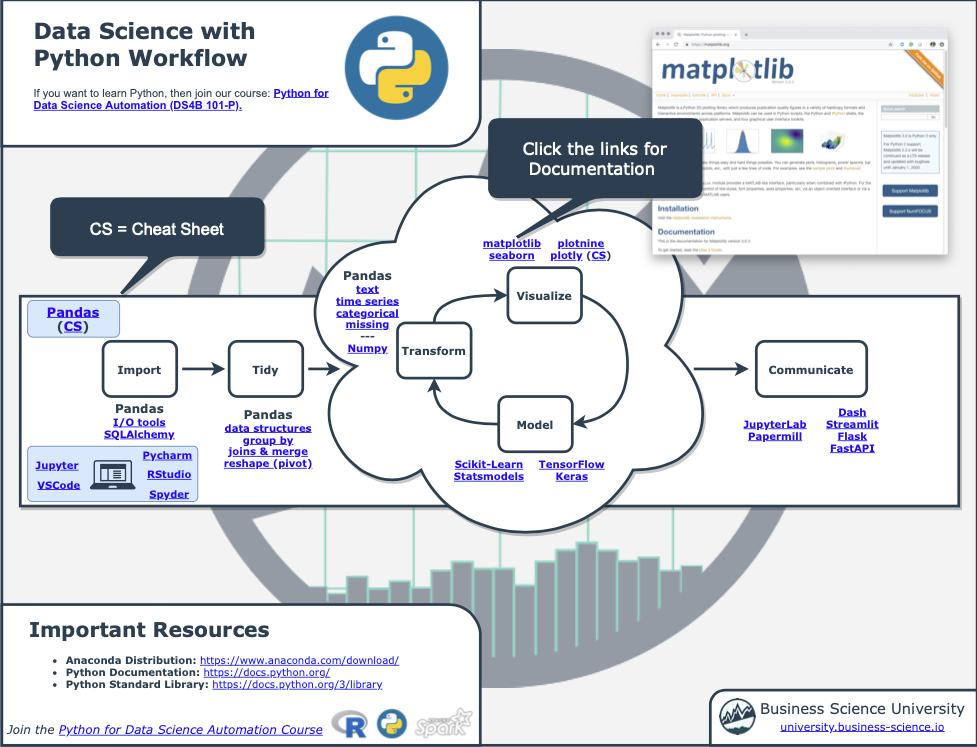
Before we get started, get the Python Cheat Sheet
I’ll use the Ultimate Python Cheat Sheet to access scikit learn documentation in this tutorial.
Ultimate Python Cheat Sheet:
First, Download the Ultimate Python Cheat Sheet. This gives you access to the entire Python Ecosystem at your fingertips via hyperlinked documenation and cheat sheets.
 (Click image to download)
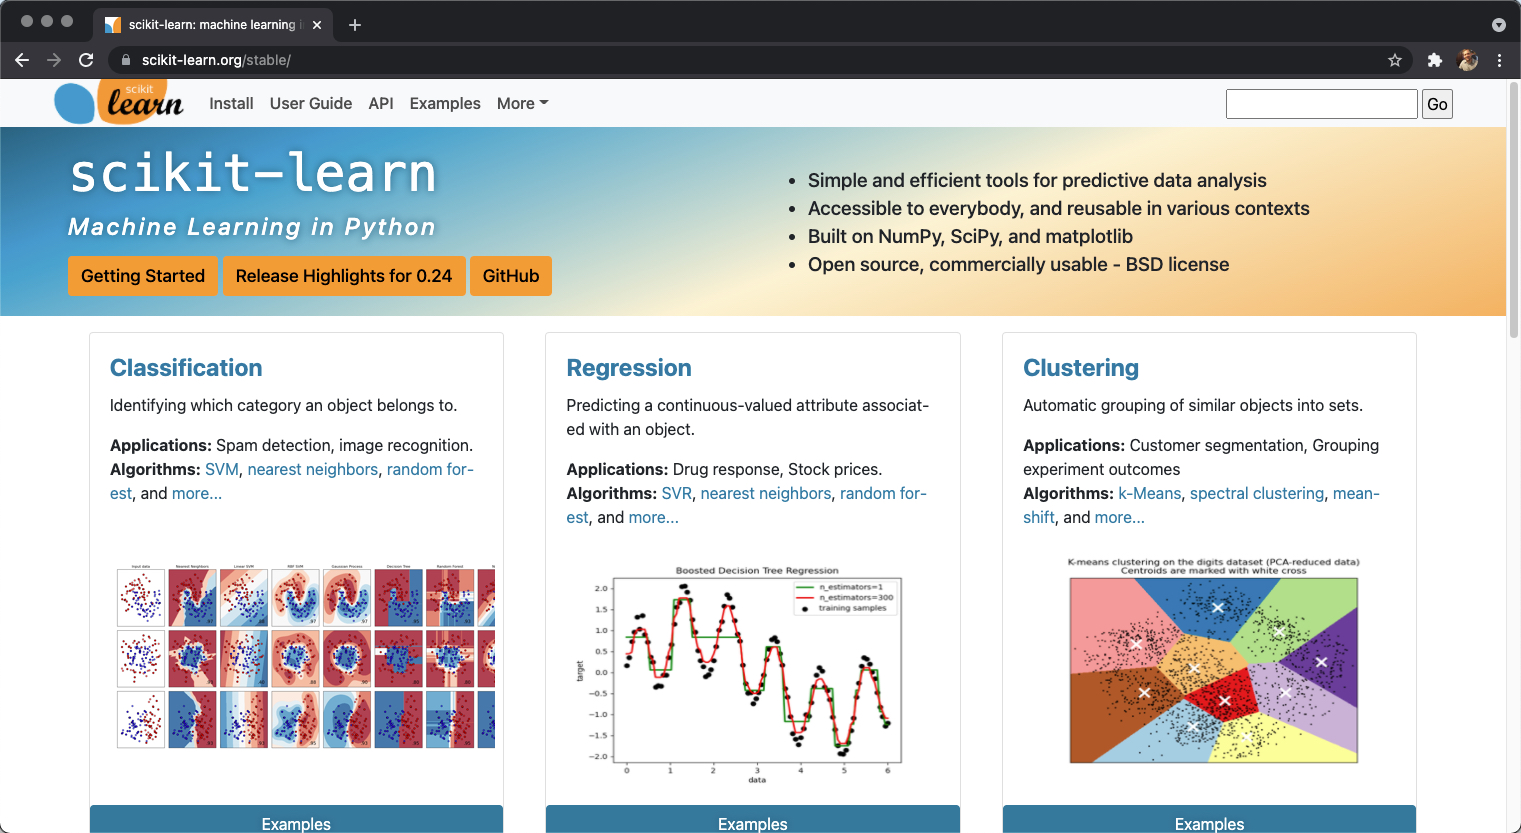
Click On Scikit-Learn
Navigate to the modeling section, and click on “Scikit Learn”.
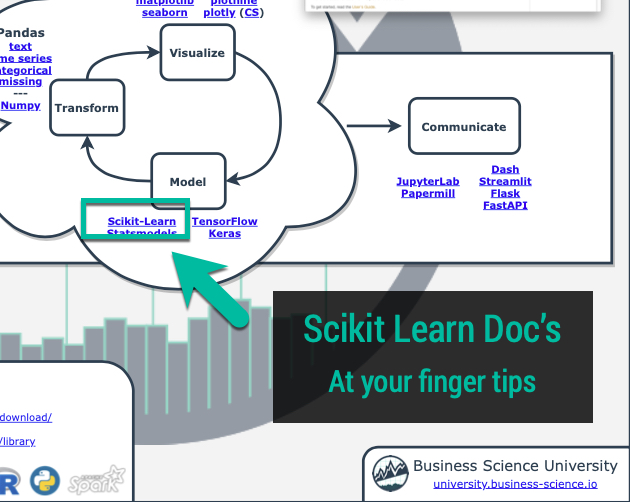
Explore Scikit Learn
Now, you have access to the Scikit Learn Documentation at your fingertips.
Onto the tutorial.
Project: Making a Regression Trendline Plot
Let’s check out how to make a professional regression trendline plot with Scikit Learn.
Get the code.
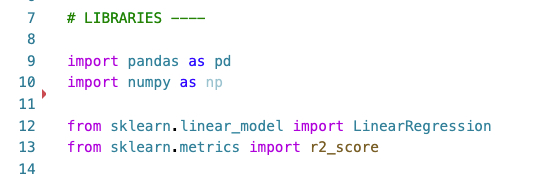
Step 1: Load Libraries and Data
First, let’s load the libraries and data. From the libraries, we’ll import numpy and pandas along with LinearRegression and r2_score from sklearn to start out.
Get the code.
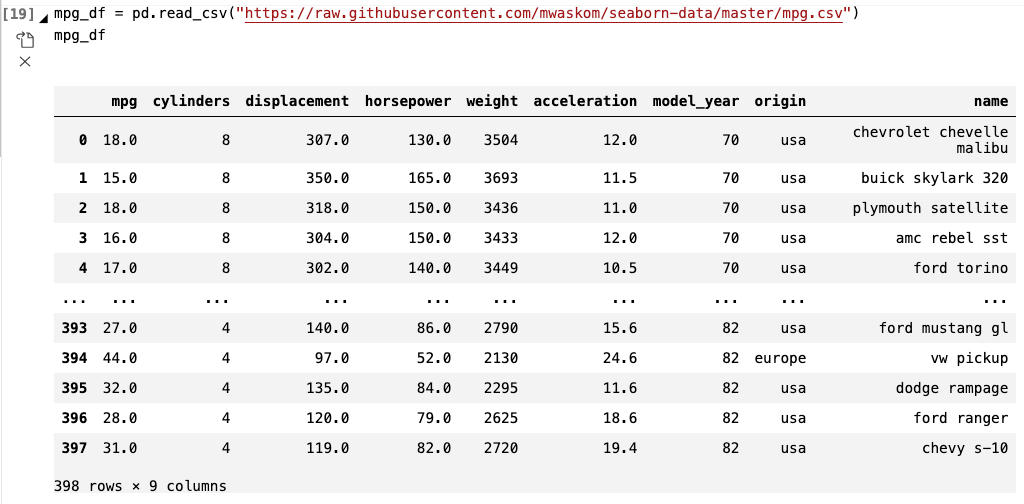
We’ll also load the mpg_df data set.
Get the code.
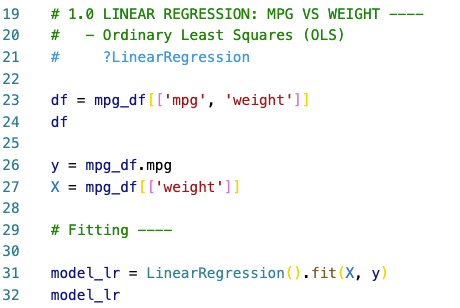
Step 2: Fit the Linear Regression Model
Goal: Understand the relationship between Fuel Economy (MPG) and Vehicle Weight.
Next, we can assess the relationship between vehicle fuel economy and vehicle weight using a Linear Regression Model. We fit the model first.
Code
We’ll use the LinearRegression() method from sklearn.linear_model to train a Linear Regression Model. This is the same process as in the Sklearn Documentation for OLS Regression.
Get the code.
Step 3: Making Predictions
We can use the trained (fitted) Linear Regression Model to make predictions. Simply call the predict() method on a Pandas Data Frame containing vehicle weights. A Numpy Array is returned with predictions for the vehicle fuel economy (MPG).
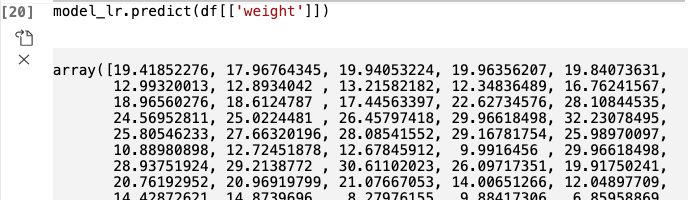
Get the code.
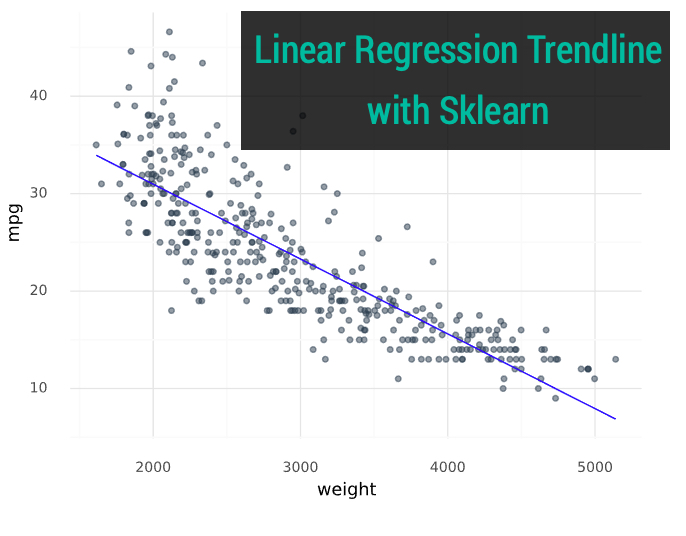
Step 4: Visualize with Plotnine
The last step is to visualize the relationship between fuel economy and vehicle weight. We can use plotnine.
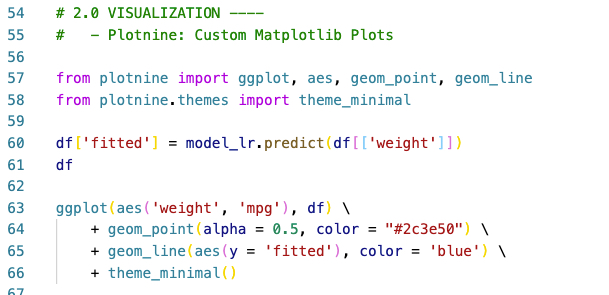
Get the code.
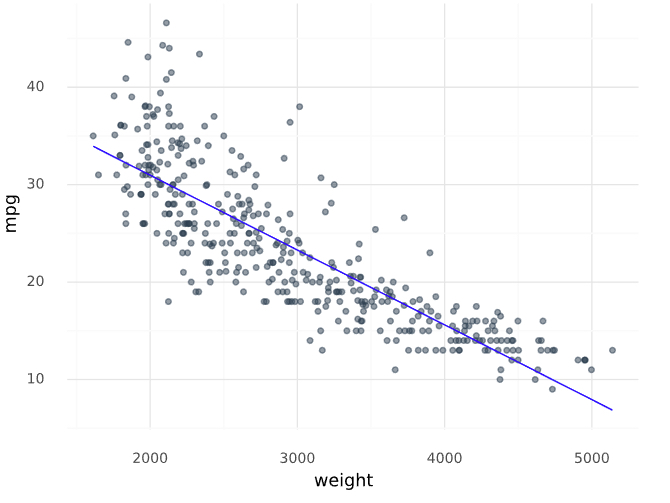
The visualization that is return clearly shows an inverse trend between vehicle fuel economy and weight.
Summary
This was a short introduction to Scikit Learn, which is a foundational machine learning and modeling library in Python. We saw how we can use sklearn to make a linear regression model, and visualize the model prediction as a relationship with plotnine.
But, this was a simple problem and you’re eventually going to want to solve real-world problems that are much more complex:
-
Most data science projects require much more data wrangling, visualization and reporting.
-
Most data science teams use Pandas and Scikit Learn
-
Many organizations are transitioning to automations (producing reports and data insights on-demand)
So, it makes sense to eventually learn Pandas and Scikit Learn to help with communication and working on R/Python teams.
If you’d like to learn data science for business with Pandas, Sktime, Plotnine, and more Python packages then read on. 👇
How I can help
If you are interested in learning Python and the ecosystem of tools at a deeper level, then I have a streamlined program that will get you past your struggles and improve your career in the process.
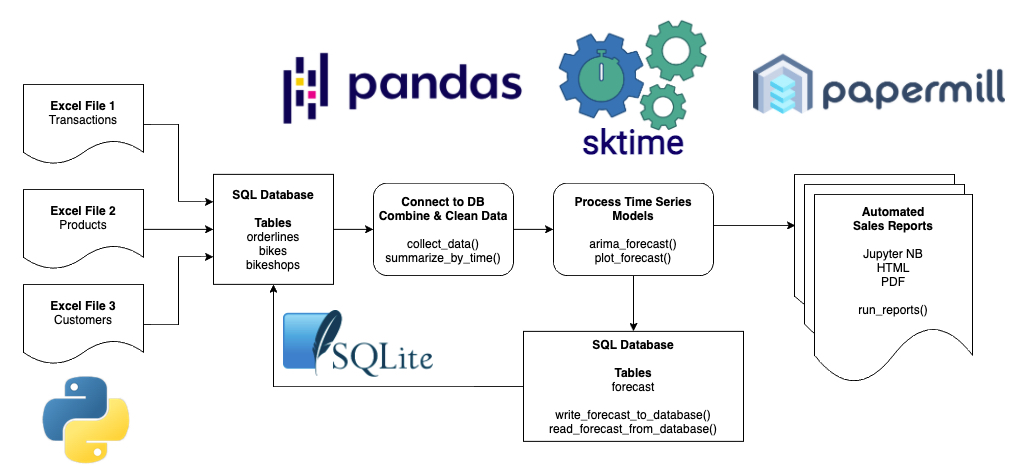
It’s called the Python for Data Science Automation. It’s an integrated course that teaches you Python by integrating tools and solving real business problems.

The result is that you break through previous struggles, learning from my experience & our community of 2000+ data scientists that are ready to help you succeed. You’ll learn a ton going through our Business Process Automation project.
Ready to take the next step?
Then let’s get started.
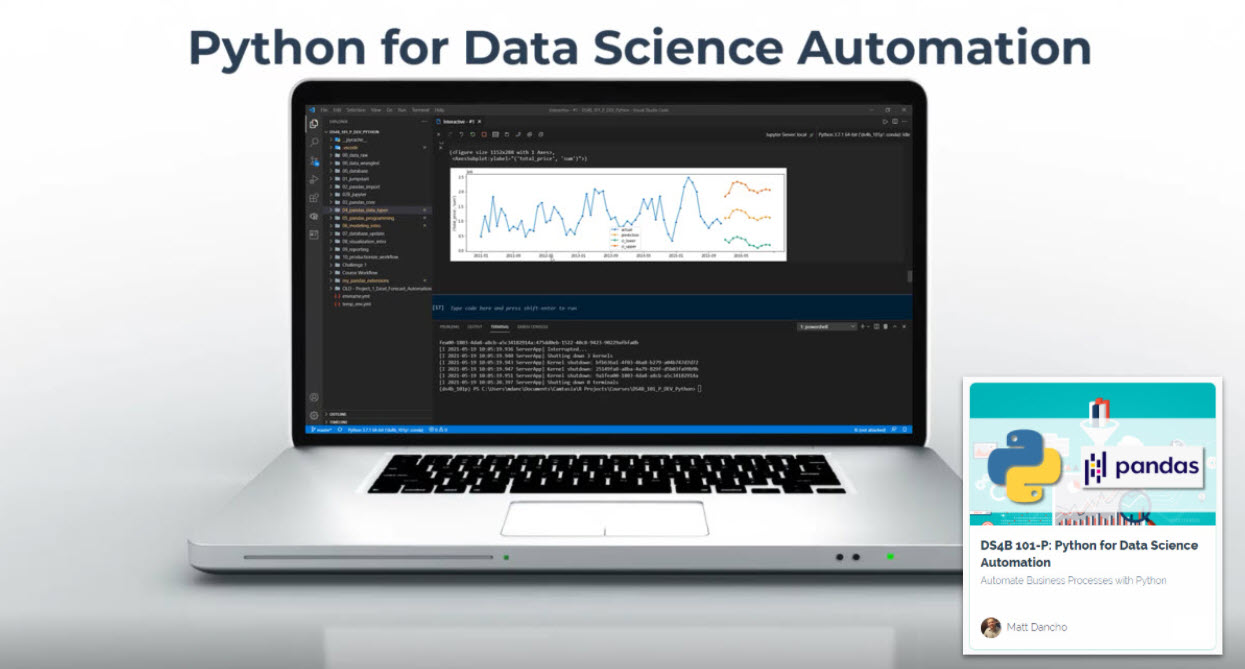 (Click image to go to course)