How to Scrape Word Documents with R
Written by Matt Dancho
This article is part of a R-Tips Weekly, a weekly video tutorial that shows you step-by-step how to do common R coding tasks.
Today we discuss an awesome skill for automating data collection from word documents:
 (Click image to play video)
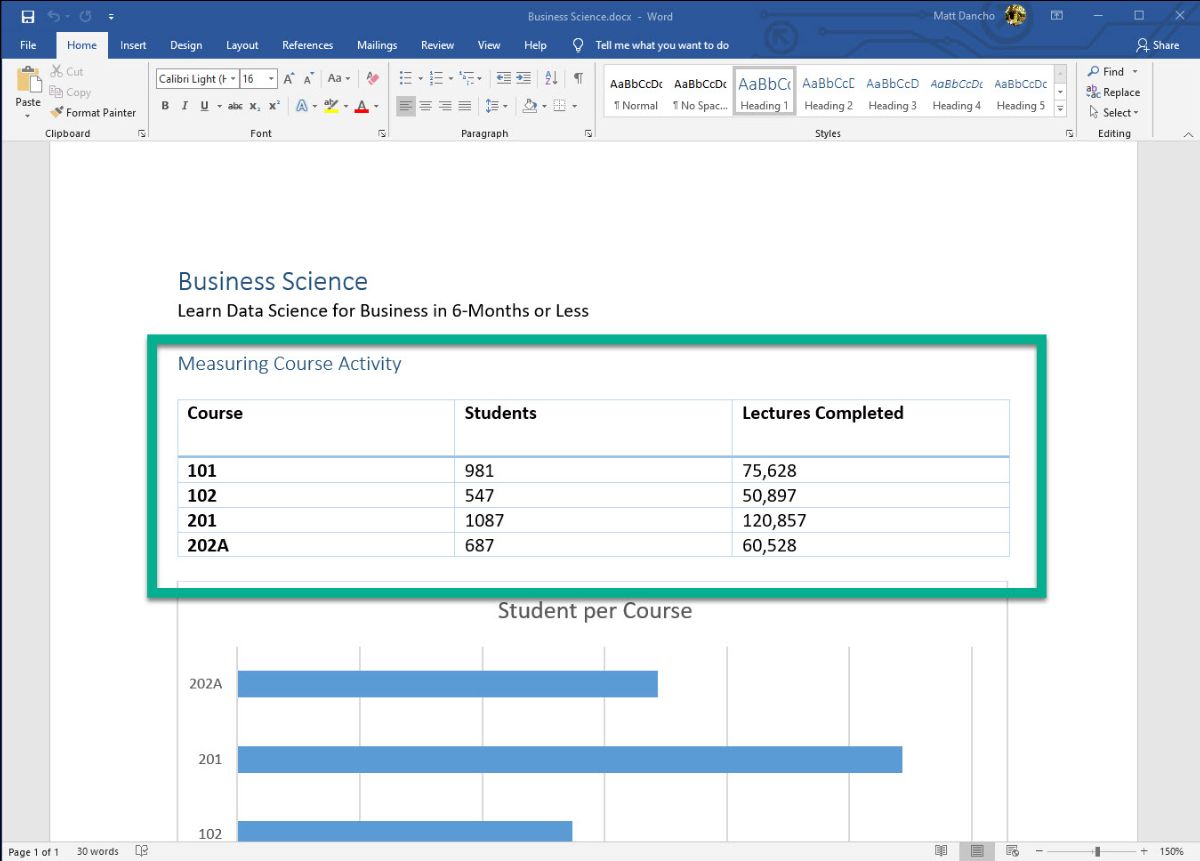
Here’s a common situation, you’re company has LOTS OF WORD FILES.
They contain tables of information that look like this:
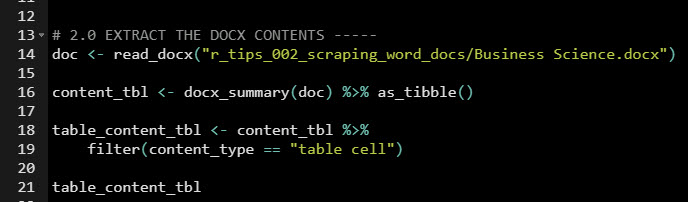
Thinking like a programmer, you can extract this data using officer:
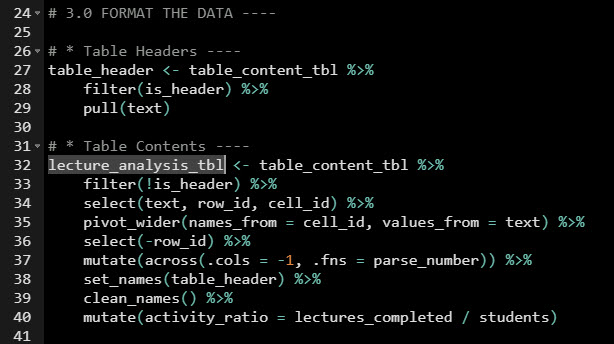
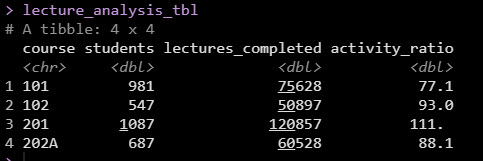
With a little bit of data wrangling with the tidyverse, you’ve got your table extracted & formatted:
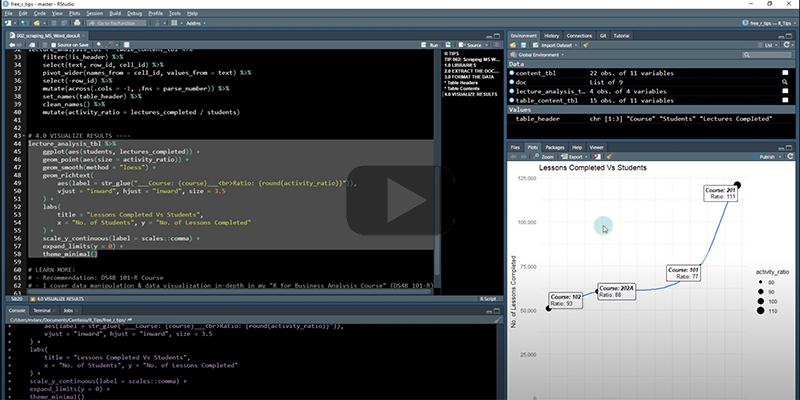
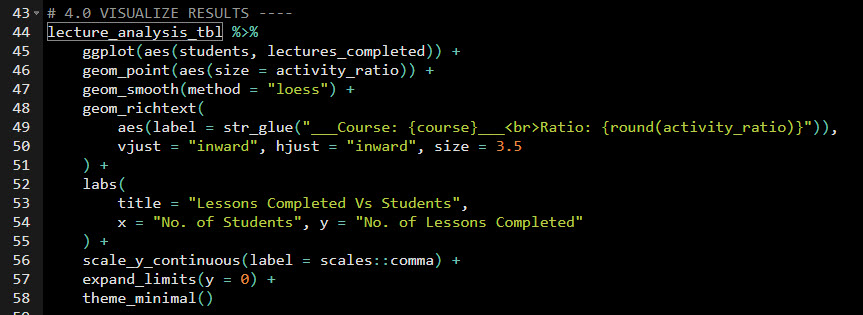
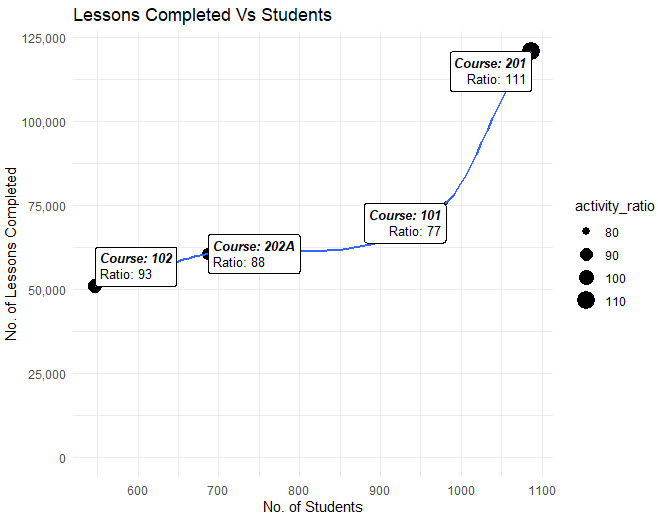
Then you use ggplot2 to make a sweet plot:
Whoa - Look at 201! Getting a high “Activity Ratio” - Ratio of Lessons completed to Number of Students Enrolled:
You’ve just automated extracting word tables in R. BOOM! 💥💥💥

SETUP R-TIPS WEEKLY PROJECT
-
Get the Code
-
Check out the R-Tips Setup Video.
Once you take these actions, you’ll be set up to receive R-Tips with Code every week. =)