Data Science With R Course Series - Week 7
Written by David Curry
After week 7, you will be able to communicate confidently which model features are the most important.
Interpretability is a very important topic in machine learning. The automated machine learning tool, H2O, makes a data scientist’s life easier, however it doesn’t remove the need to understand your model. As the data scientist, you need to be able to explain why the selected model is the best.
In this week’s curriculum, you learn how to explain “black-box” machine learning models with LIME. LIME stands for Local Interpretable Model-Agnostic Explanations and is used to understand which model features have the most predictive impact.
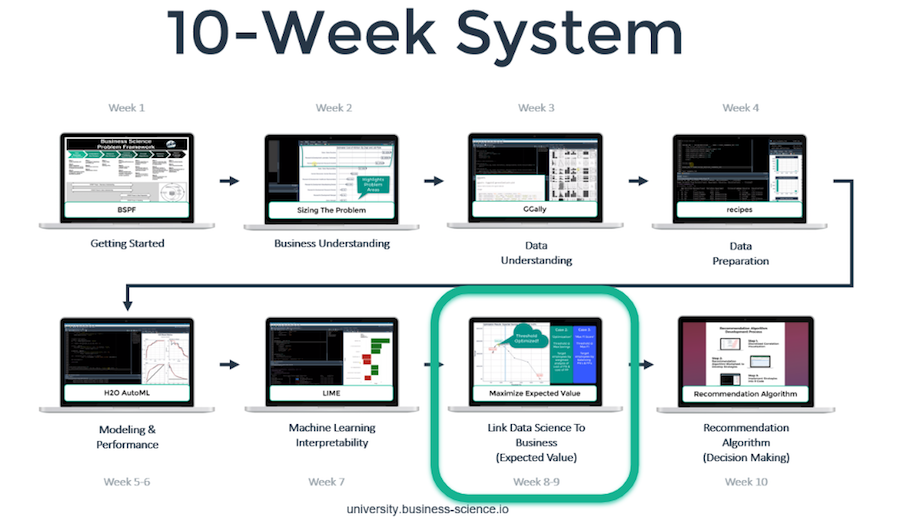
Here is a recap of our trajectory and the course overview:
Recap: Data Science With R Course Series
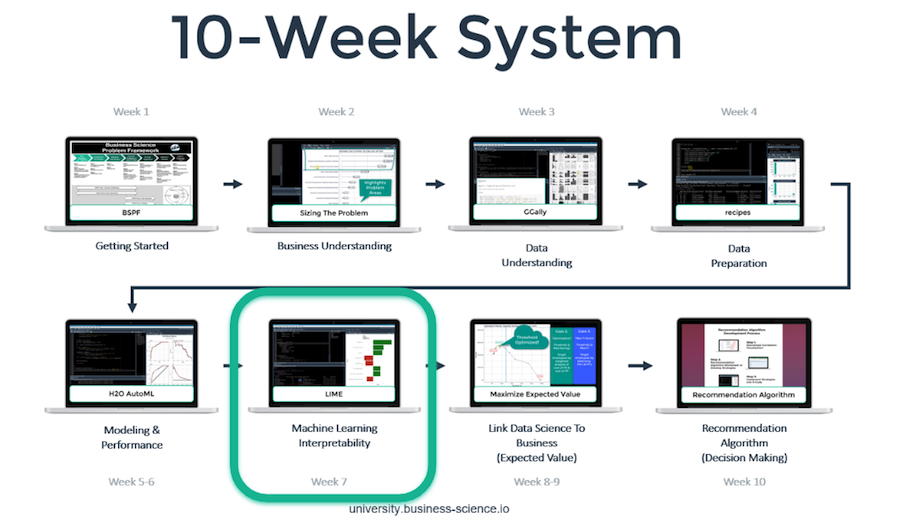
You’re in the Week 7: Machine Learning Interpretability with LIME. Here’s our game-plan over the 10 articles in this series. We’ll cover how to apply data science for business with R following our systematic process.
Week 7: Machine Learning Interpretability with LIME

Student Feedback
Week 7: Machine Learning Interpretability with LIME
Overview & Setup
The Overview & Setup will walk through the setup to support LIME within the project workflow, and prepare the machine learning model for interpretation.
After understanding the features that make up your machine learning model, you will be able to answer the critical business question, Why is employee churn happening?
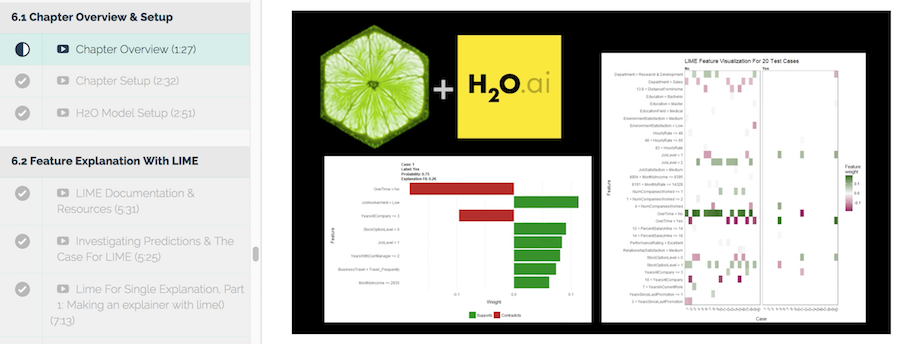
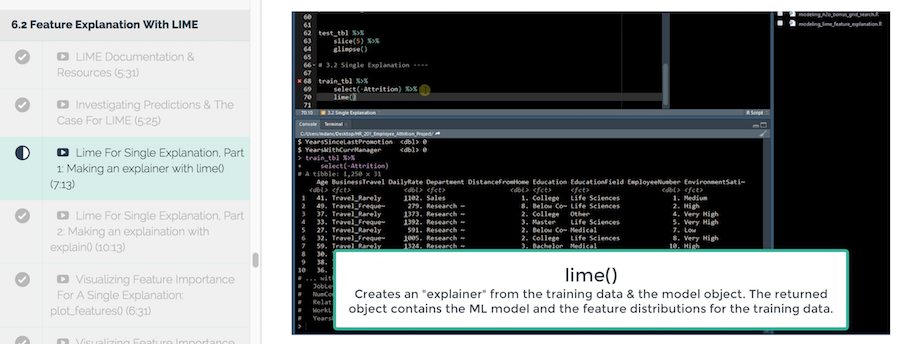
Feature Explanation With LIME
Jump right into learning about the LIME package and how it works to interpret machine learning models. Here you will make predictions using your model and investigate employee turnover model results. You will then use LIME to produce an explanation of why certain employees were selected.
Challenge #4
In this 2 part challenge, you will recreate a single explanation plot and a full explanations plot to visualize important features.
After you complete the challenge, walk through the Solution videos to compare and review your working solution.
You Need To Learn R For Business
To be efficient as a data scientist, you need to learn R. Take the course that has cut data science projects in half (see this testimonial from a leading data science consultant) and has progressed data scientists more than anything they have tried before. Over 10-weeks you learn what it has taken data scientists 10-years to learn:
- Our systematic data science for business framework
- R and H2O for Machine Learning
- How to produce Return-On-Investment from data science
- And much more.
Start Learning Today!
Next Up
The next article in the Data Science With R Series covers Evaluation: Calculating The Expected ROI (Savings) Of A Policy Change.
Learn how to communicate the cost savings of using your model. Inform the business to make decisions around time and resources based on the value of your findings.
Use the Expected Value Framework after your model is complete to explain which features are most important. The Expected Value Framework is a method to calculate savings from implementing business changes based on the model’s results.
Week 8: Evaluation: Calculating The Expected ROI (Savings) Of A Policy Change
New Course Coming Soon: Build A Shiny Web App!
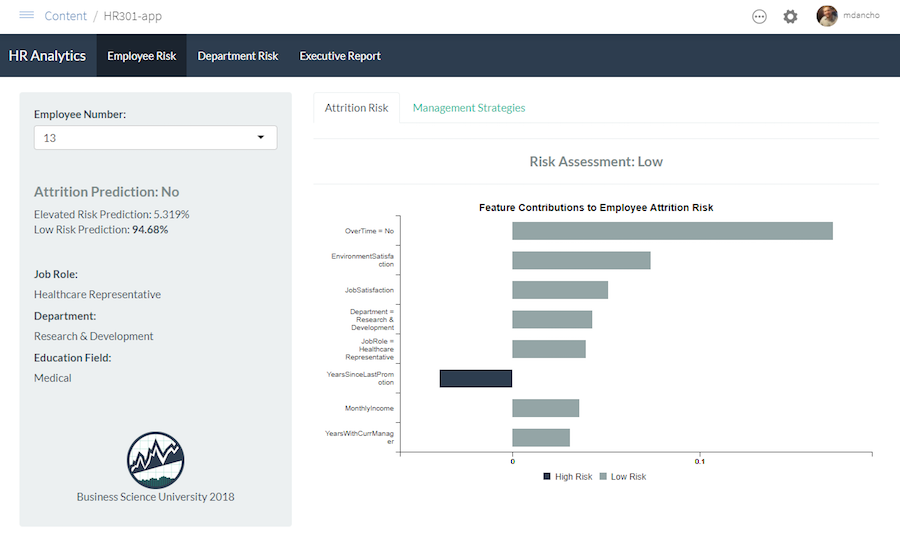
You’re experiencing the magic of creating a high performance employee turnover risk prediction algorithm in DS4B 201-R. Why not put it to good use in an Interactive Web Dashboard?
In our new course, Build A Shiny Web App (DS4B 301-R), you’ll learn how to integrate the H2O model, LIME results, and recommendation algorithm building in the 201 course into an ML-Powered R + Shiny Web App!
Shiny Apps Course Coming in October 2018!!! Sign up for Business Science University Now!
Building an R + Shiny Web App, DS4B 301-R
Get Started Today!