Data Science With R Course Series - Week 10
Written by David Curry
Week 10 is designed to integrate critical thinking and strategy development with data-driven decision making. As an added bonus, you’ll see a sneak preview of the Shiny Web App built in DS4B 301-R. The Recommendation Algorithm developed here plays a major role in that course.
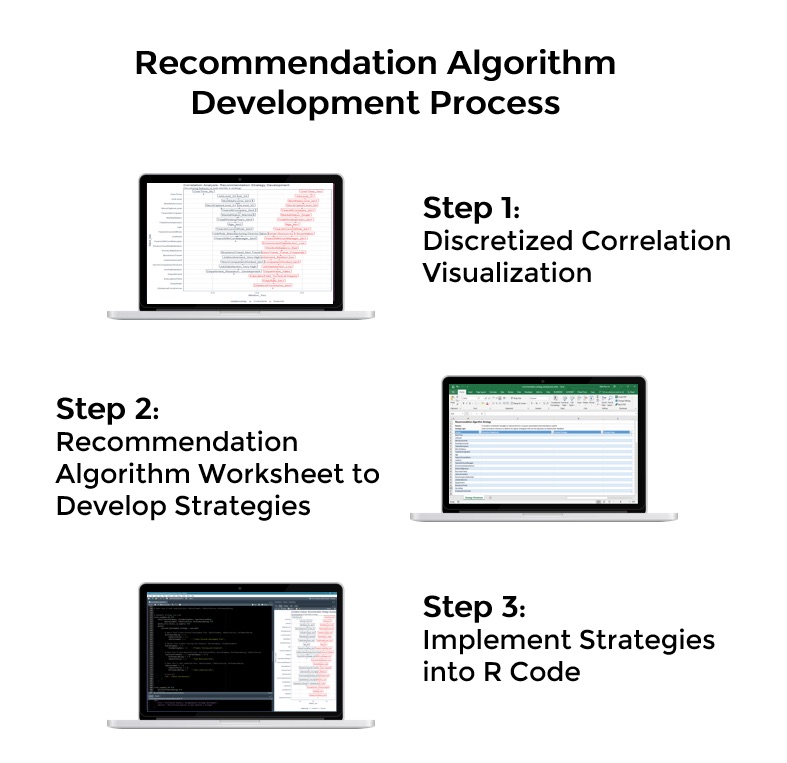
You will implement a 3-Step Process for creating a recommendation algorithm:
-
Creating a “Correlation Funnel” - This is a discretized correlation plot that enables us to visualize cohort relationships to the target variable, attrition.
-
Using A Recommendation Algorithm Worksheet To Develop Strategies - This is key to having a structured approach to developing data-driven recommendations. It’s also a communication tool for executives & process stakeholders to showcase the logic you used and to incorporate their input into the strategies.
-
Implementing Strategies Into R Code - You’ll develop a function called recommend_strategies() that outputs strategies by employee. This function is integral to DS4B 301-R, Building A Shiny Web App.
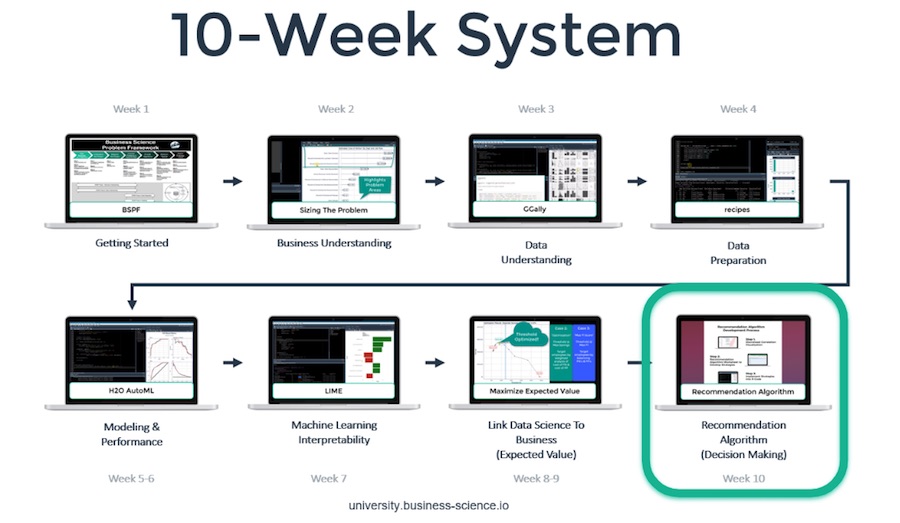
Here is a recap of our trajectory and the course overview:
Recap: Data Science With R Course Series
You’re in the Week 10: Build A Recommendation Algorithm To Improve Decision Making. Here’s our game-plan over the 10 articles in this series. We’ll cover how to apply data science for business with R following our systematic process.
Week 10: Build A Recommendation Algorithm To Improve Decision Making

Student Feedback
Week 10: Build A Recommendation Algorithm To Improve Decision Making
Overview and Setup
The Overview and Setup is an introduction to this week’s learning modules where you create logic to help managers implement data-driven strategies to reduce turnover.
Go through a three step process for building a recommendation algorithm from scratch.
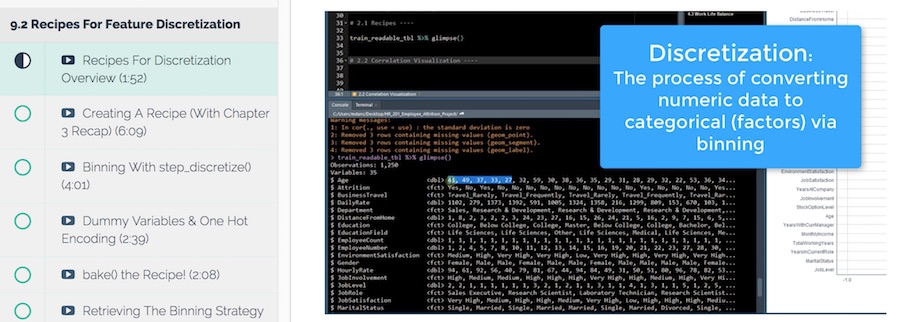
Recipes for Feature Discretization
Learn to format data to create a visualization that will compare cohorts within the data. Continue to use the recipes package to discretize features for correlation analysis.
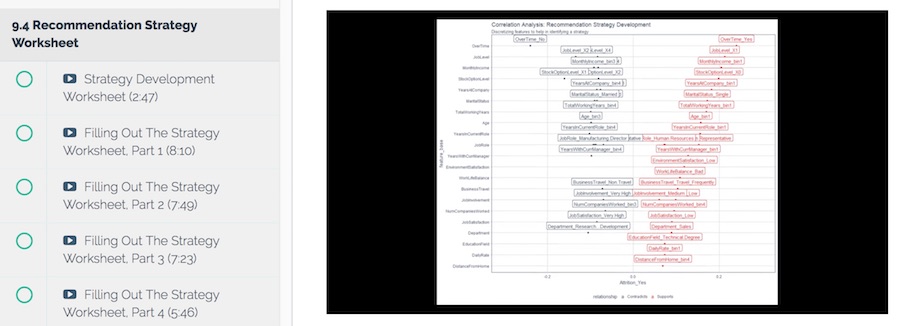
Discretized Correlation Visualization
Create a visualization that shows the features that both support and contradict attrition. You will create the visualization below by first manipulating the data, then creating the visualization with the formatted data.
Challenge #7: Custom Descritized Correlation Plotting Function
Using your code from the Discretized Correlation Visualization module, your challenge is to create a reusable discretized correlation plot function. The process of converting existing code to a custom function has been done a few times throughout the course. By now you will be comfortable refactoring code for reusability.
Compare your results with the instructor solution videos after your solution is complete.
Recommendation Strategy Worksheet
Create a recommendation strategy development worksheet that will be used by managers to reduce employee attrition using an automated recommendation system.
The strategy worksheet is an excel based tool for creating strategy logic to help reduce employee attrition problem.
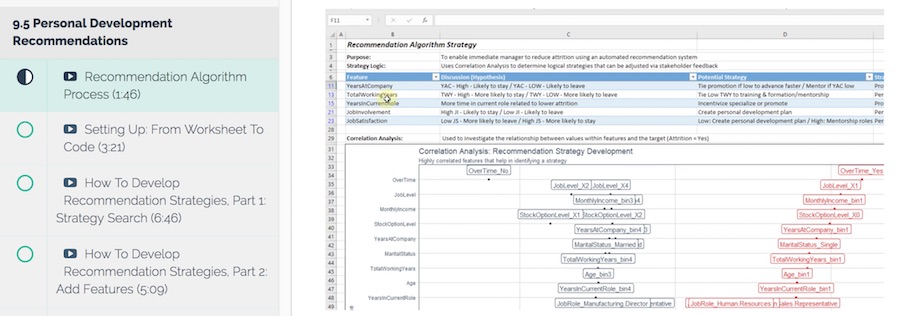
Personal Development Recommendations
Get ready to create a recommendation algorithm. Use your existing attrition strategy worksheet to create the recommendation algorithm with the following 3 steps:
- Focus on one strategy group to identify features that are interrelated to a specific strategy
- Develop strategies such as (bad, good, better, best)
- Implement the recommendation algorithm to code
The personal development recommendation strategies will help managers target employees for individual development, such as mentorship or training.
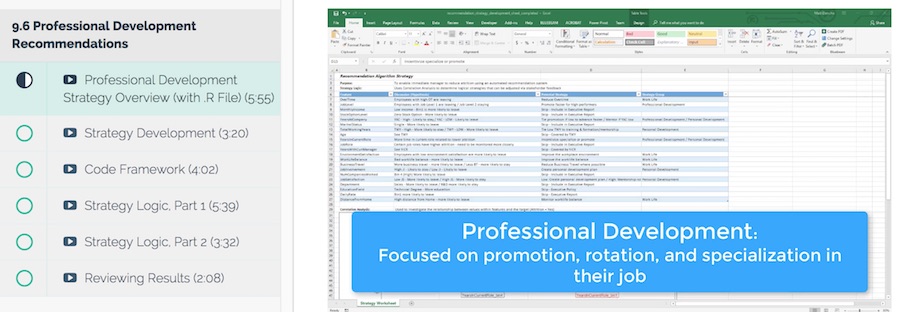
Professional Development Recommendations
In the previous section you learned the process to take the recommendation algorithm from the worksheet to code implementation. In this module, you will work through a similar process for employee professional development.
The professional development recommendations will help managers identify employees for career development, such as a promotion or specialized role.
Challenge #8: Work Environment Recommendations
In this challenge you will create a work environment strategy. Identify work-life balance features, then follow the same process used to develop the personal and professional development strategies to create the work environment strategy
Once complete, compare your results with the instructor solution videos.
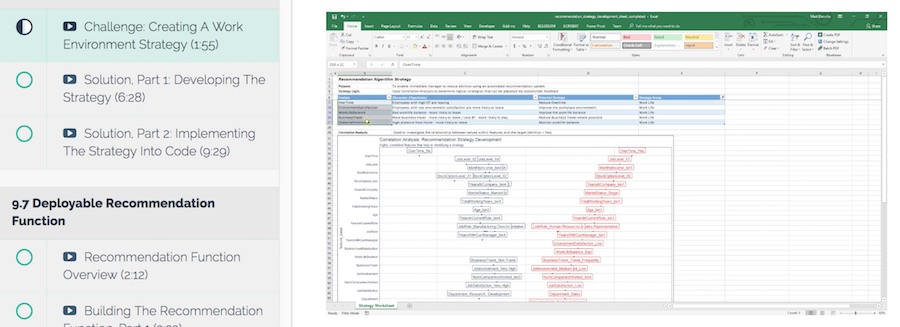
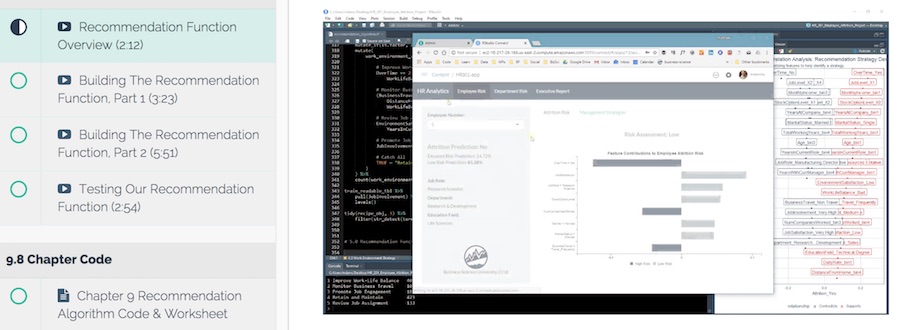
Deployable Recommendation Function
In the last course module, you will convert the recommendation algorithm to a function. The purpose of creating a deployable function is so that the recommendation logic can be reused in different business applications.
The deployable recommendation function is the same function that will be used to create a shiny app for the course, Build A Shiny Web App (DS4B 301-R).
Now is the Time to Level-Up Your Data Science Skills!

To be efficient as a data scientist, you need to learn R. Take the course that has cut data science projects in half (see this testimonial from a leading data science consultant) and has progressed data scientists more than anything they have tried before. Over 10-weeks you learn what it has taken data scientists 10-years to learn:
- Our systematic data science for business framework
- R and H2O for Machine Learning
- How to produce Return-On-Investment from data science
- And much more.
Start Learning Today!