Data Science With R Course Series - Week 5
Written by David Curry

The culmination of the previous weeks has been preparation for machine learning modeling. At this stage, we have defined the business problem, we’ve explored and understood how the data relates to the business problem, and we’ve preprocessed the data in preparation for modeling.
This week will focus on the following topics:
- Introduction to automated machine learning, predictive modeling with H2O
- Apply automated machine learning to the Attrition problem
- Develop high-performance models and learn how automated machine learning works
- Develop a visualization of the models to communicate the best and worst performing models
Here is a recap of our trajectory and the course overview:
Recap: Data Science With R Course Series
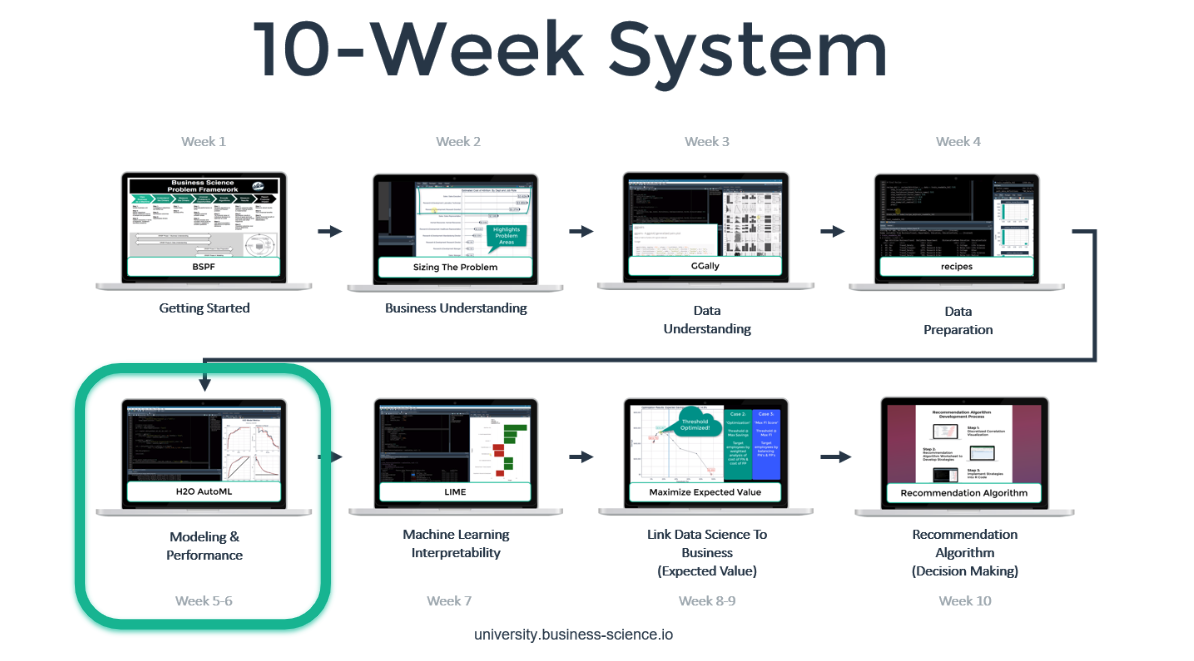
You’re in the Week 5: Predictive Modeling With H2O. Here’s our game-plan over the 10 articles in this series. We’ll cover how to apply data science for business with R following our systematic process.
Week 5: Predictive Modeling With H2O

Student Feedback
Week 5: Predictive Modeling With H2O
Modeling Setup
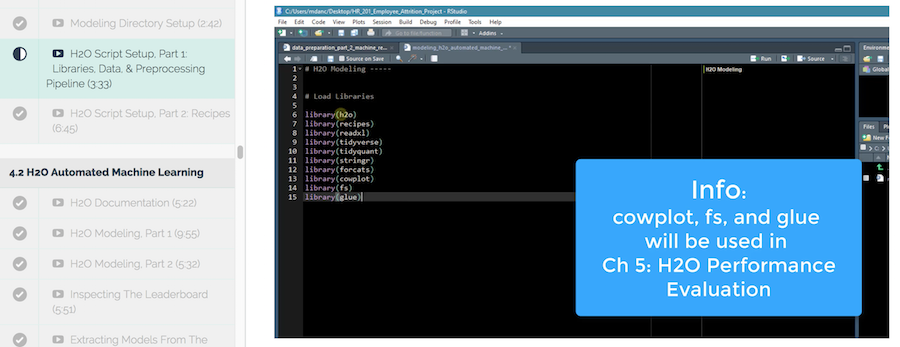
The modeling setup focuses on structuring your project to support new utility functions and extracted models from H2O automated machine learning.
In addition, you will be introduced to the new libraries cowplot, fs and glue - used in evaluating H2O model performance.
H2O Automated Machine Learning
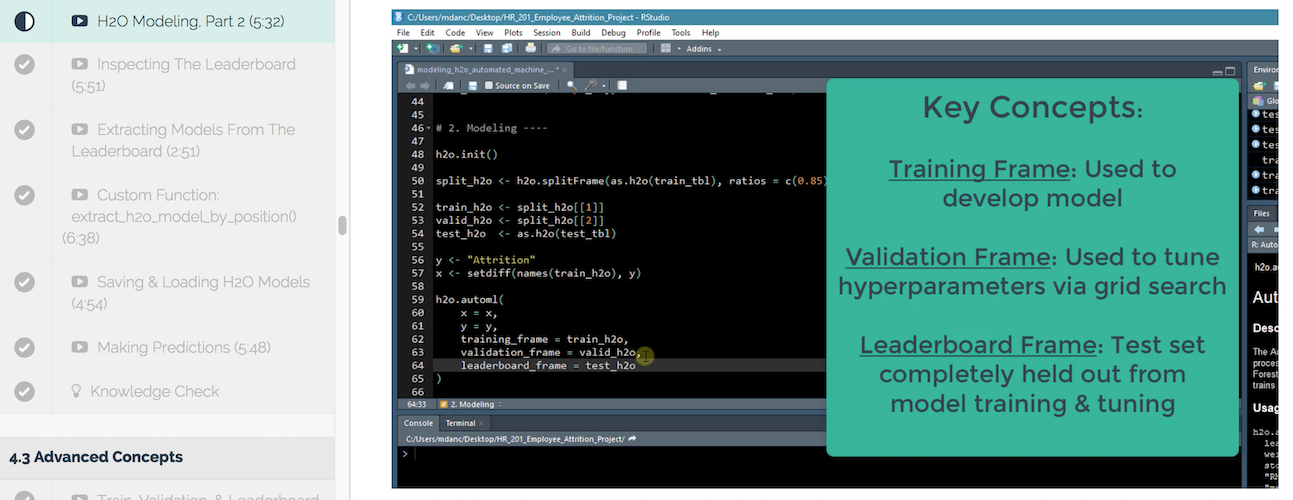
H2O automated machine learning is an exciting part of the course. This module will teach you the following:
- Learn how to use the H2O library to create machine learning models
- Inspect the model leaderboard to select the best performing models
- Extract and save models to your directory structure for exploration
- Make predictions using your models
- Use H2O documentation to continue learning
Advanced Concepts
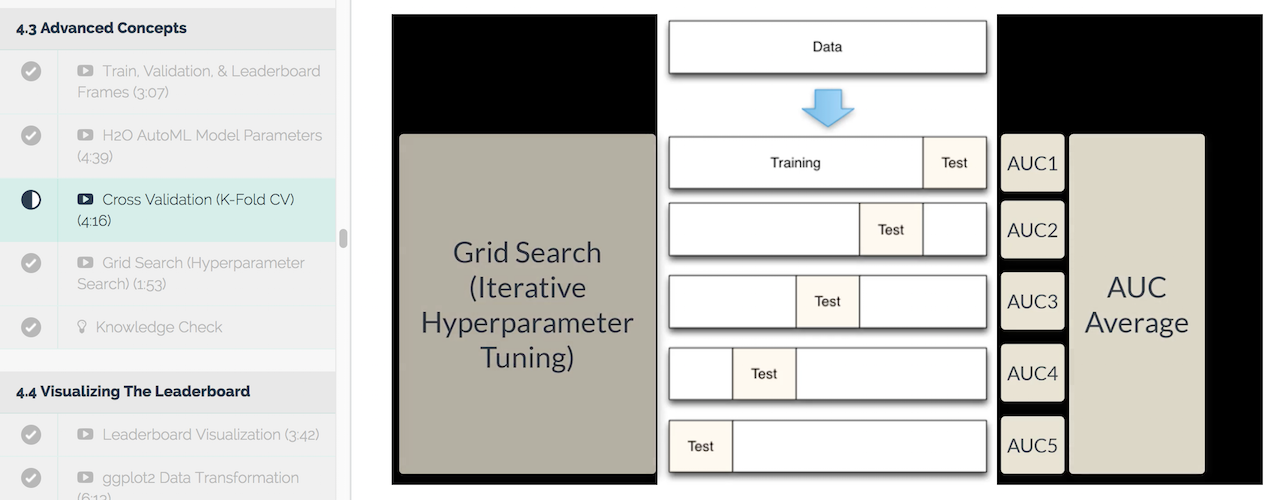
Automated machine learning is an effective way to create and compare multiple machine learning models. However, you still need to understand why a model is good or bad and adjust individual model parameters for better performance.
The advanced concepts will teach you how to modify model parameters, create a stable model using k-fold cross-validation, and an introduction to the grid search algorithm - the process automated machine learning uses to generate models.
Visualizing The Leaderboard
Leaderboard visualization is a great way to communicate model performance. Learn how to create a function for visual representation of your machine learning models. The visualization can be filtered by model metrics, such as AUC or Logloss (more about AUC and Logloss in week 6).
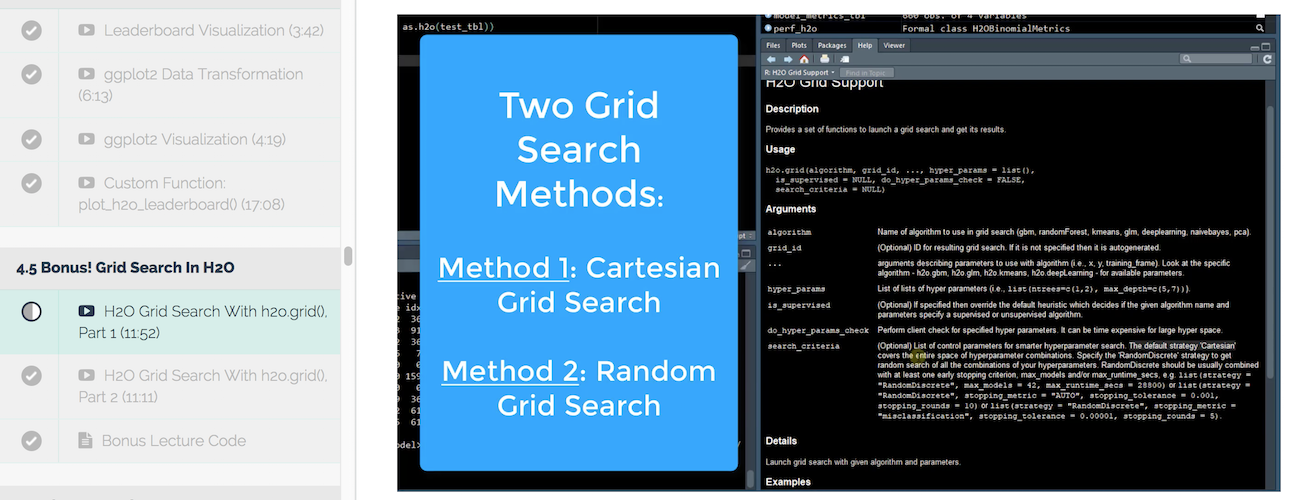
Bonus! Grid Search In H2O
The Grid Search in H2O Bonus continues the model performance discussion from Advanced Concepts! In this module you will learn how to tune a model that was generated from automated machine learning.
Learn the details of extracting a model, analyzing performance metrics, and more!
You Need To Learn R For Business
To be efficient as a data scientist, you need to learn R. Take the course that has cut data science projects in half (see this testimonial from a leading data science consultant) and has progressed data scientists more than anything they have tried before. Over 10-weeks you learn what it has taken data scientists 10-years to learn:
- Our systematic data science for business framework
- R and H2O for Machine Learning
- How to produce Return-On-Investment from data science
- And much more.
Start Learning Today!
Next Up
The next article in the Data Science With R Series covers H2O Model Performance.
Week 6 will cover H2O model performance and communicating performance to different stakeholders. You will learn how to:
- Analyze H2O performance with precision and recall
- Create a performance chart for data scientists
- Create a performance chart for business people
- Create the ultimate model performance dashboard
Week 6: H2O Model Performance
New Course Coming Soon: Build A Shiny Web App!
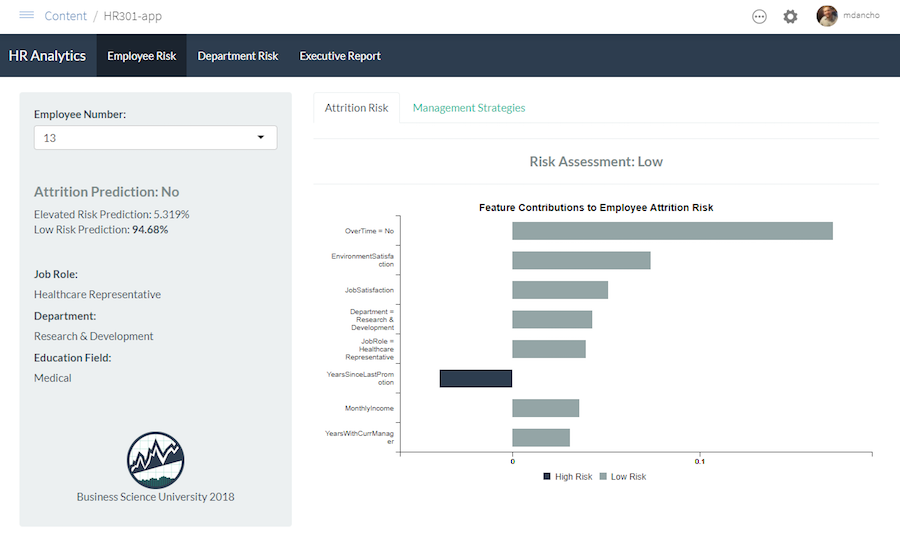
You’re experiencing the magic of creating a high performance employee turnover risk prediction algorithm in DS4B 201-R. Why not put it to good use in an Interactive Web Dashboard?
In our new course, Build A Shiny Web App (DS4B 301-R), you’ll learn how to integrate the H2O model, LIME results, and recommendation algorithm building in the 201 course into an ML-Powered R + Shiny Web App!
Shiny Apps Course Coming in October 2018!!! Sign up for Business Science University Now!
Building an R + Shiny Web App, DS4B 301-R
Get Started Today!