Data Science With R Course Series - Week 1
Written by Matt Dancho
Data Science and Machine Learning in business begins with R. Why? R is the premier language that enables rapid exploration, modeling, and communication in a way that no other programming language can match: SPEED! This is why you need to learn R. Time is money, and, in a world where you are measured on productivity and skill, R is your best friend.
In this Data Science With R Series, we’ll cover what life is like in our ground-breaking, enterprise-grade course called Data Science For Business With R (DS4B 201-R). The objective is to experience the qualities that make R great for business by following a real-world data science project. We review the course that will take you to advanced in 10 weeks.
We want you to experience what our students are saying is the best online course they have ever taken!
Data Science With R Course Series
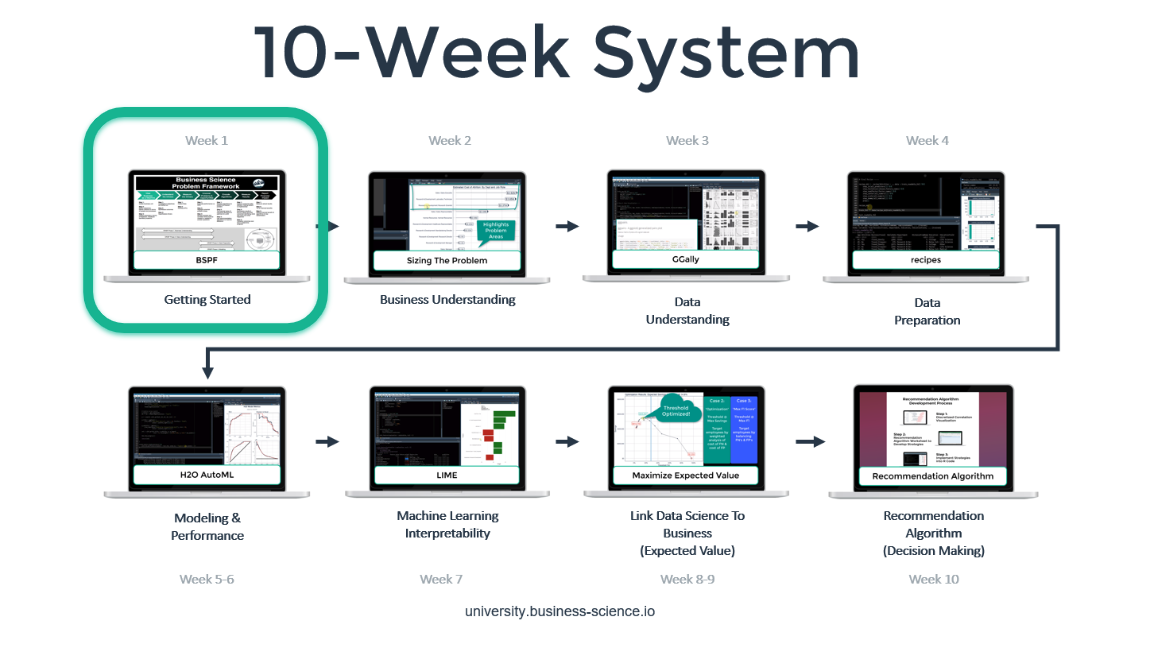
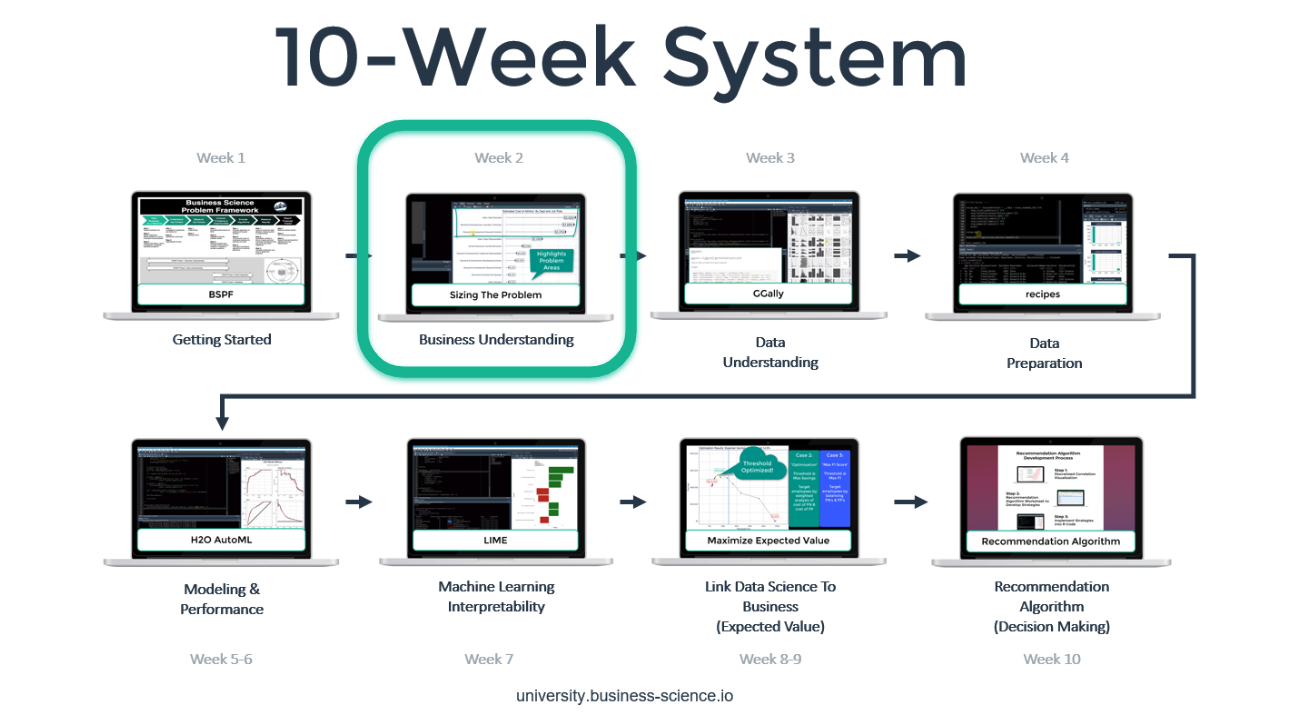
You’re in Week 1: Getting Started, and here’s our game-plan over the next 10 articles in this series. We’ll cover how to apply data science for business with R following our systematic process.
Week 1: Getting Started
About The Course
Data Science For Business With R (DS4B 201-R) is a one-of-a-kind course designed to teach you the essential aspects for applying data science to a business problem with R. Here’s why it’s unique and why our students consistently rate it 9 of 10 for satisfaction:
-
The course is based on real-world experience applying data science as a consultant and within organizations
-
We provide our systematic framework for solving business problems with data science. This cuts project times in half. Refer to this testimonial from our student.
-
We focus on the pursuit of return on investment (ROI) with data science, the single most important metric that organizations care about.
-
We cover high performance R packages including H2O, LIME, tidyverse, recipes, and more.
DS4B 201-R, Course Trailer
Week 1: Getting Started
Week 1 is designed to get you the necessary knowledge before you jump into coding so you become a ginsu knife able to slice-and-dice problems. As such, week 1 is almost entirely designed to provide you information on the:
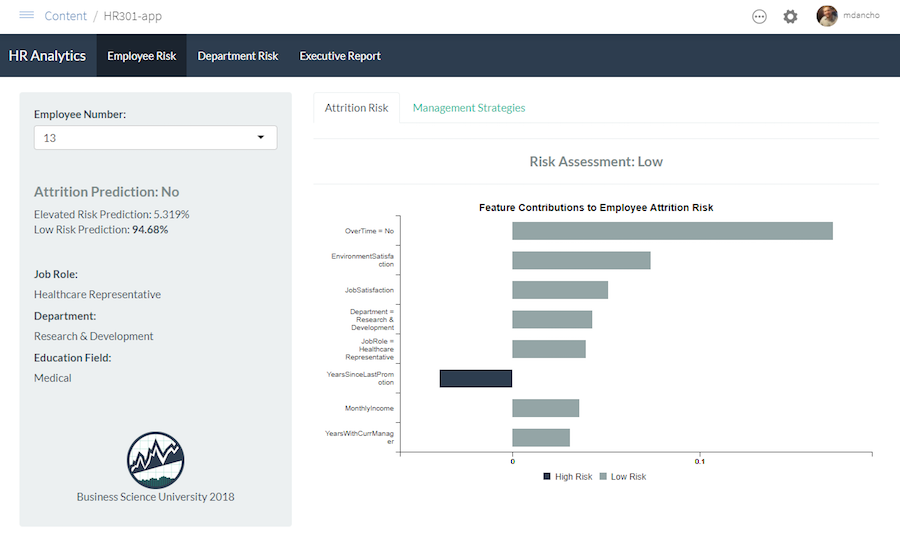
The first thing you’ll do is log into the DS4B 201-R Course through Business Science University. The application looks like this.
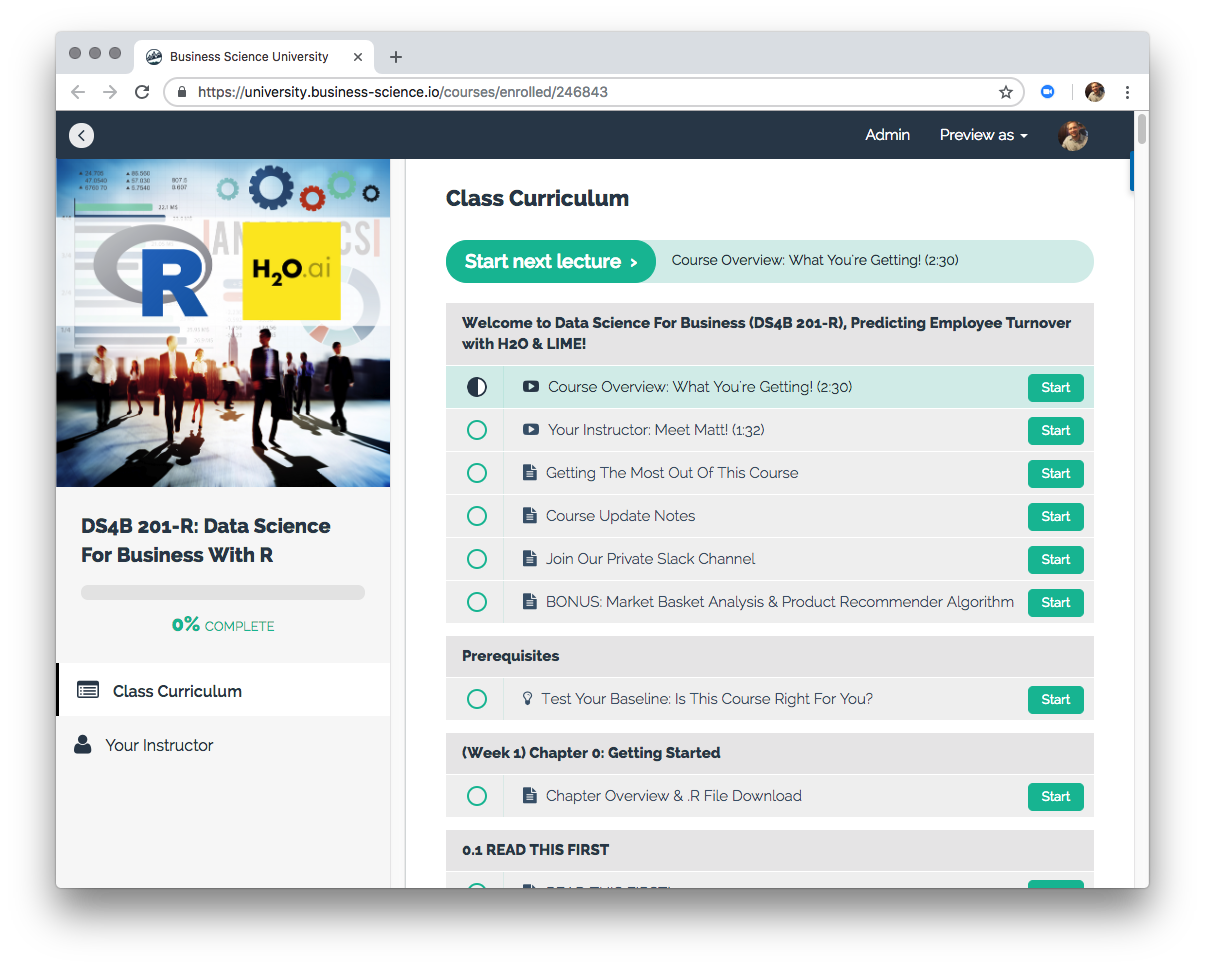
Inside The Course Application
After you check out the awesome introductory content including the Private Slack Channel and the BONUS: Market Basket Analysis and Product Recommender Algorithm Tutorial, it’s time to move into the Week 1 materials.
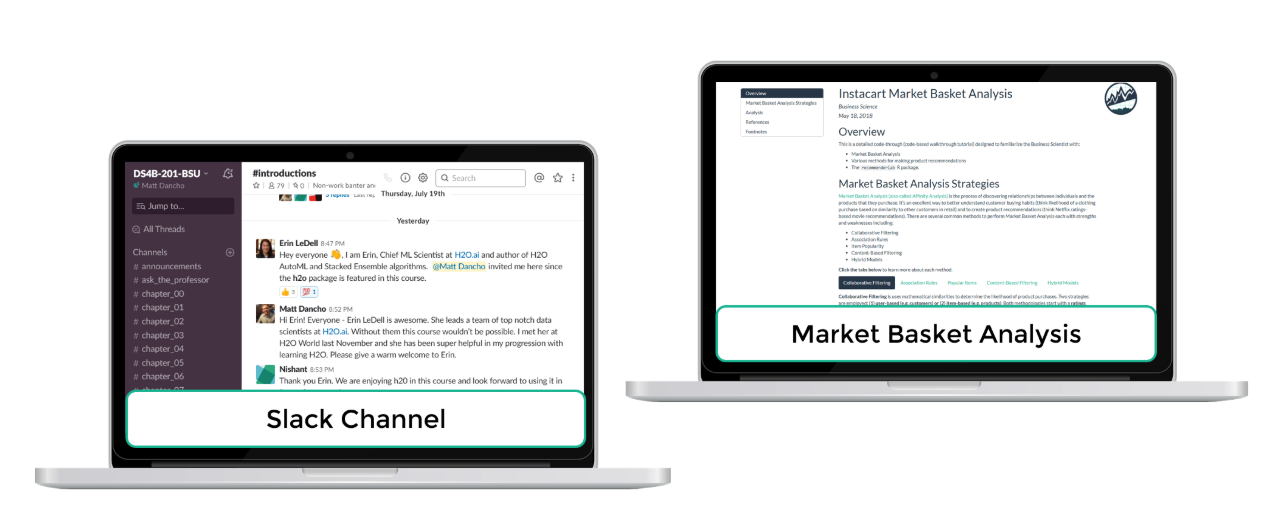
Bonus Tutorial and Private Slack Community!
Business Problem
We’re focused on a $15 MILLION DOLLAR PROBLEM: EMPLOYEE TURNOVER. This is a problem that affects thousands of organizations, and it’s extremely costly. Worse, it almost always goes unnoticed because it’s indirect. Employee turnover (attrition) affects productivity, which is not an accounting expense. We teach you:
-
What happens when employees leave an organization, and how it affects productivity
-
How to calculate the TRUE COST OF ATTRITION
-
How to use an Excel Calculator to quickly communicate estimated costs to executives
You’ll learn from an expert on the business problem via self-paced lectures.
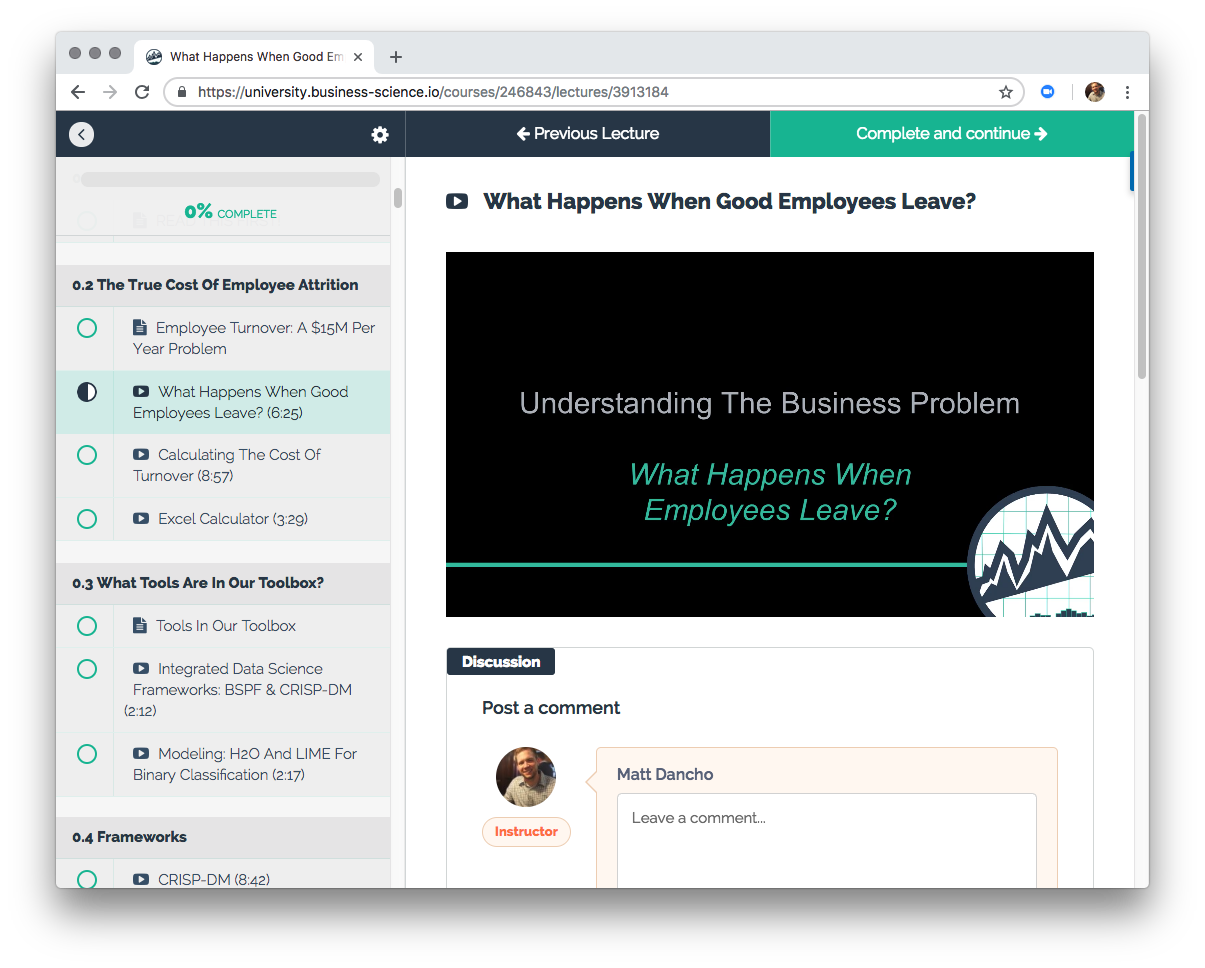
Understanding the Business Problem
You’ll get the Excel Calculator to expose others in your organization to the cost of employee attrition.
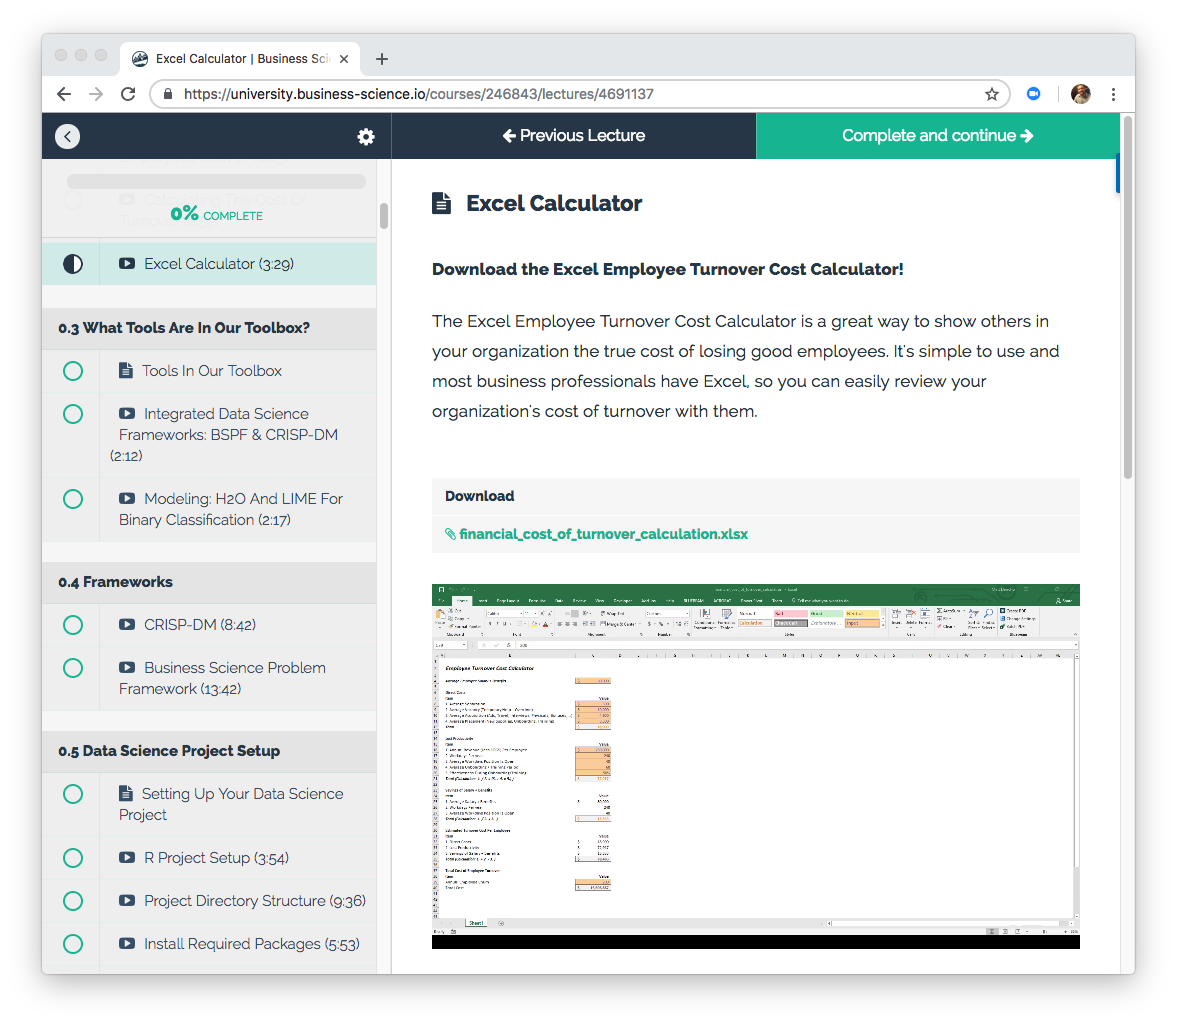
Excel Turnover Cost Calculator
Once you fully understand the problem, it’s time to investigate tools that will empower us in our pursuit of data science ROI!
Tools In Our Toolbox
Now it’s time to learn about two groups of amazing tools that we have at our disposal to solve the problem:
-
Integrated Data Science Frameworks: The Business Science Problem Framework and the CRISP-DM, which are integrated.
-
H2O and LIME: Machine Learning packages that enable both high performance predictive analytics and high explainability of machine learning models. Perfect for business problems!
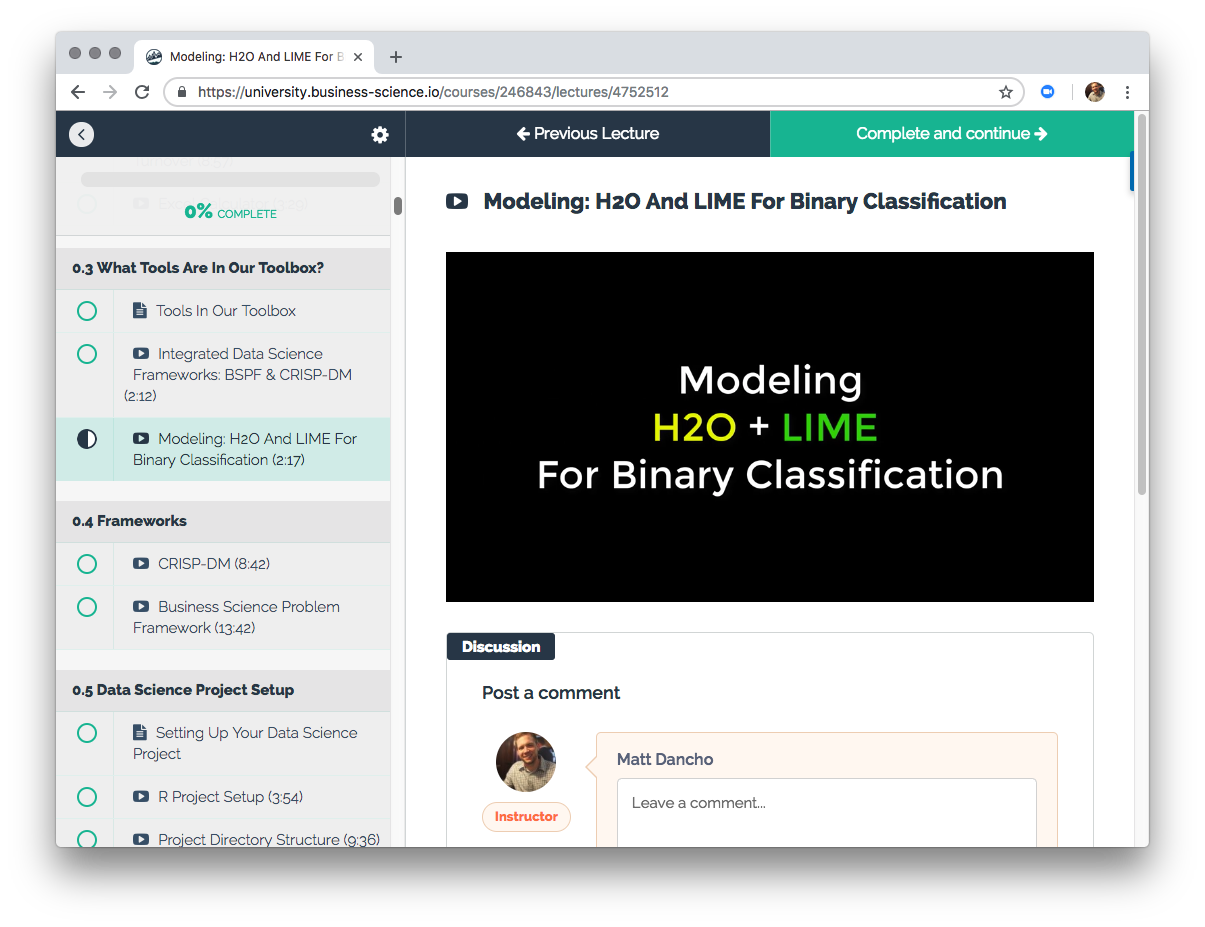
H2O and LIME: Tools In Our Toolbox
Once you get a sense for what tools are coming, it’s now time to learn about the first set of tools - the integrated data science frameworks.
Frameworks: Systems For Success
Frameworks are essential in business. Benefits of having frameworks:
- Instill confidence from management
- Communicate a clear plan
- Keep everyone on task
- Answer the question: “Why is it impossible to perform a data science project in 1 week?”
You’ll learn about two integrated data science frameworks that are built upon our experience and industry-leading performance:
-
CRISP-DM: Cross Industry Standard Procedure for Data Mining
-
BSPF: Business Science Problem Framework
These two frameworks create the foundation for every step in the subsequent weeks. We follow the BSPF + CRISP-DM every step of the way as you solve this data science project!
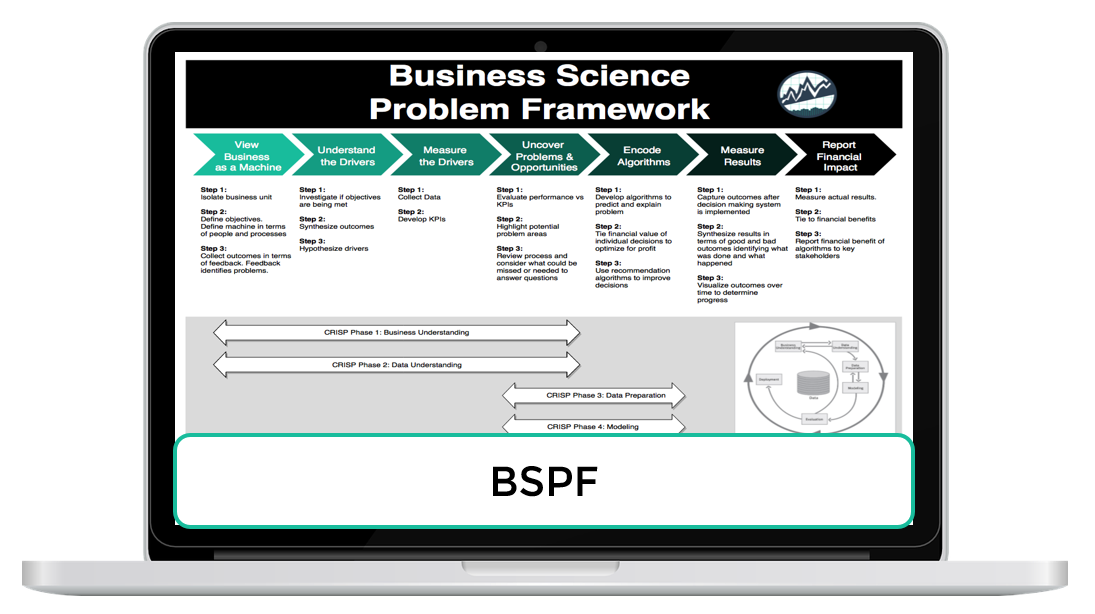
Follow The BSPF Process Step-By-Step Throughout The Project
Now that you have a general idea of how the frameworks work, we’re almost ready to get started. The last step is setting up the data science project.
Data Science Project Setup
We’ll go through the process of setting up your data science project by:
-
Creating an R Project in the RStudio IDE (Integrated Development Environment)
-
Programmatically creating the directory structure with the fs package
-
Install the required R Packages (see video sample below)
-
Download the data for modeling turnover
Check out the “Installing Required Packages” sample lecture that explains the R packages you’ll be using throughout the course!
Sample Lecture, Installing Required Packages, Week 1
Start Learning Today
You’ve just experienced Week 1 in the course that is changing the way data science is done in business. Now it’s time to get started.
Next Up
In the next post in the Data Science With R Series we’ll head to Week 2 where we cover Business Understanding. This begins our transition into code for Weeks 2 to 10!
Week 2: Business Understanding, Coming Next
New Course Coming Soon: Build A Shiny Web App!
You’re experiencing the magic of creating a high performance employee turnover risk prediction algorithm in DS4B 201-R. Why not put it to good use in an Interactive Web Dashboard?
In our new course, Build A Shiny Web App (DS4B 301-R), you’ll learn how to integrate the H2O model, LIME results, and recommendation algorithm building in the 201 course into an ML-Powered R + Shiny Web App!
Shiny Apps Coming in October 2018!!! Sign up for Business Science University Now!
Building an R + Shiny Web App, DS4B 301-R