Data Science With R Course Series - Week 2
Written by Matt Dancho
Data Science and Machine Learning in business begins with R. Why? R is the premier language that enables rapid exploration, modeling, and communication in a way that no other programming language can match: SPEED! This is why you need to learn R. Time is money, and, in a world where you are measured on productivity and skill, R is your machine-learning powered productivity booster.
In this Data Science With R Course Series, we’ll cover what life is like in our ground-breaking, enterprise-grade course called Data Science For Business With R (DS4B 201-R). The objective is to experience the qualities that make R great for business by following a real-world data science project. We review the course that will take you to advanced in 10 weeks.
In this article, we’ll cover Week 2: Business Understanding, which is where we begin coding in R using exploratory techniques with the goal of sizing the business problem.
But, first, a quick recap of our trajectory and the course overview.
Data Science With R Course Series
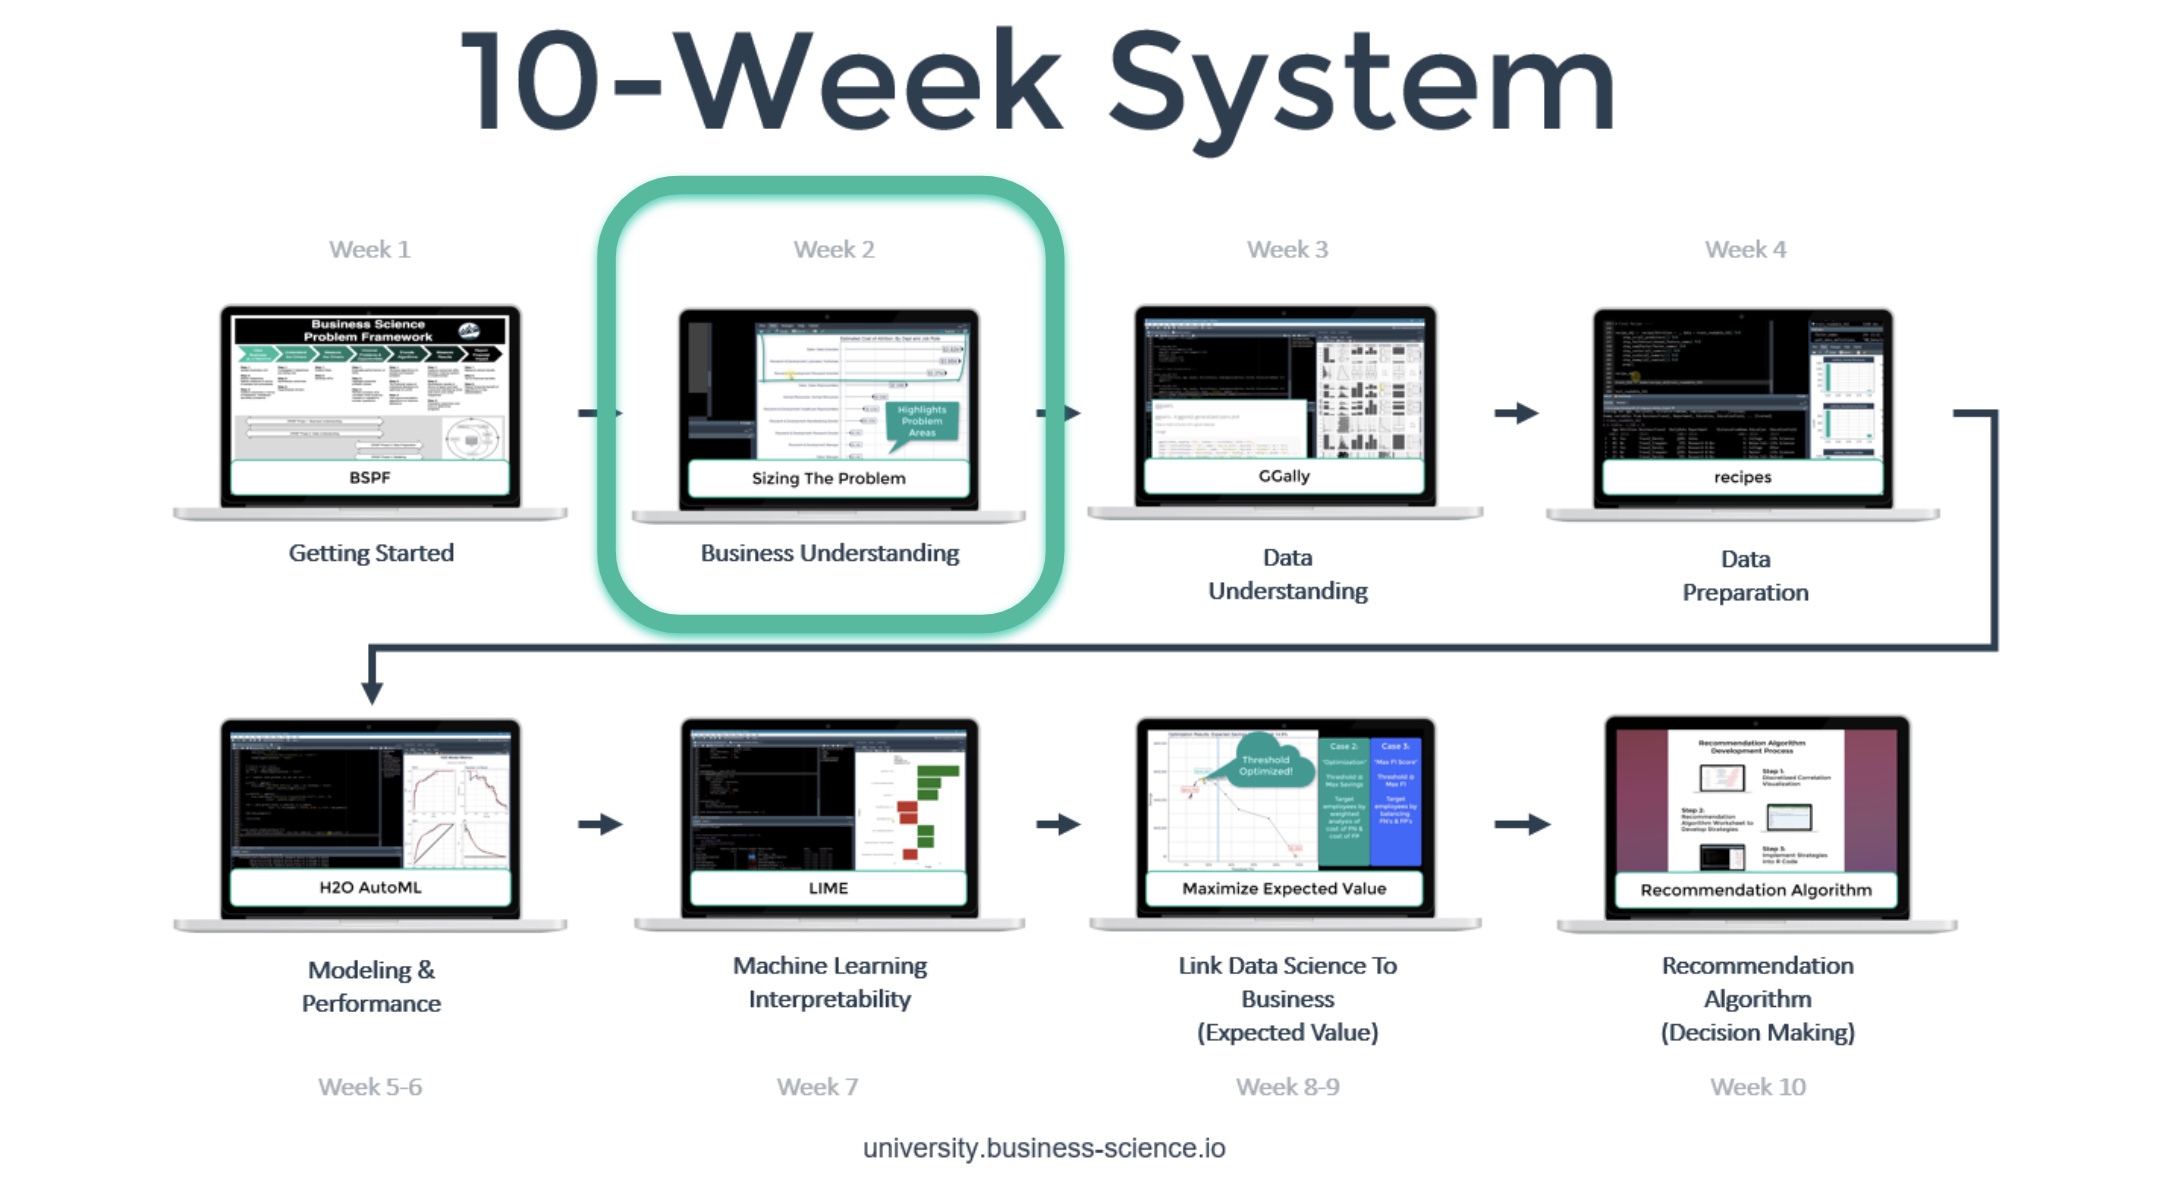
You’re in the Week 2: Business Understanding. Here’s our game-plan over the next 10 articles in this series. We’ll cover how to apply data science for business with R following our systematic process.
Week 2: Business Understanding
Course and Problem Overview
Data Science For Business With R (DS4B 201-R) is a one-of-a-kind course designed to teach you the essential aspects for applying data science to a business problem with R.
We analyze a single problem: Employee Turnover, which is a $15M per year problem to an organization that loses 200 high performing employees per year. It’s designed to teach you techniques that can be applied to any binary classification (Yes/No) problem such as:
-
Predicting Employee Turnover: Will the employee leave?
-
Predicting Customer Churn: Will the customer leave?
-
Predicting Risk of Credit Default: Will the loan applicant or company default?
Here’s why our students consistently give it a 9 of 10 for satisfaction rating:
-
It’s based on real-world experience
-
You apply our systematic framework that cuts project times in half. Refer to this testimonial from our student.
-
We focus on return on investment (ROI)
-
We cover high performance R packages: H2O, LIME, tidyverse, recipes, and more.
-
You get results!
DS4B 201-R, Course Overview
Next, let’s experience what life is like in Week 2: Business Understanding.
Week 2: Business Understanding
Week 2 is where we begin our deep-dive into data science for business. In Business Understanding, we learn how to:
The first thing you’ll do is log into Business Science University, and move to the Week 2 Module, which looks like this.
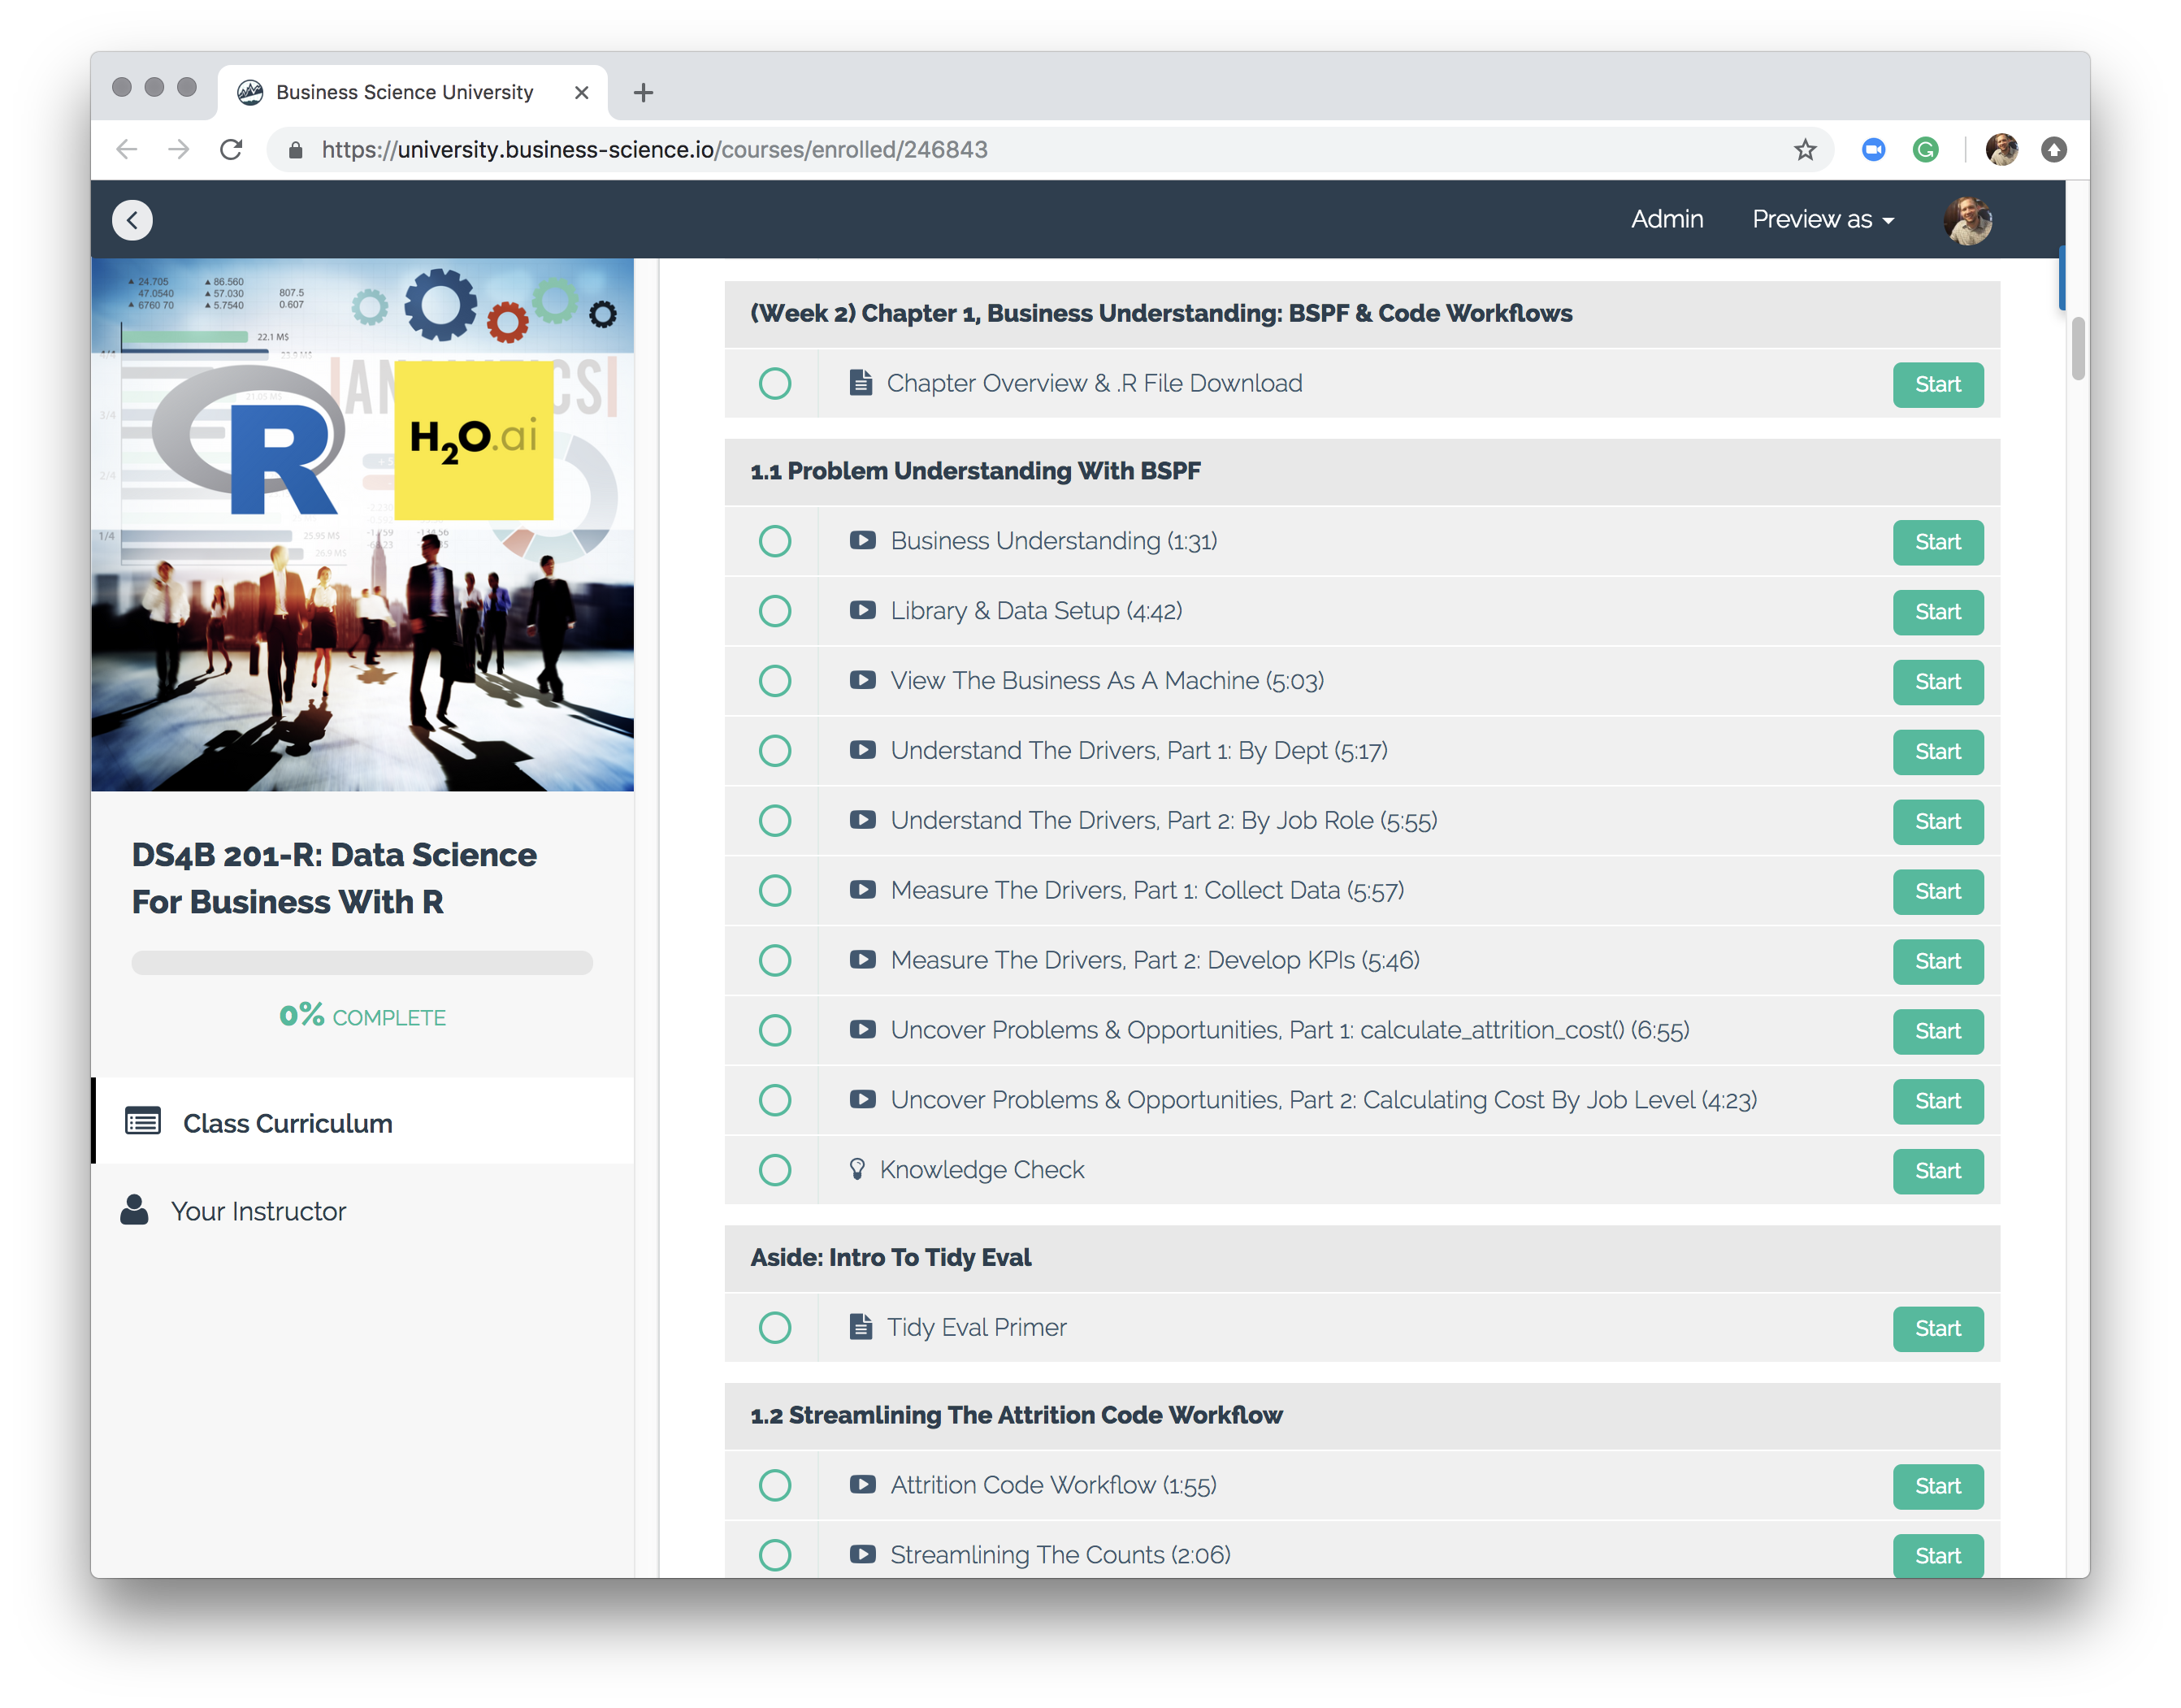
Week 2: Business Understanding Module, DS4B 201-R Course
We’ll begin by analyzing the problem in R in the section titled, Problem Understanding with the BSPF.
Understand the problem using R Code and BSPF
Sizing the business opportunity or cost is OVERLOOKED by most data scientists. If the cost / benefit to the organization is not large, it’s not worth your time. We need to be efficient, which is our second focus. ROI is first, efficiency is second.
If the cost / benefit to the organization is not large, it’s not worth your time.
To size the problem, we lean on a tool we learned about in Week 1: The Business Science Problem Framework (BSPF). Specifically, you’ll learn to:
- View the business as a machine
- Understand the drivers
- Measure the drivers
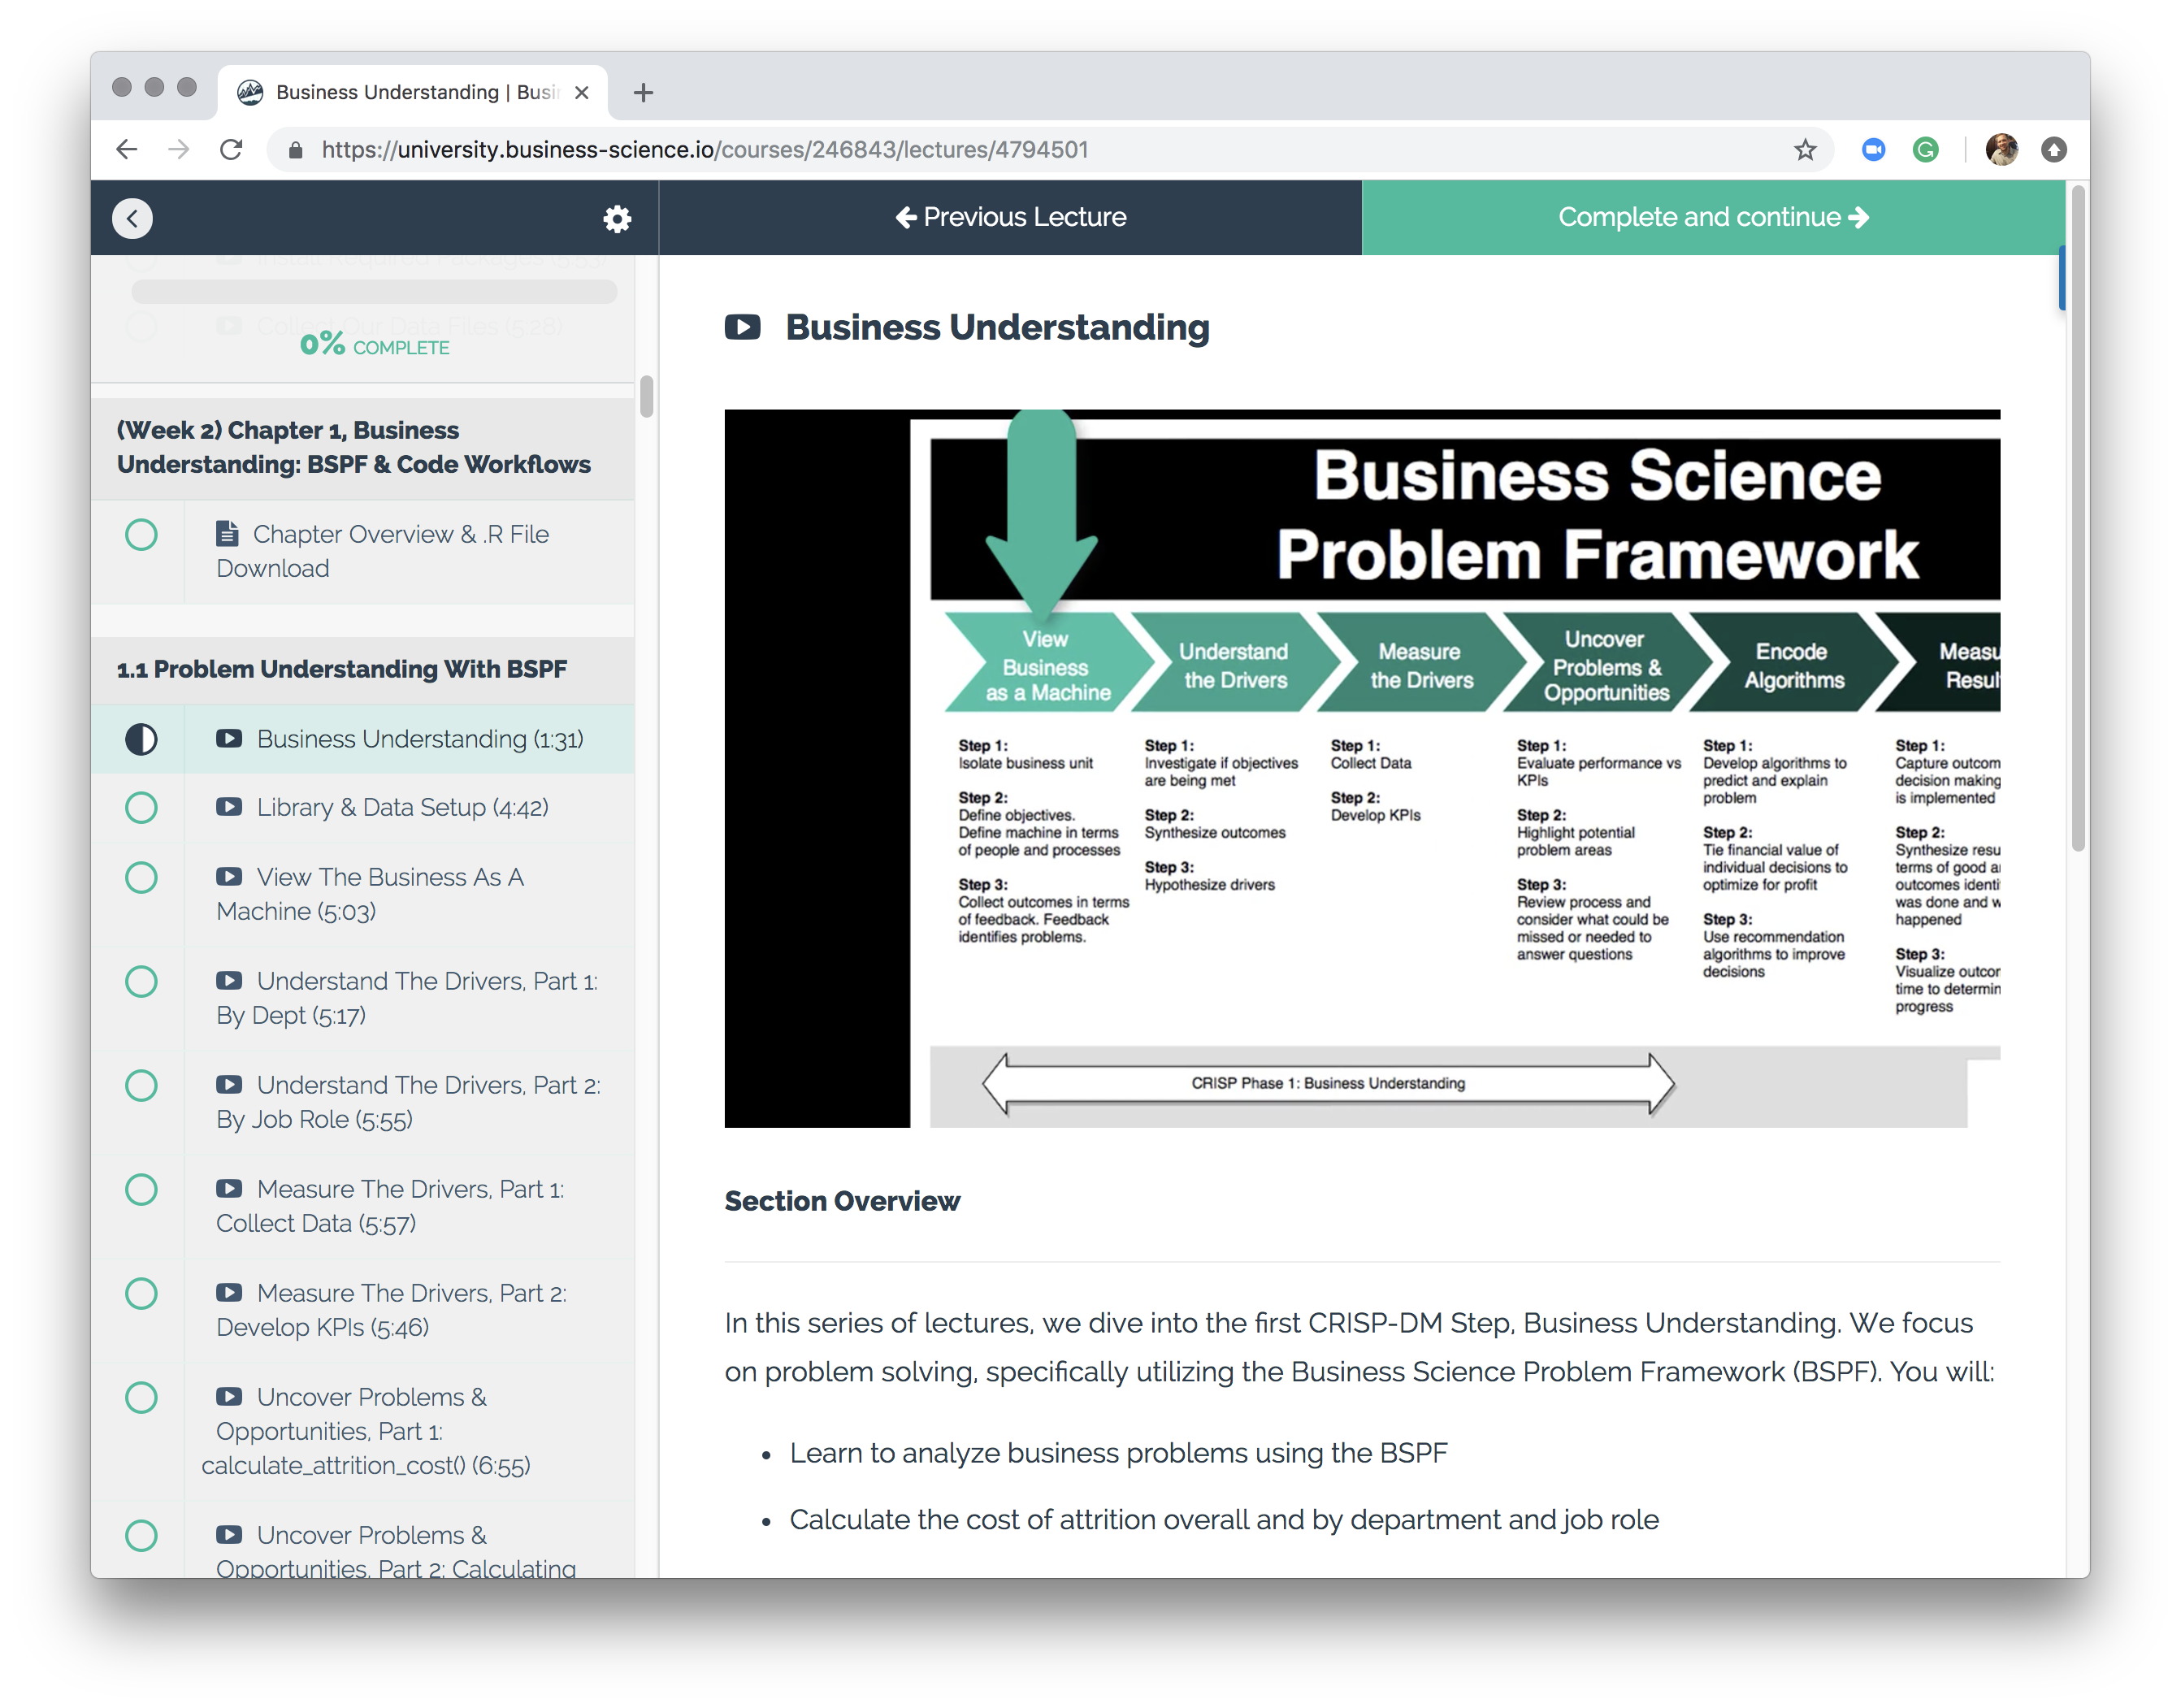
Walking Through The Business Science Problem Framework (BSPF)
As we walk through the BSPF, we focus our efforts on identifying (1) if the organization has a problem and (2) how large that problem is. We investigate:
-
How many high performance employees are turning over
-
What the true cost of their turnover is, converting the Excel calculation to a scalable R calculation
-
Key Performance Indicators (KPIs) for turnover
-
Potential drivers including common cohorts: Job Department and Job Role
Here’s a sample lecture showing what the code experience is like: “View the Business as a Machine”.
View the Business As A Machine Lecture
As we go through the process of understanding and sizing the business problem, we realize that we are performing the same calculations repetitively. Any time repetitious code happens, we should create a function. Next, we’ll learn about a powerful new set of tools for building tidy-functions that reduces and simplifies repetitive code: Tidy Eval.
Streamline repetitive employee attrition code using Tidy Eval
To this point you’ve sized the problem and even determined that the problem is larger within certain cohorts within the organization. Through this exploratory process, you’ve repeated the same code multiple times. Now it’s time to streamline this code workflow with a powerful set of tools called Tidy Eval.
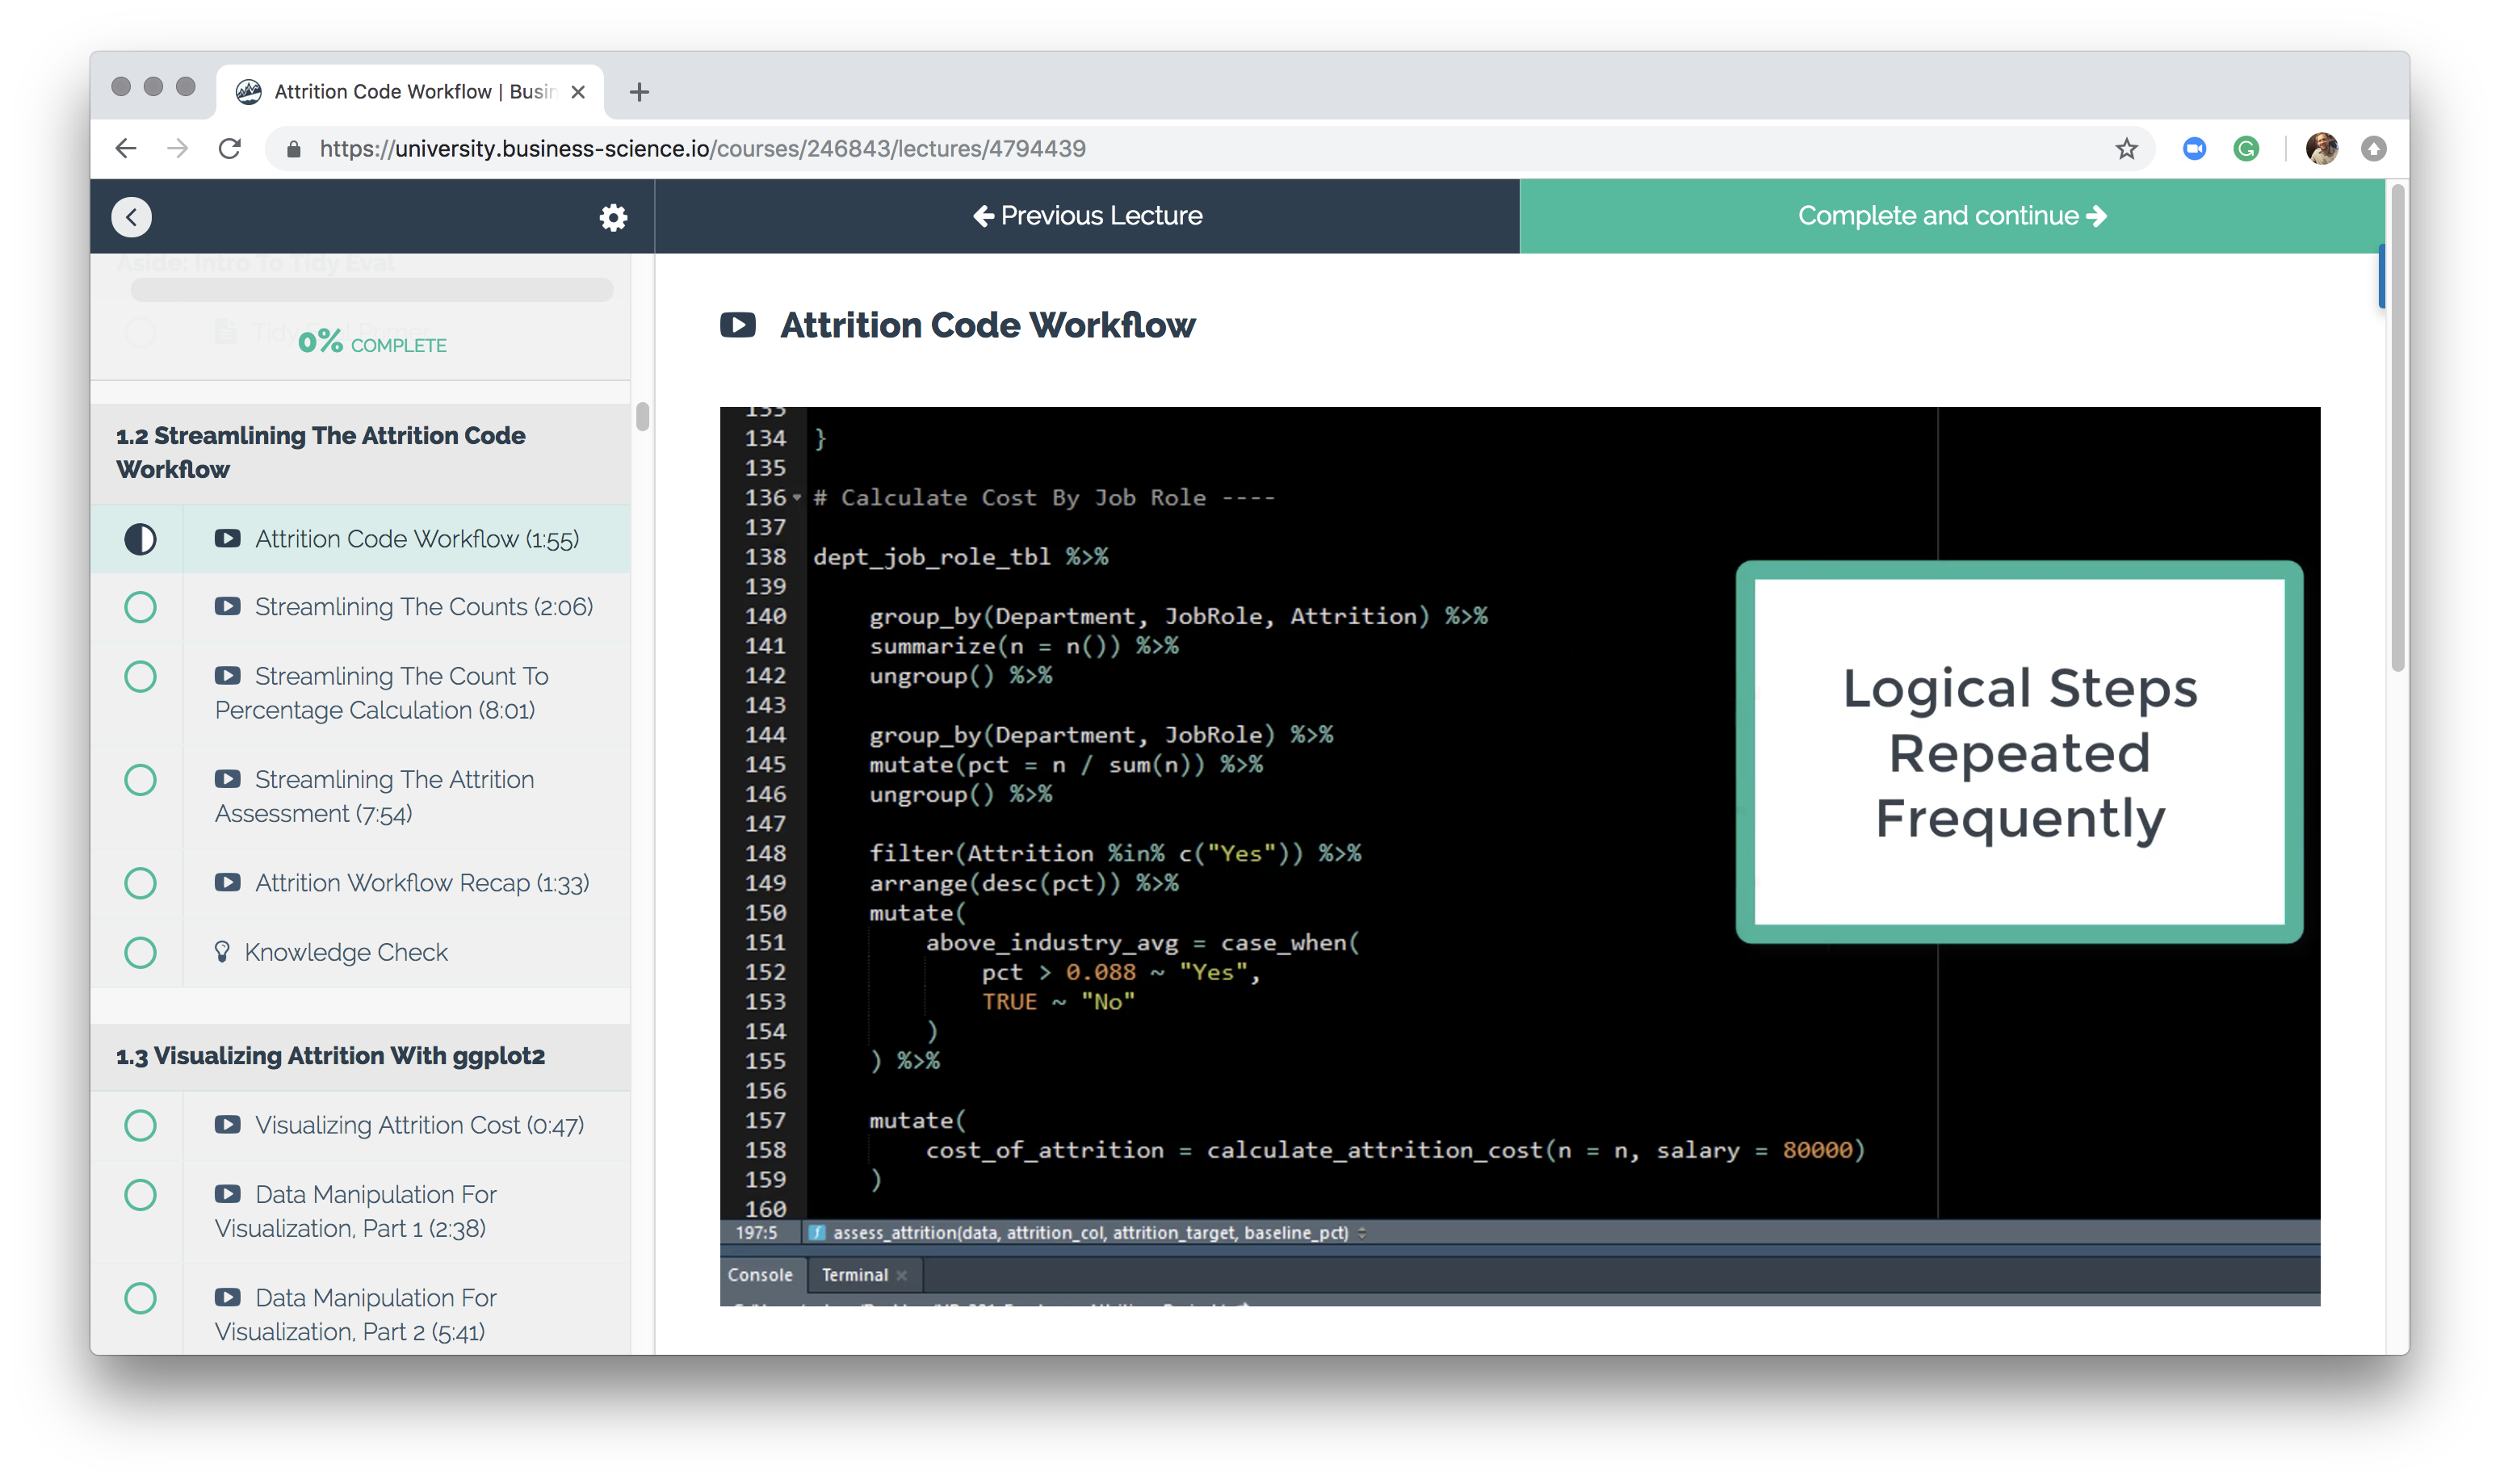
Learning Tidy Eval To Simplify Code Steps Repeated Frequently
You will use or create several functions that implement Tidy Eval and rlang including:
count: Summarizes the counts of grouped columns. Implemented in dplyrcount_to_pct: Converts counts to percentages (proportions). You create.assess_attrition(): Filters, arranges, and compares attrition rates to KPIs. You create.
Armed with this streamlined code workflow, it’s now time to visualize the problem using the ggplot2 library.
Visualize employee turnover with ggplot2
The best way to grab an executive decision maker’s attention is to show him or her a business-themed plot that conveys the problem. In this section, we cover exactly how to do so using the ggplot2 package.
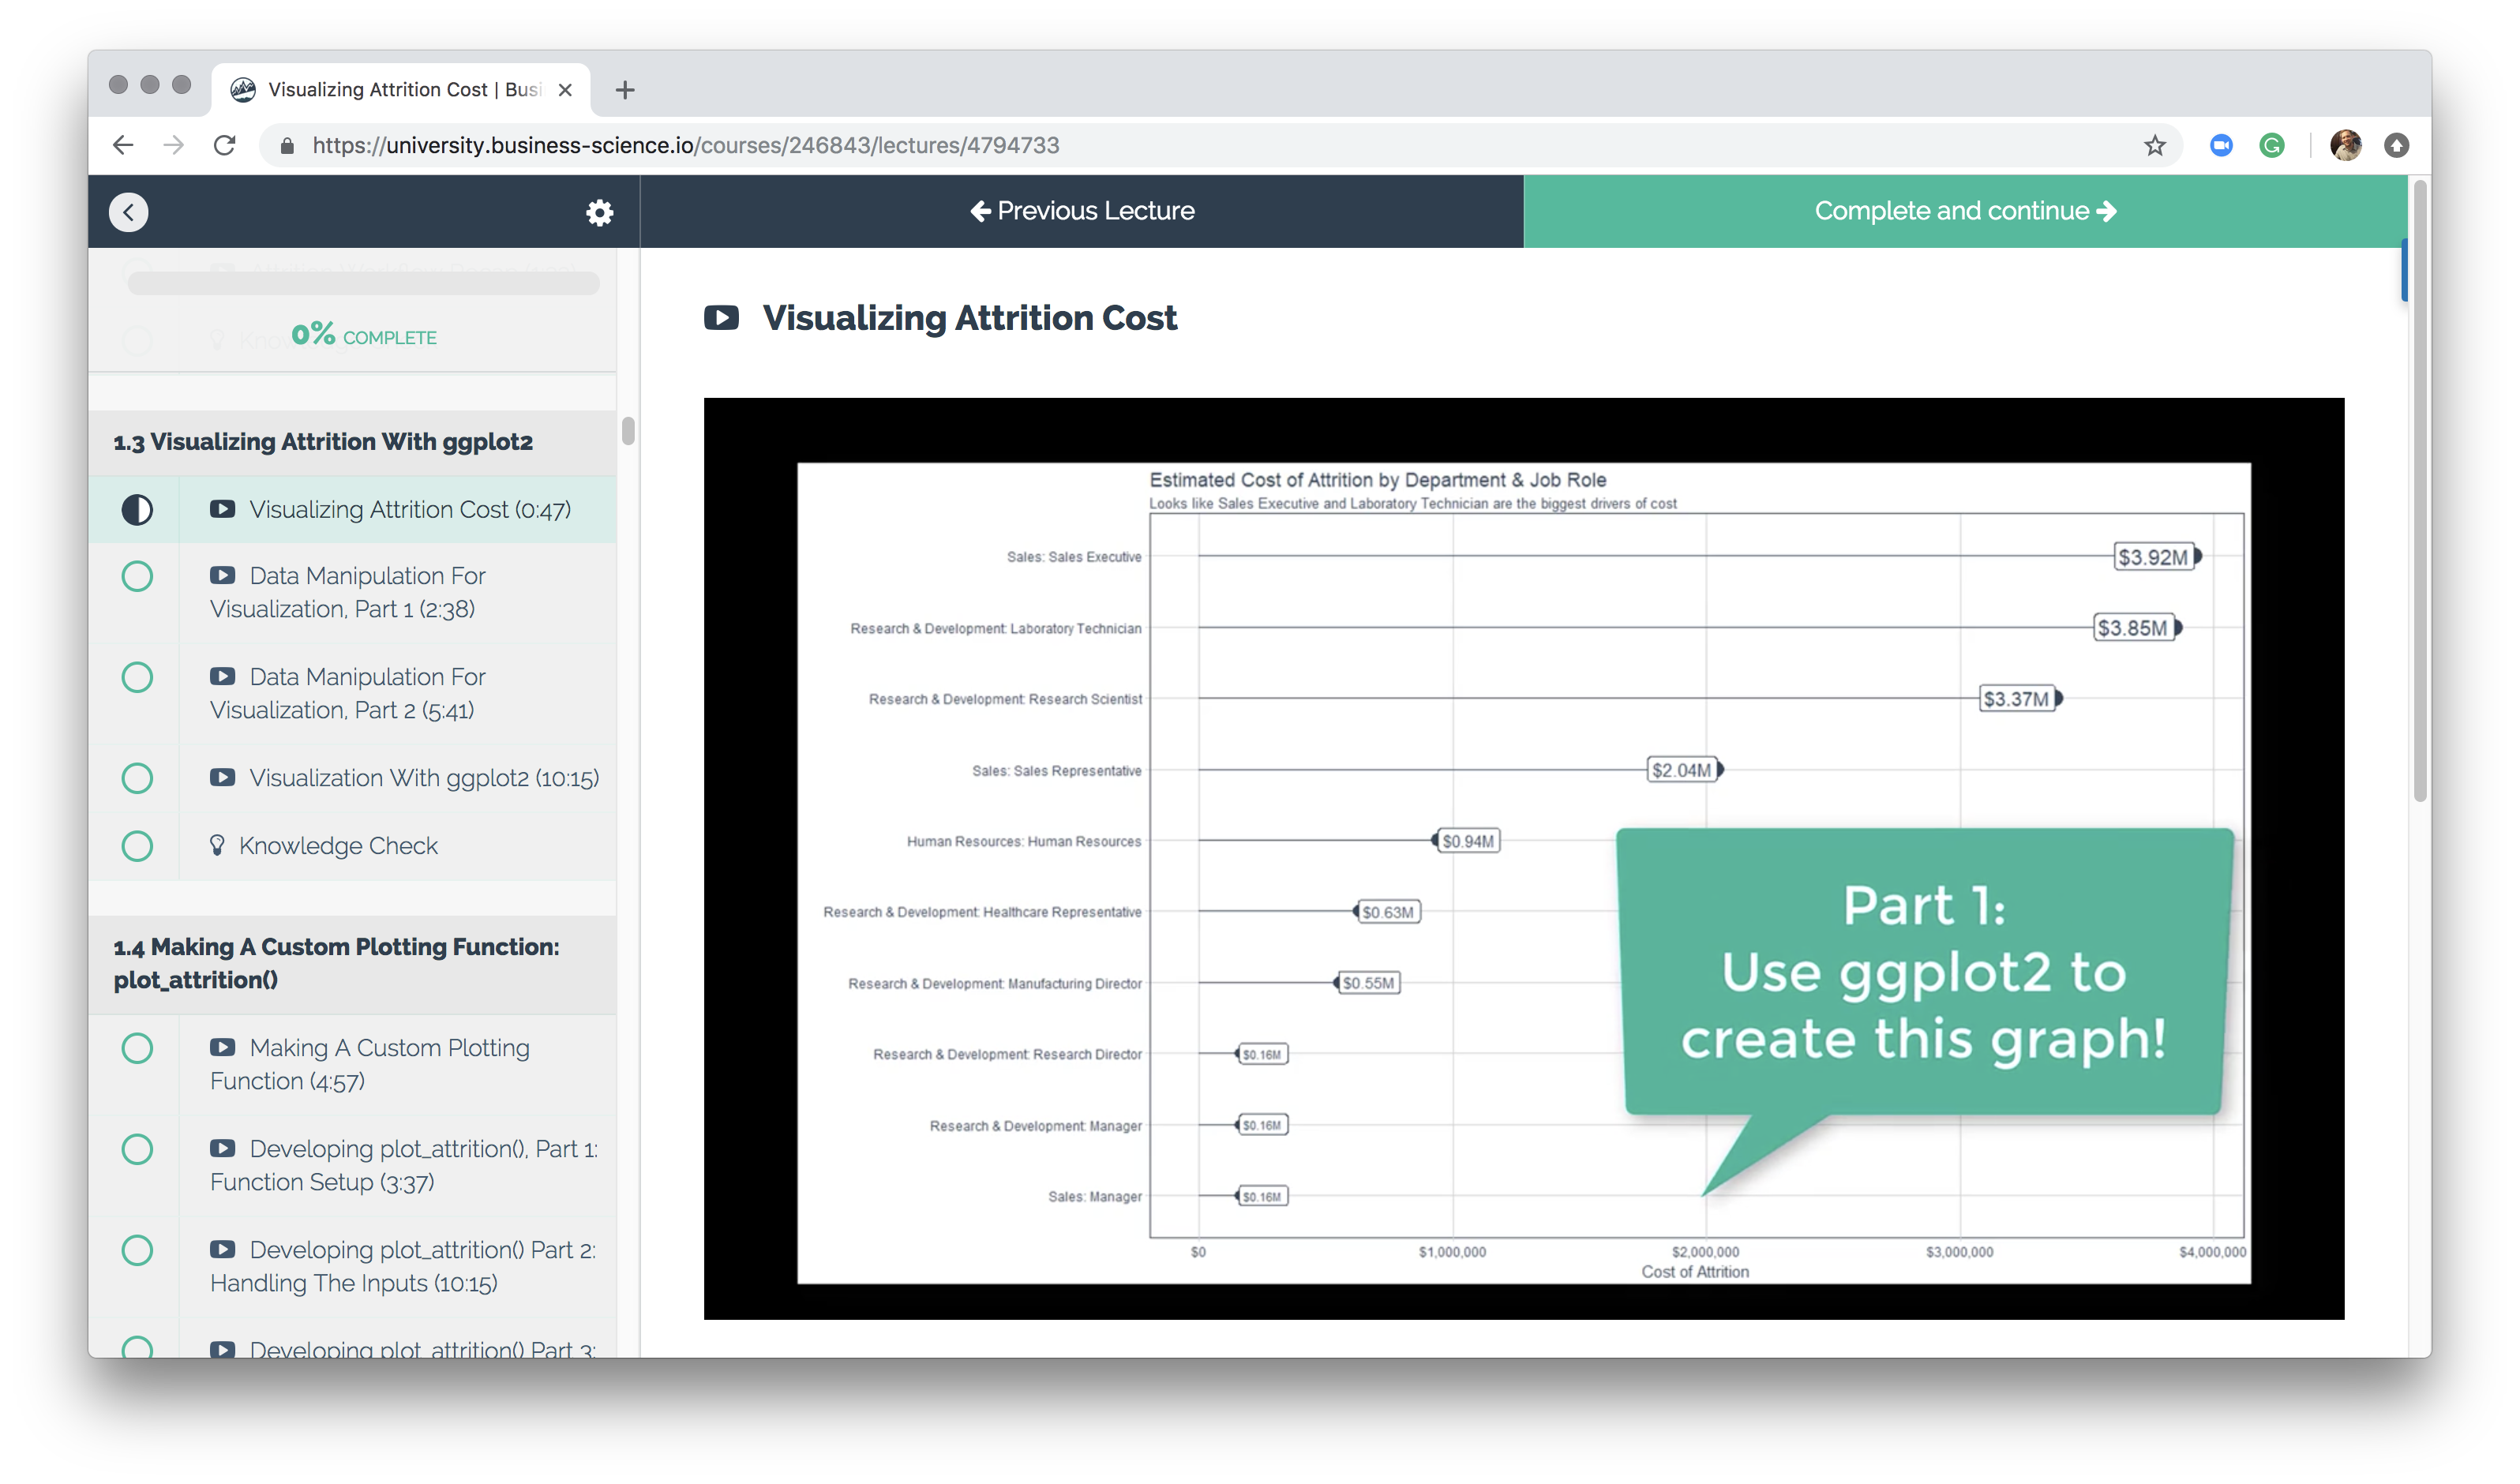
Using ggplot2 to create an impactful visualization of the problem
Next, you learn how to create a plotting function that can flexibly handle various grouped data within your code workflow.
Make our first custom plotting function, plot_attrition()
Once again, we’re repetitively reusing code to plot different variations of the same information. In this section, we teach you how to create a custom plotting function called plot_attrition() that flexibly handles grouped features including the employee’s Department and Job Role.
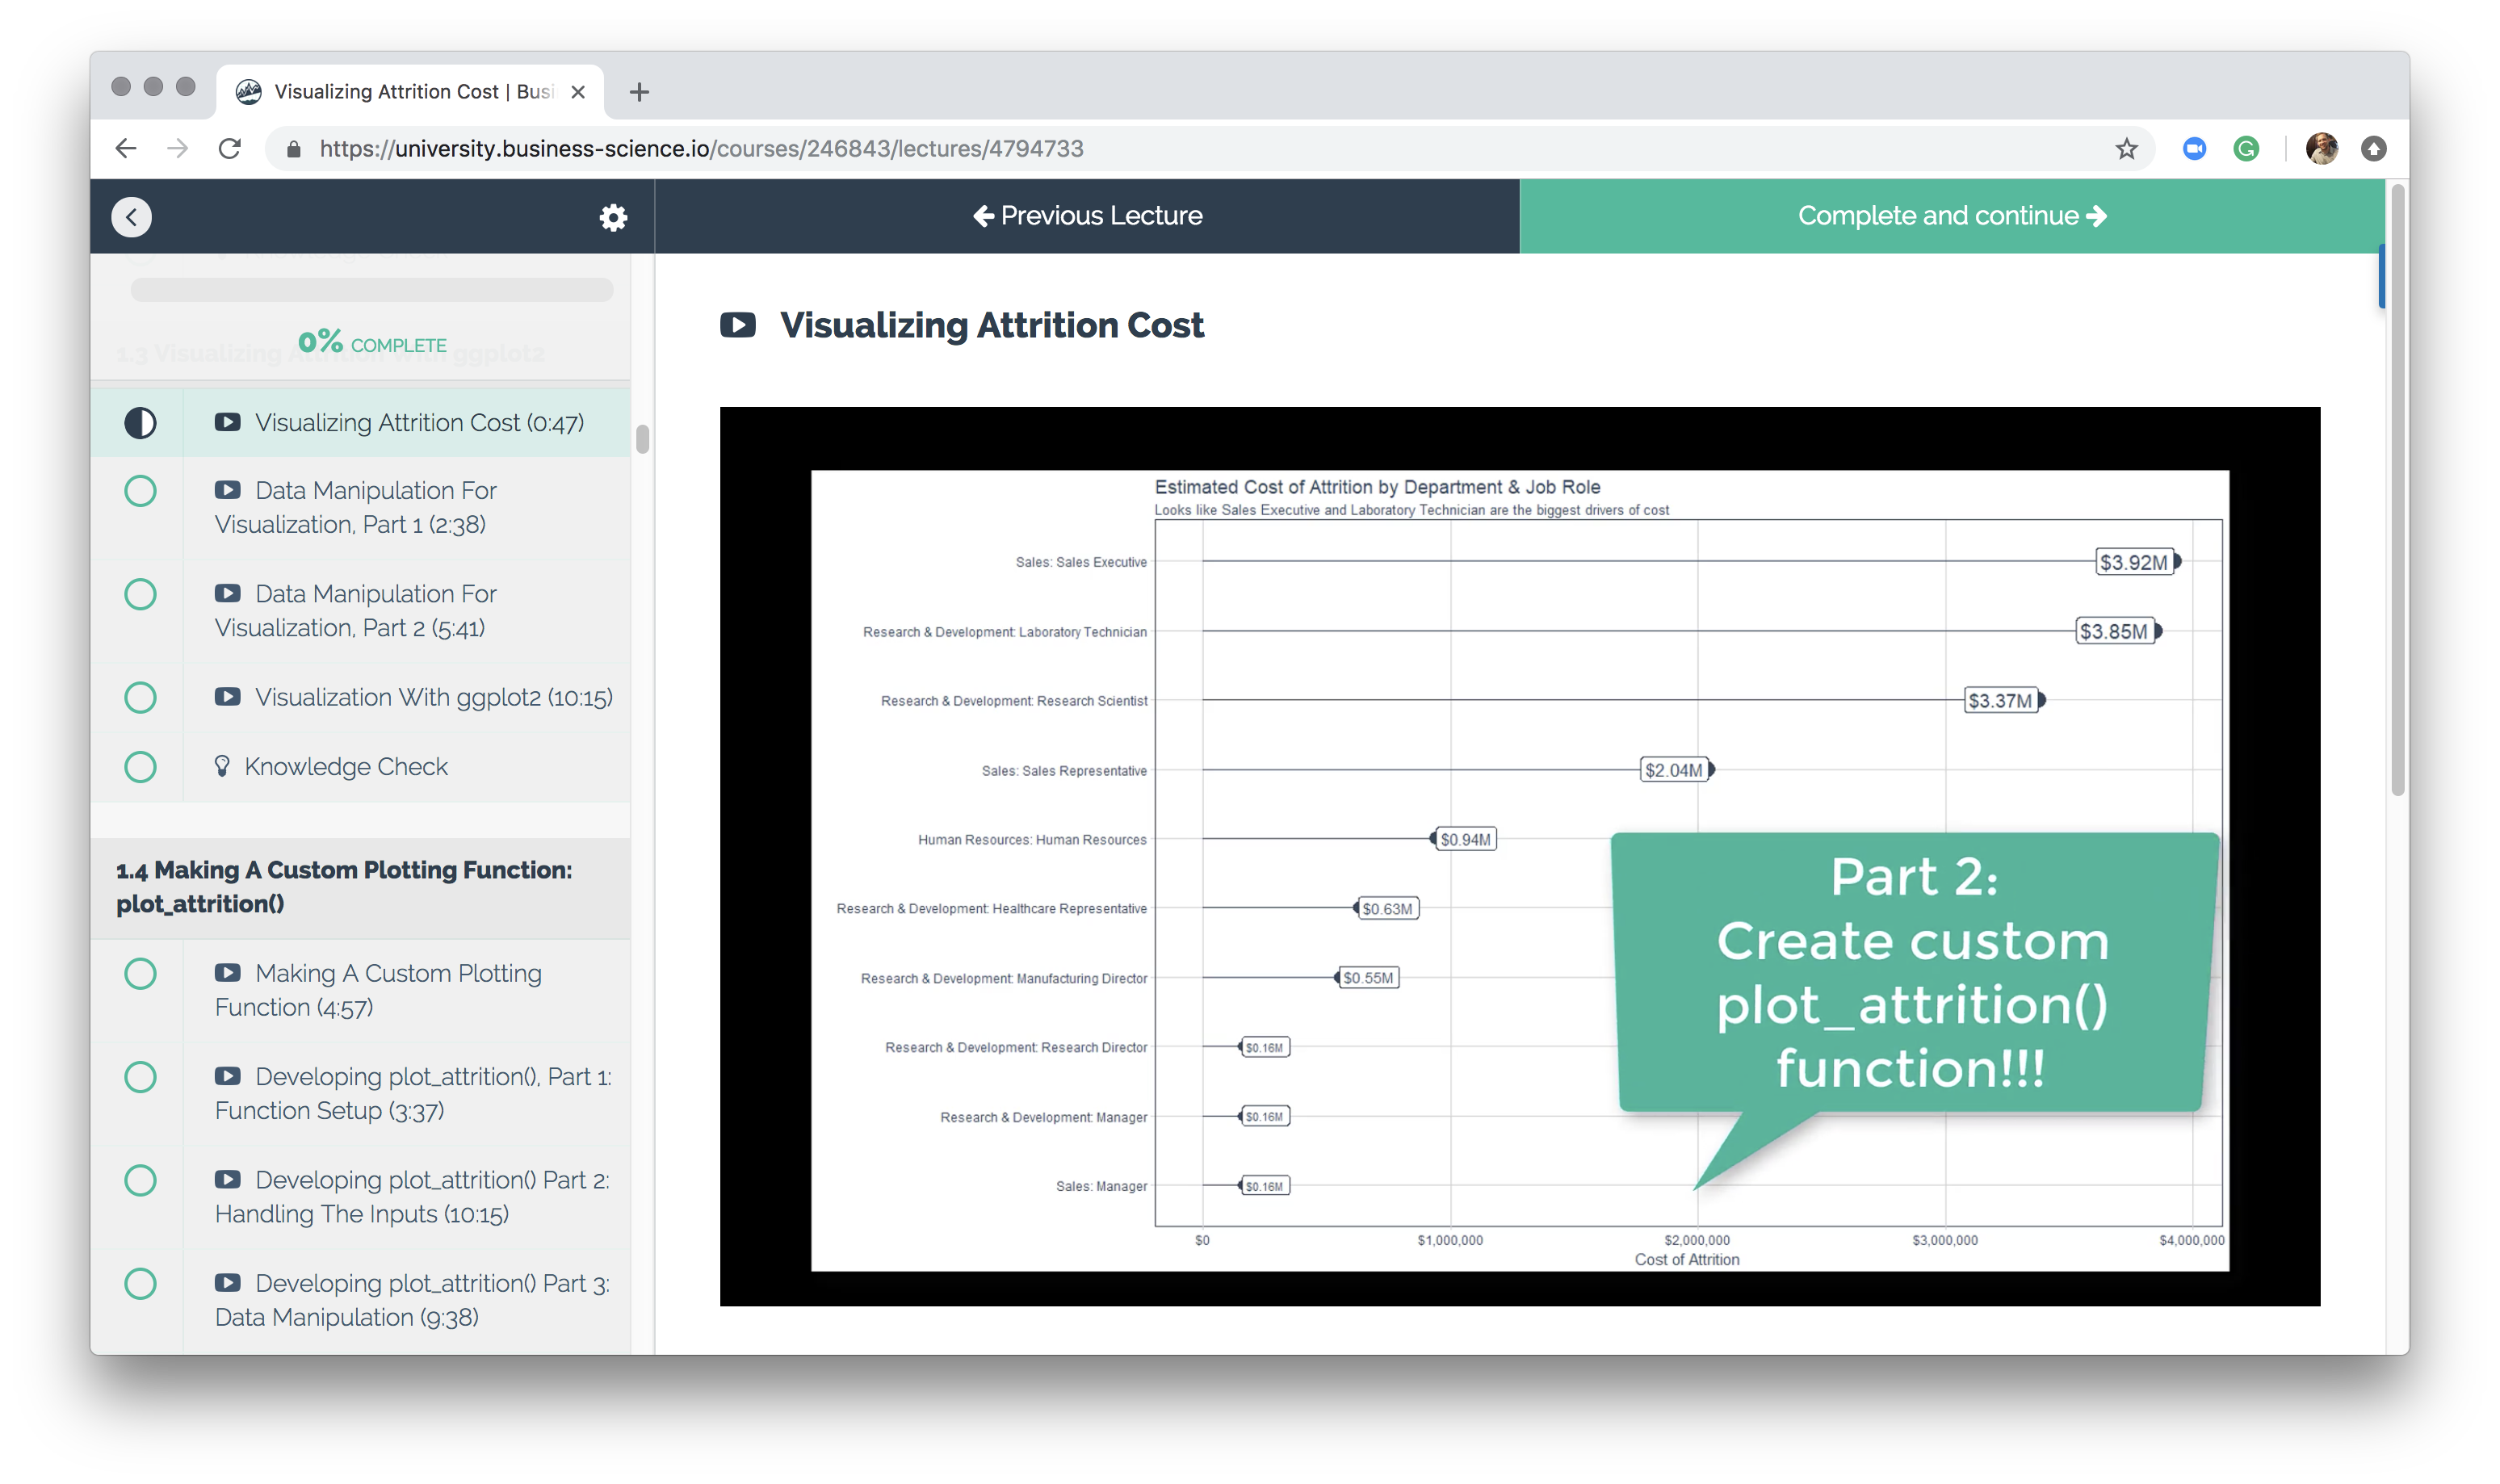
Create a flexible plotting function, plot_attrition()
By now, you have a serious set of dplyr and ggplot2 investigative skills. Next, we put them to use with your first challenge!
Challenge #1
Your first challenge is something that happens in the real world - your Subject Matter Experts (SMEs) - in this case the Accounting and Human Resources department provided you new data at a more granular level, which will make your analysis more accurate. Your job is to integrate the new information into you analysis. Are you up to the challenge?
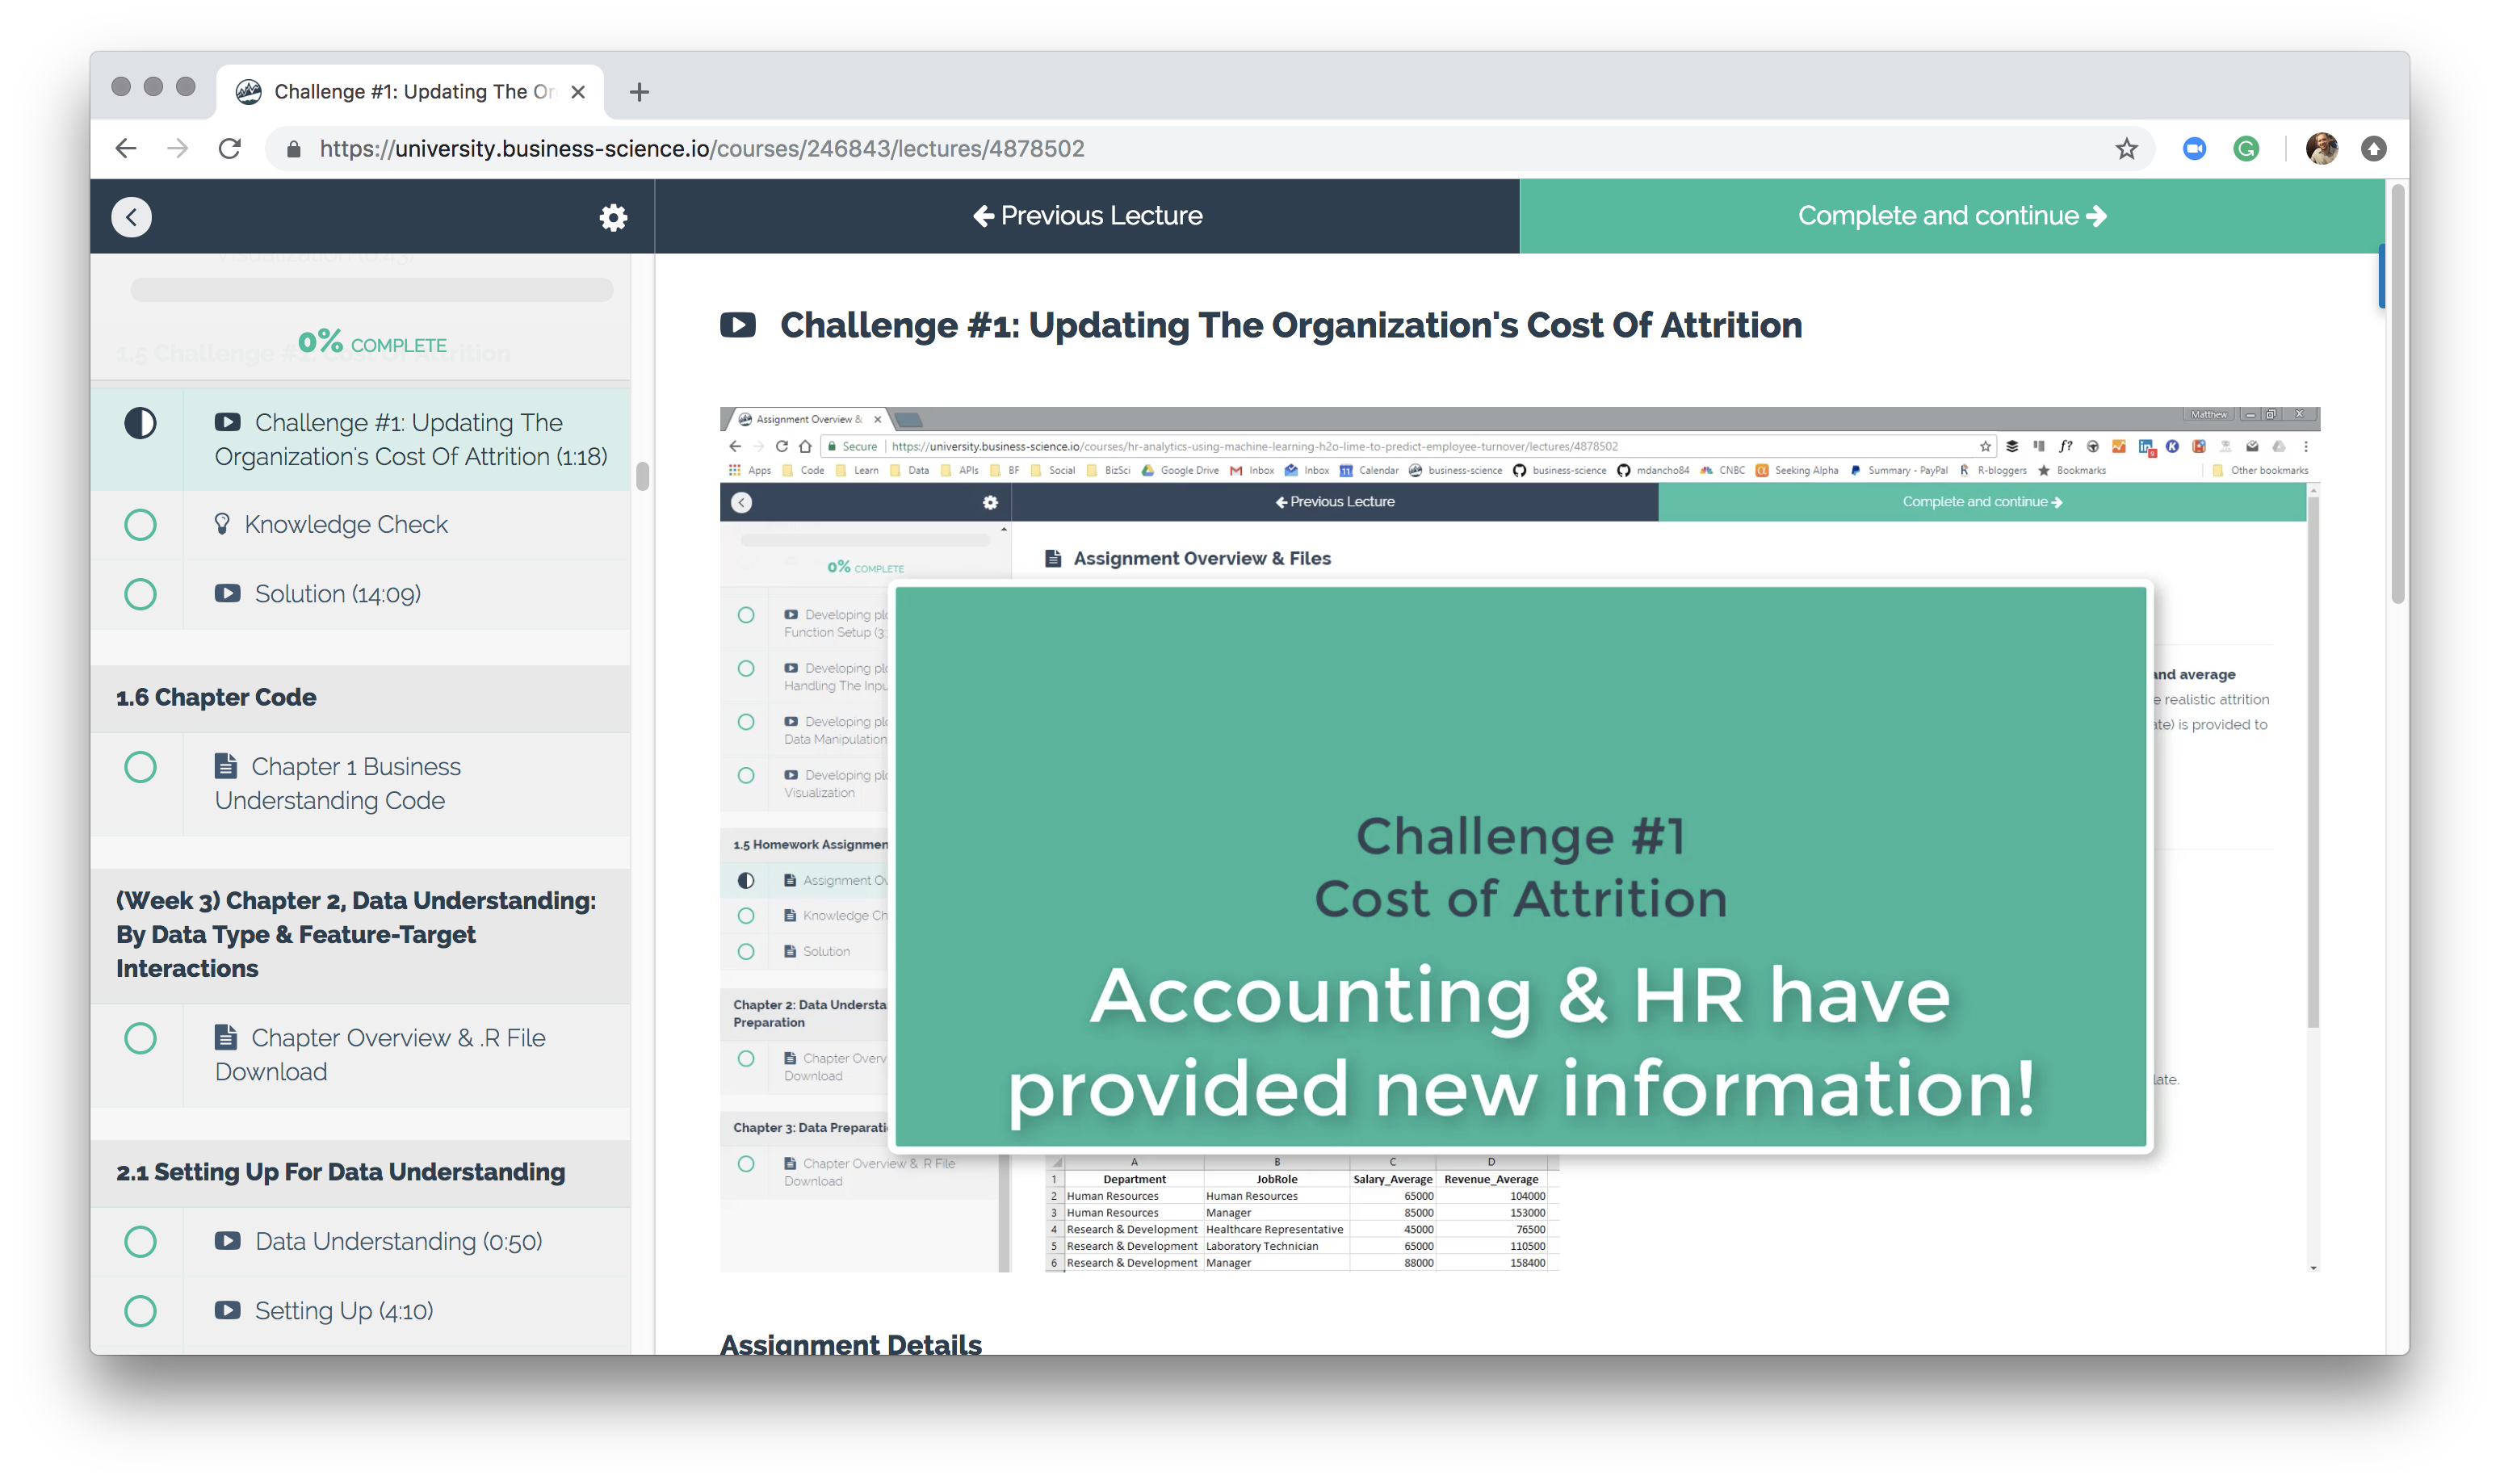
Now It's You're Turn To Apply Your Knowledge!
At the end of the module, the challenge solution is provided for the learners along with the full code used in the course.
New Course Coming Soon: Build A Shiny Web App!
You’re experiencing the magic of creating a high performance employee turnover risk prediction algorithm in DS4B 201-R. Why not put it to good use in an Interactive Web Dashboard?
In our new course, Build A Shiny Web App (DS4B 301-R), you’ll learn how to integrate the H2O model, LIME results, and recommendation algorithm building in the 201 course into an ML-Powered R + Shiny Web App!
Shiny Apps Course Coming in October 2018!!! Sign up for Business Science University Now!
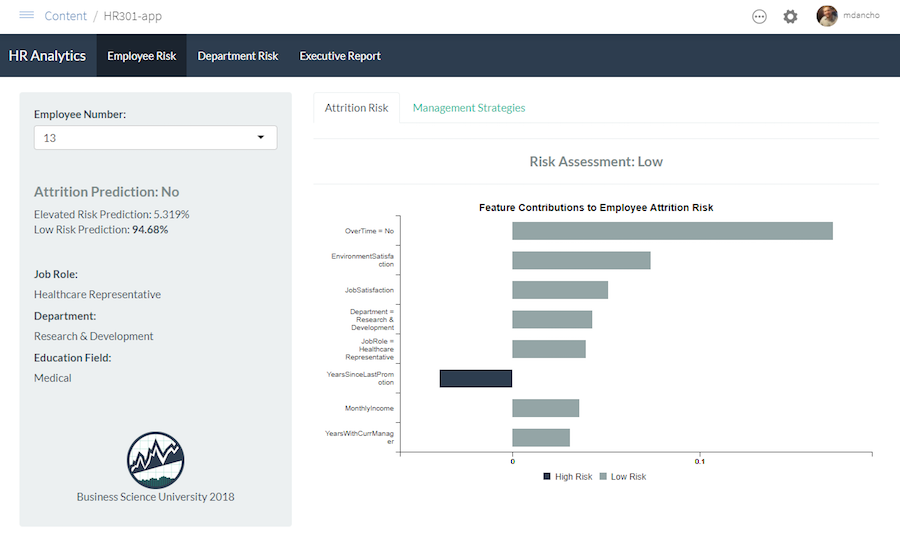
Building an R + Shiny Web App, DS4B 301-R
Get Started Today!