Data Science With R Course Series - Week 4
Written by David Curry
This week in the Data Science With R Course Series we’ll cover Data Preparation, where we structure the data in preparation for modeling. This week’s modules will teach you:
- How to create a preprocessing pipeline with the
recipes package
- How to prepare data for human readability and machine-readable formats
- How to perform a Correlation Analysis
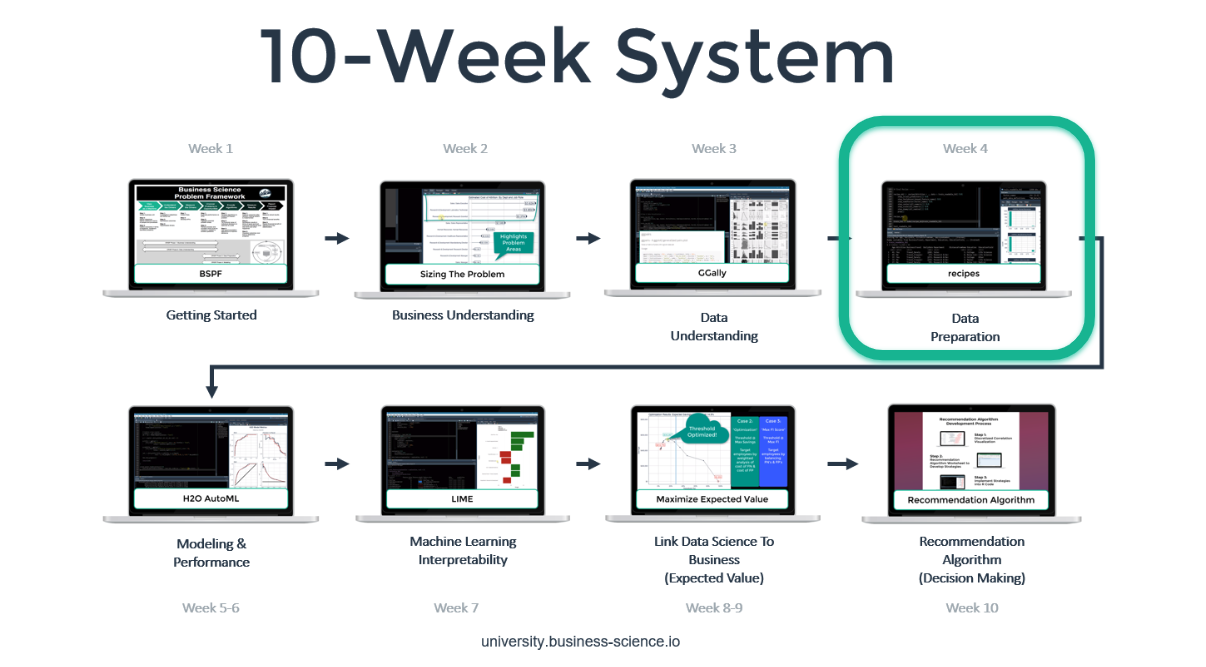
Here is a recap of our trajectory and the course overview:
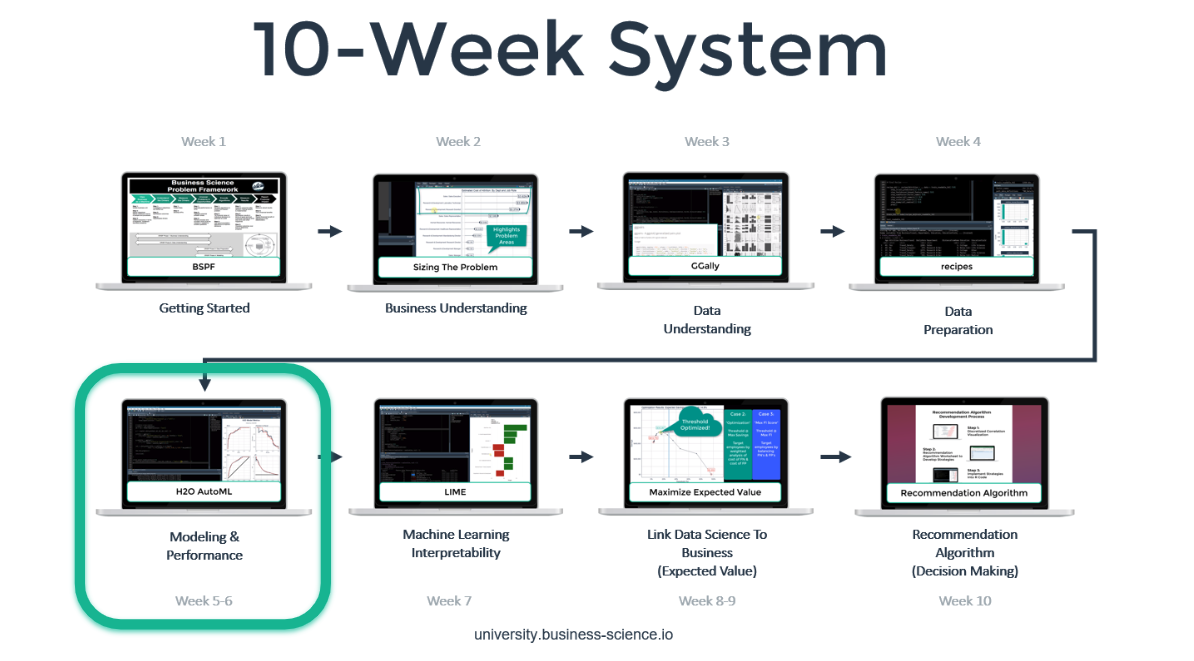
Recap: Data Science With R Course Series
You’re in the Week 4: Data Preparation. Here’s our game-plan over the 10 articles in this series. We’ll cover how to apply data science for business with R following our systematic process.
Week 4: Data Preparation

Student Feedback
Week 4: Data Preparation
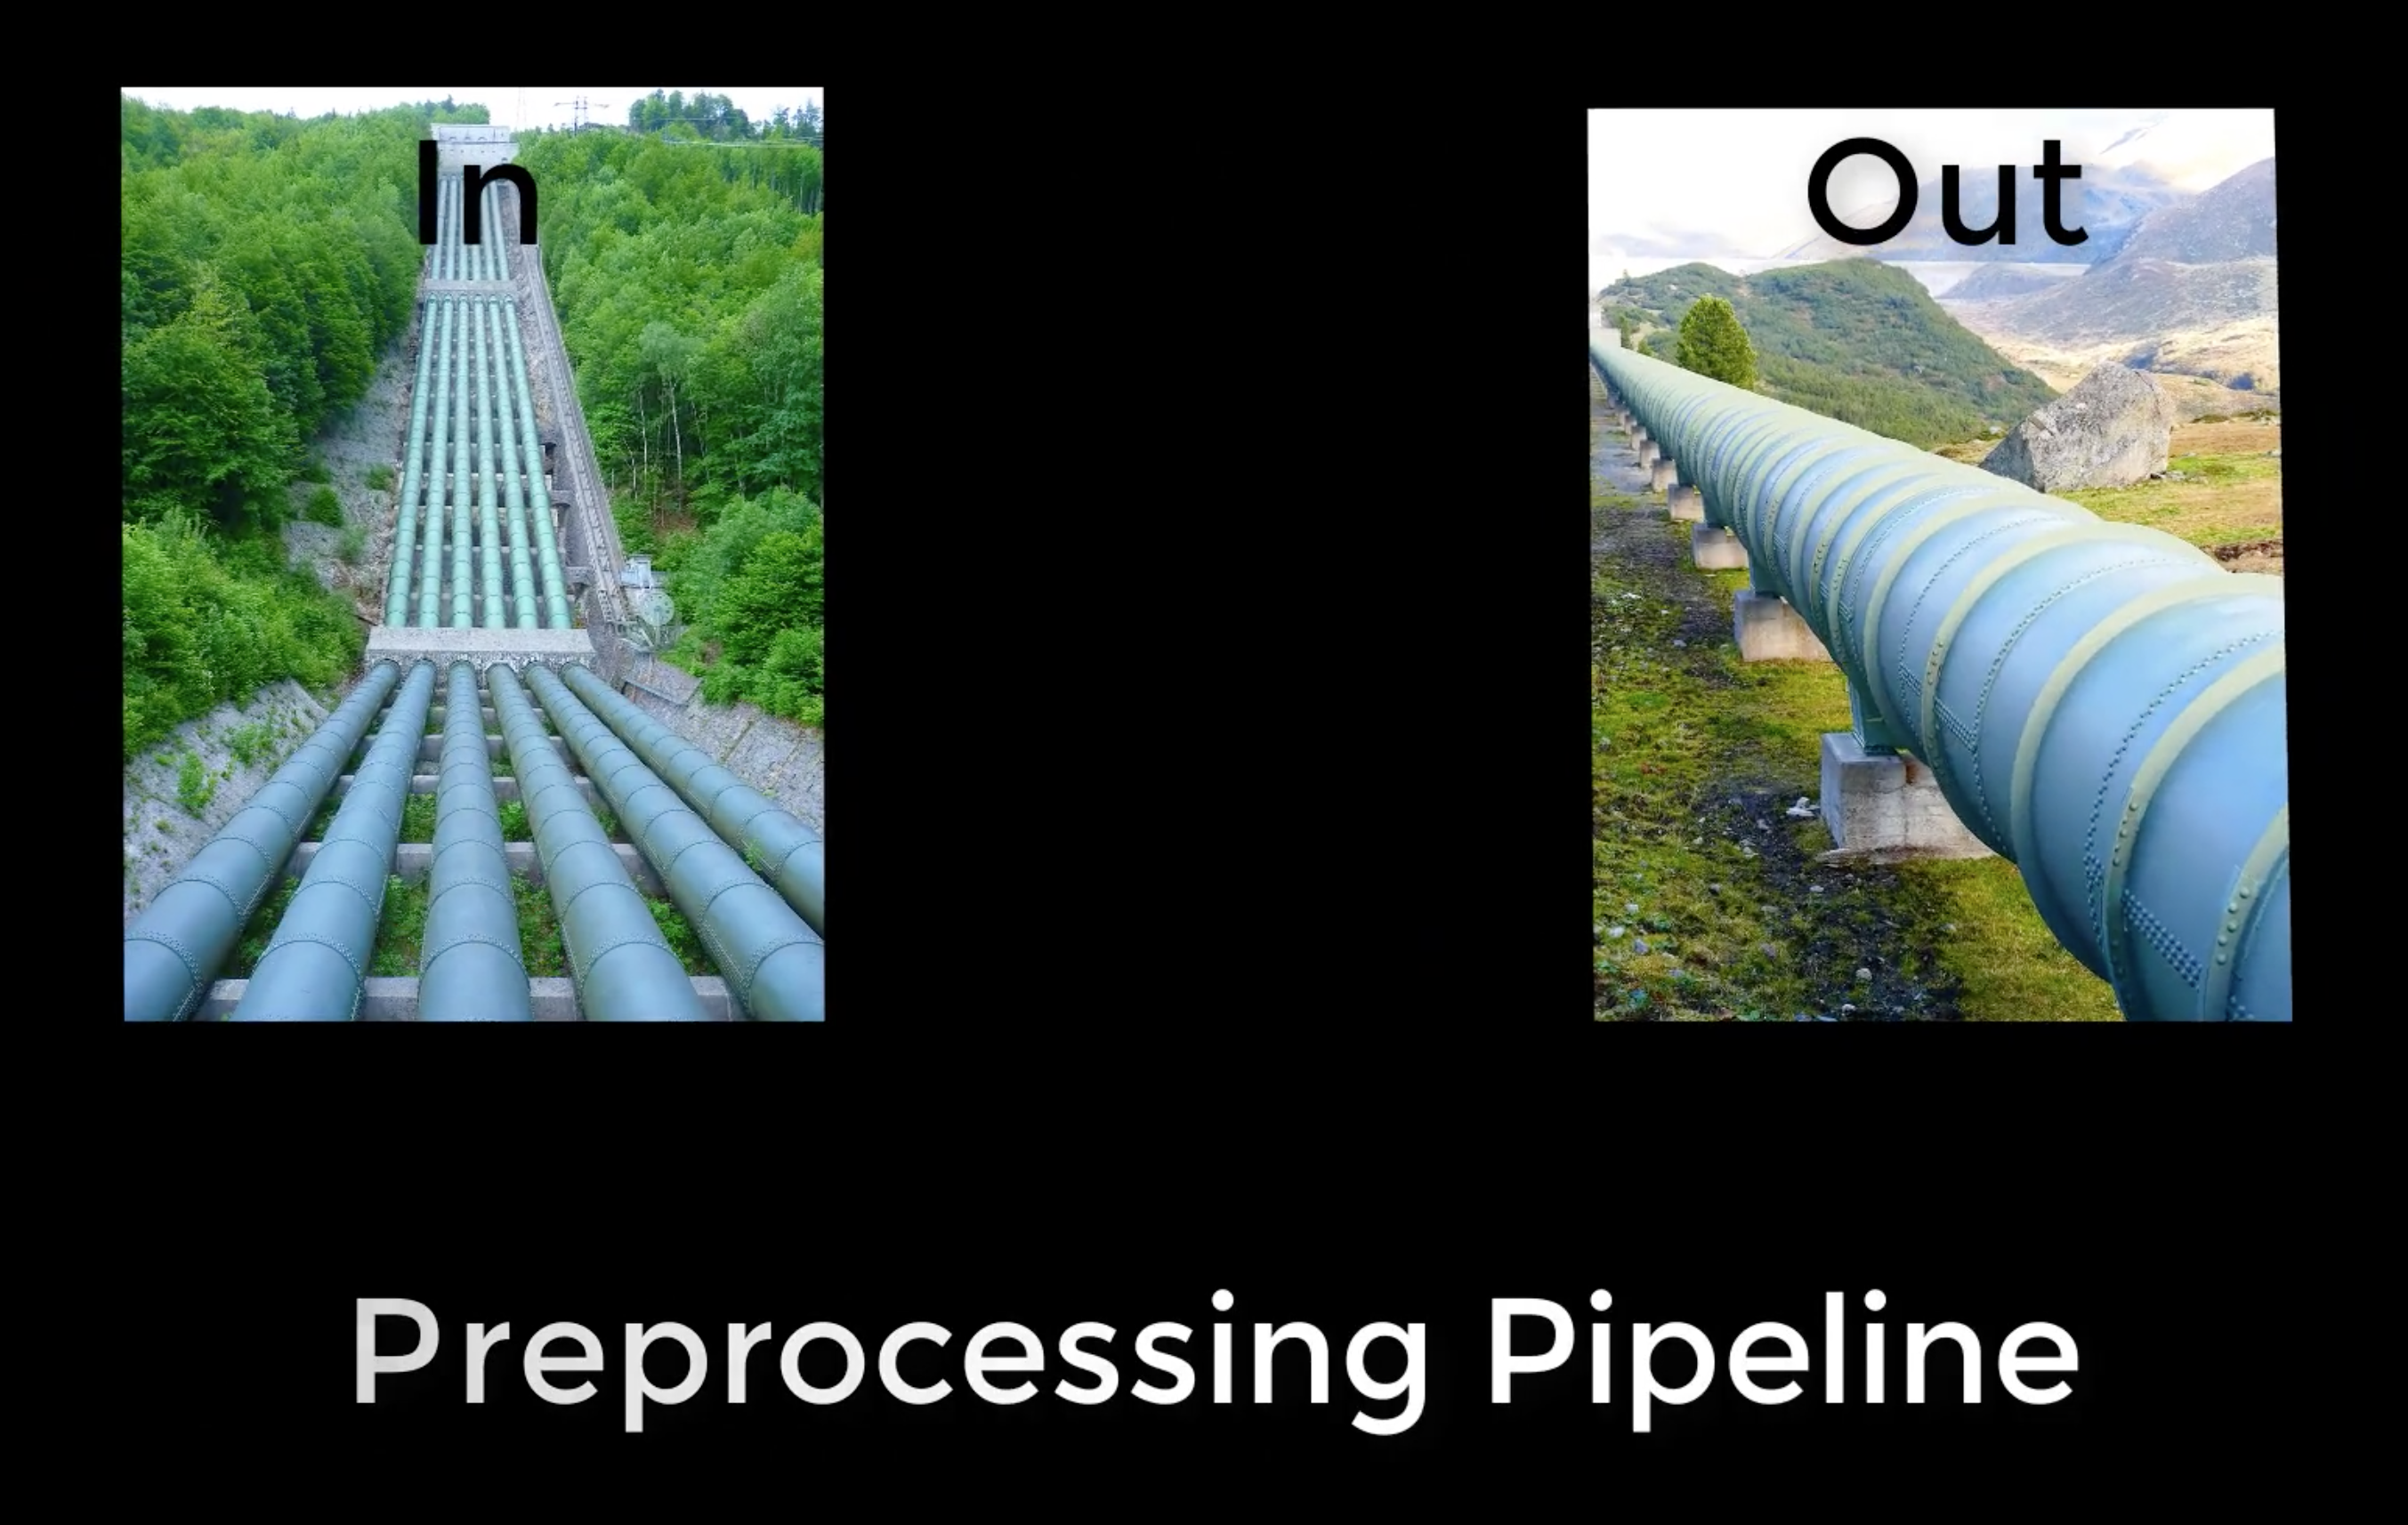
Preprocessing Pipeline
In data science, the data is used for both analyzing/modeling and communicating insights to people. This module demonstrates how to create a reusable preprocessing structure to prepare data for people (communication) and machines (analyzing/modeling).
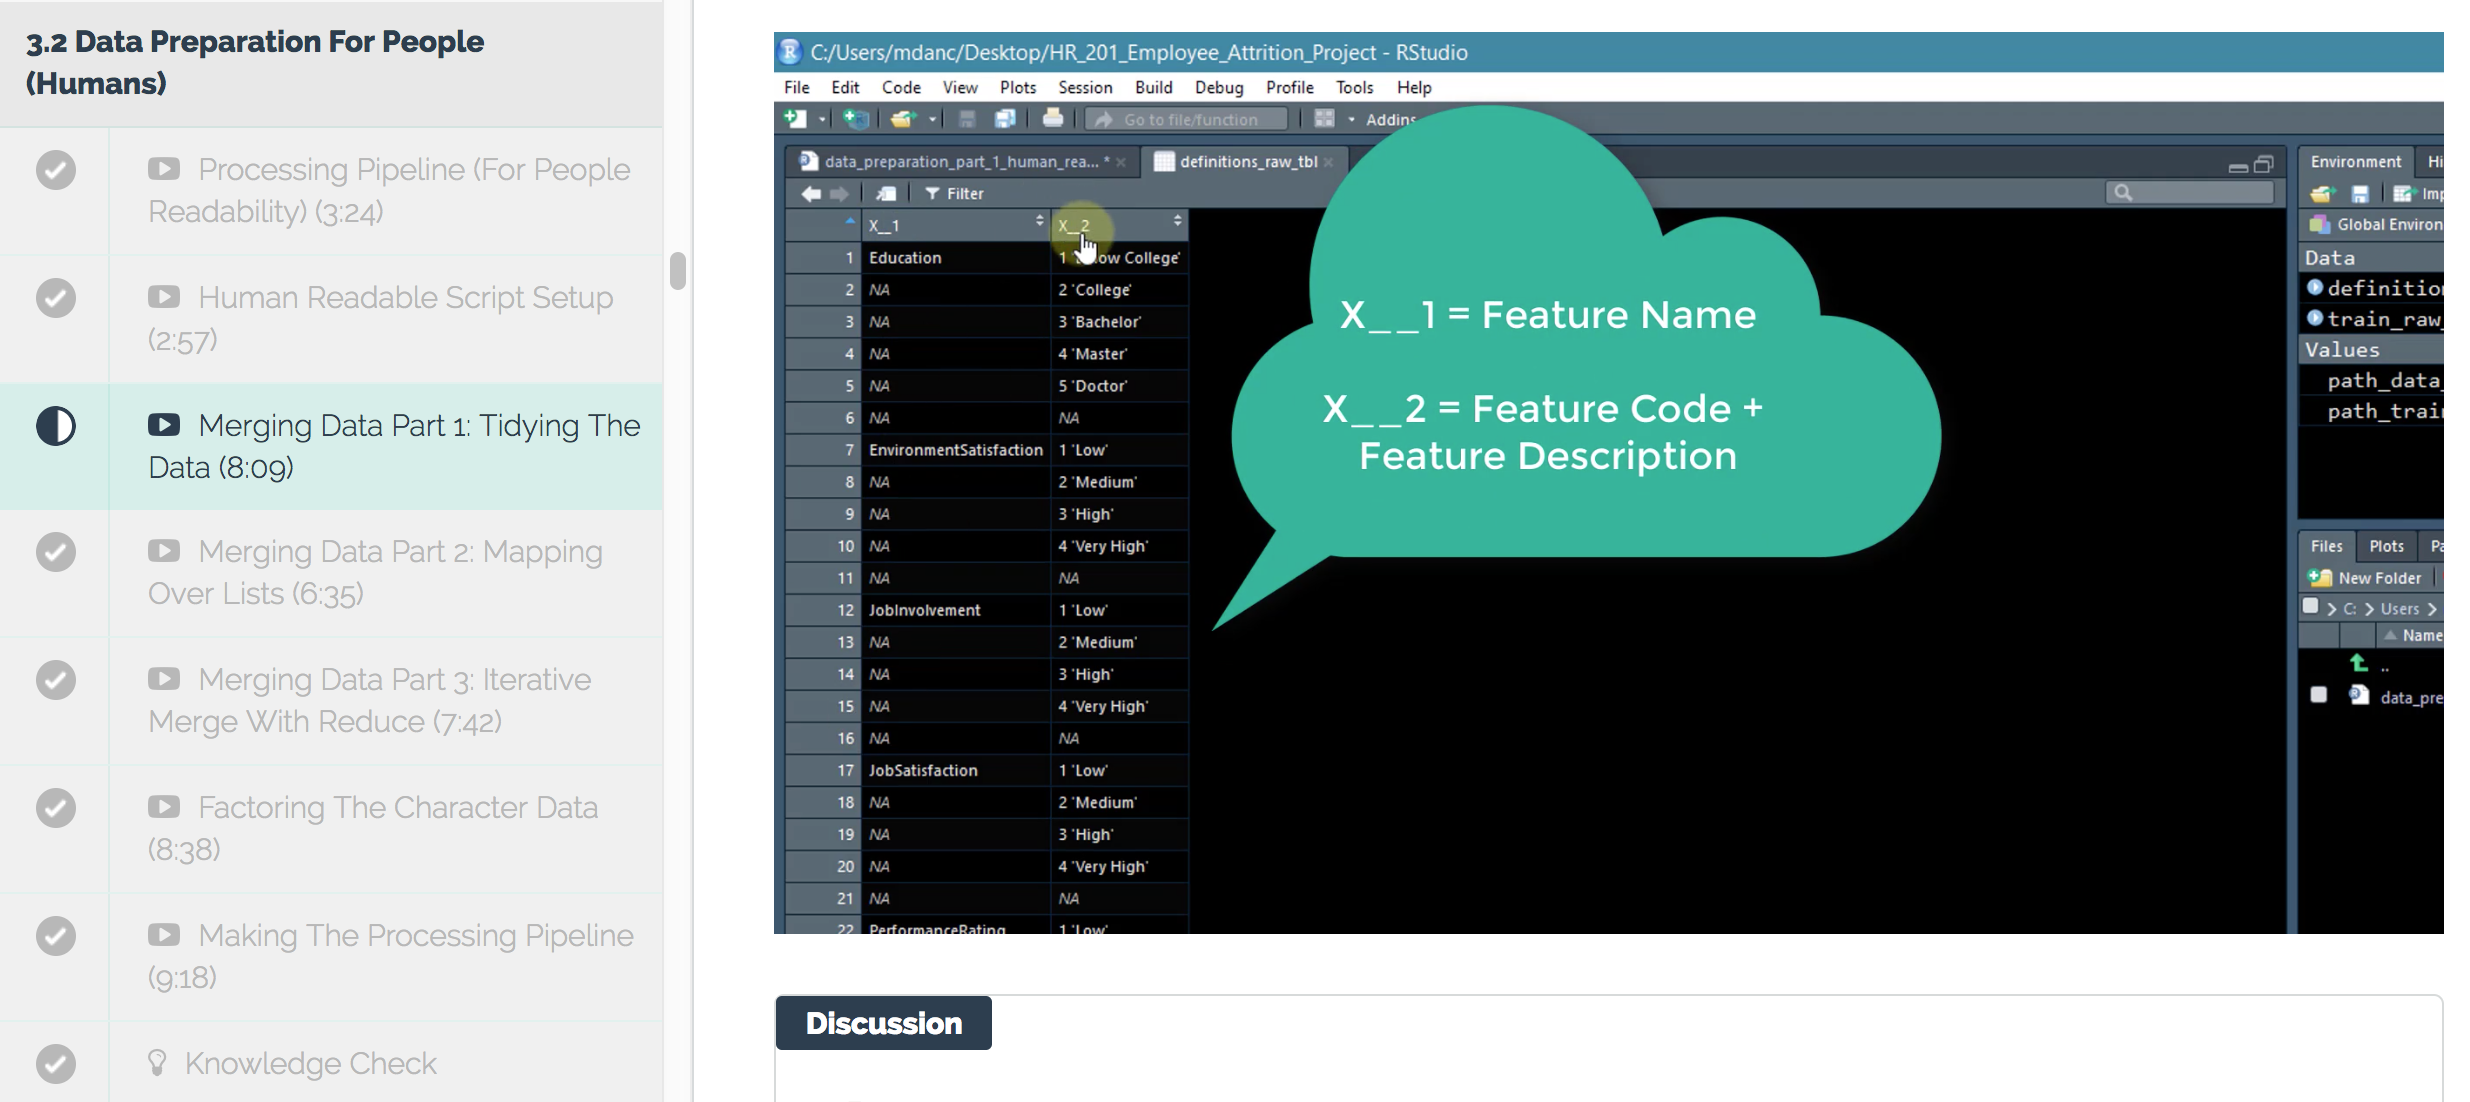
Data Preparation For People
The Data Preparation for People module focuses on formatting data so it is easily understood in plots, visualizations, and other data communication methods.
This module will teach you how to merge data, join data, and maintain accurate ordering for categorical data.
Data Preparation For Machines
Properly formatting data for machine learning is one of the most important aspects of data science. This step involves understanding your goal, your algorithm, and your data. The Data Preparation for Machines module will teach you how to create a custom histogram function to visually analyze data features.
Through the recipes package, this module also teaches important data science topics, such as zero variance features, data transformations, center & scale, and dummy variables.
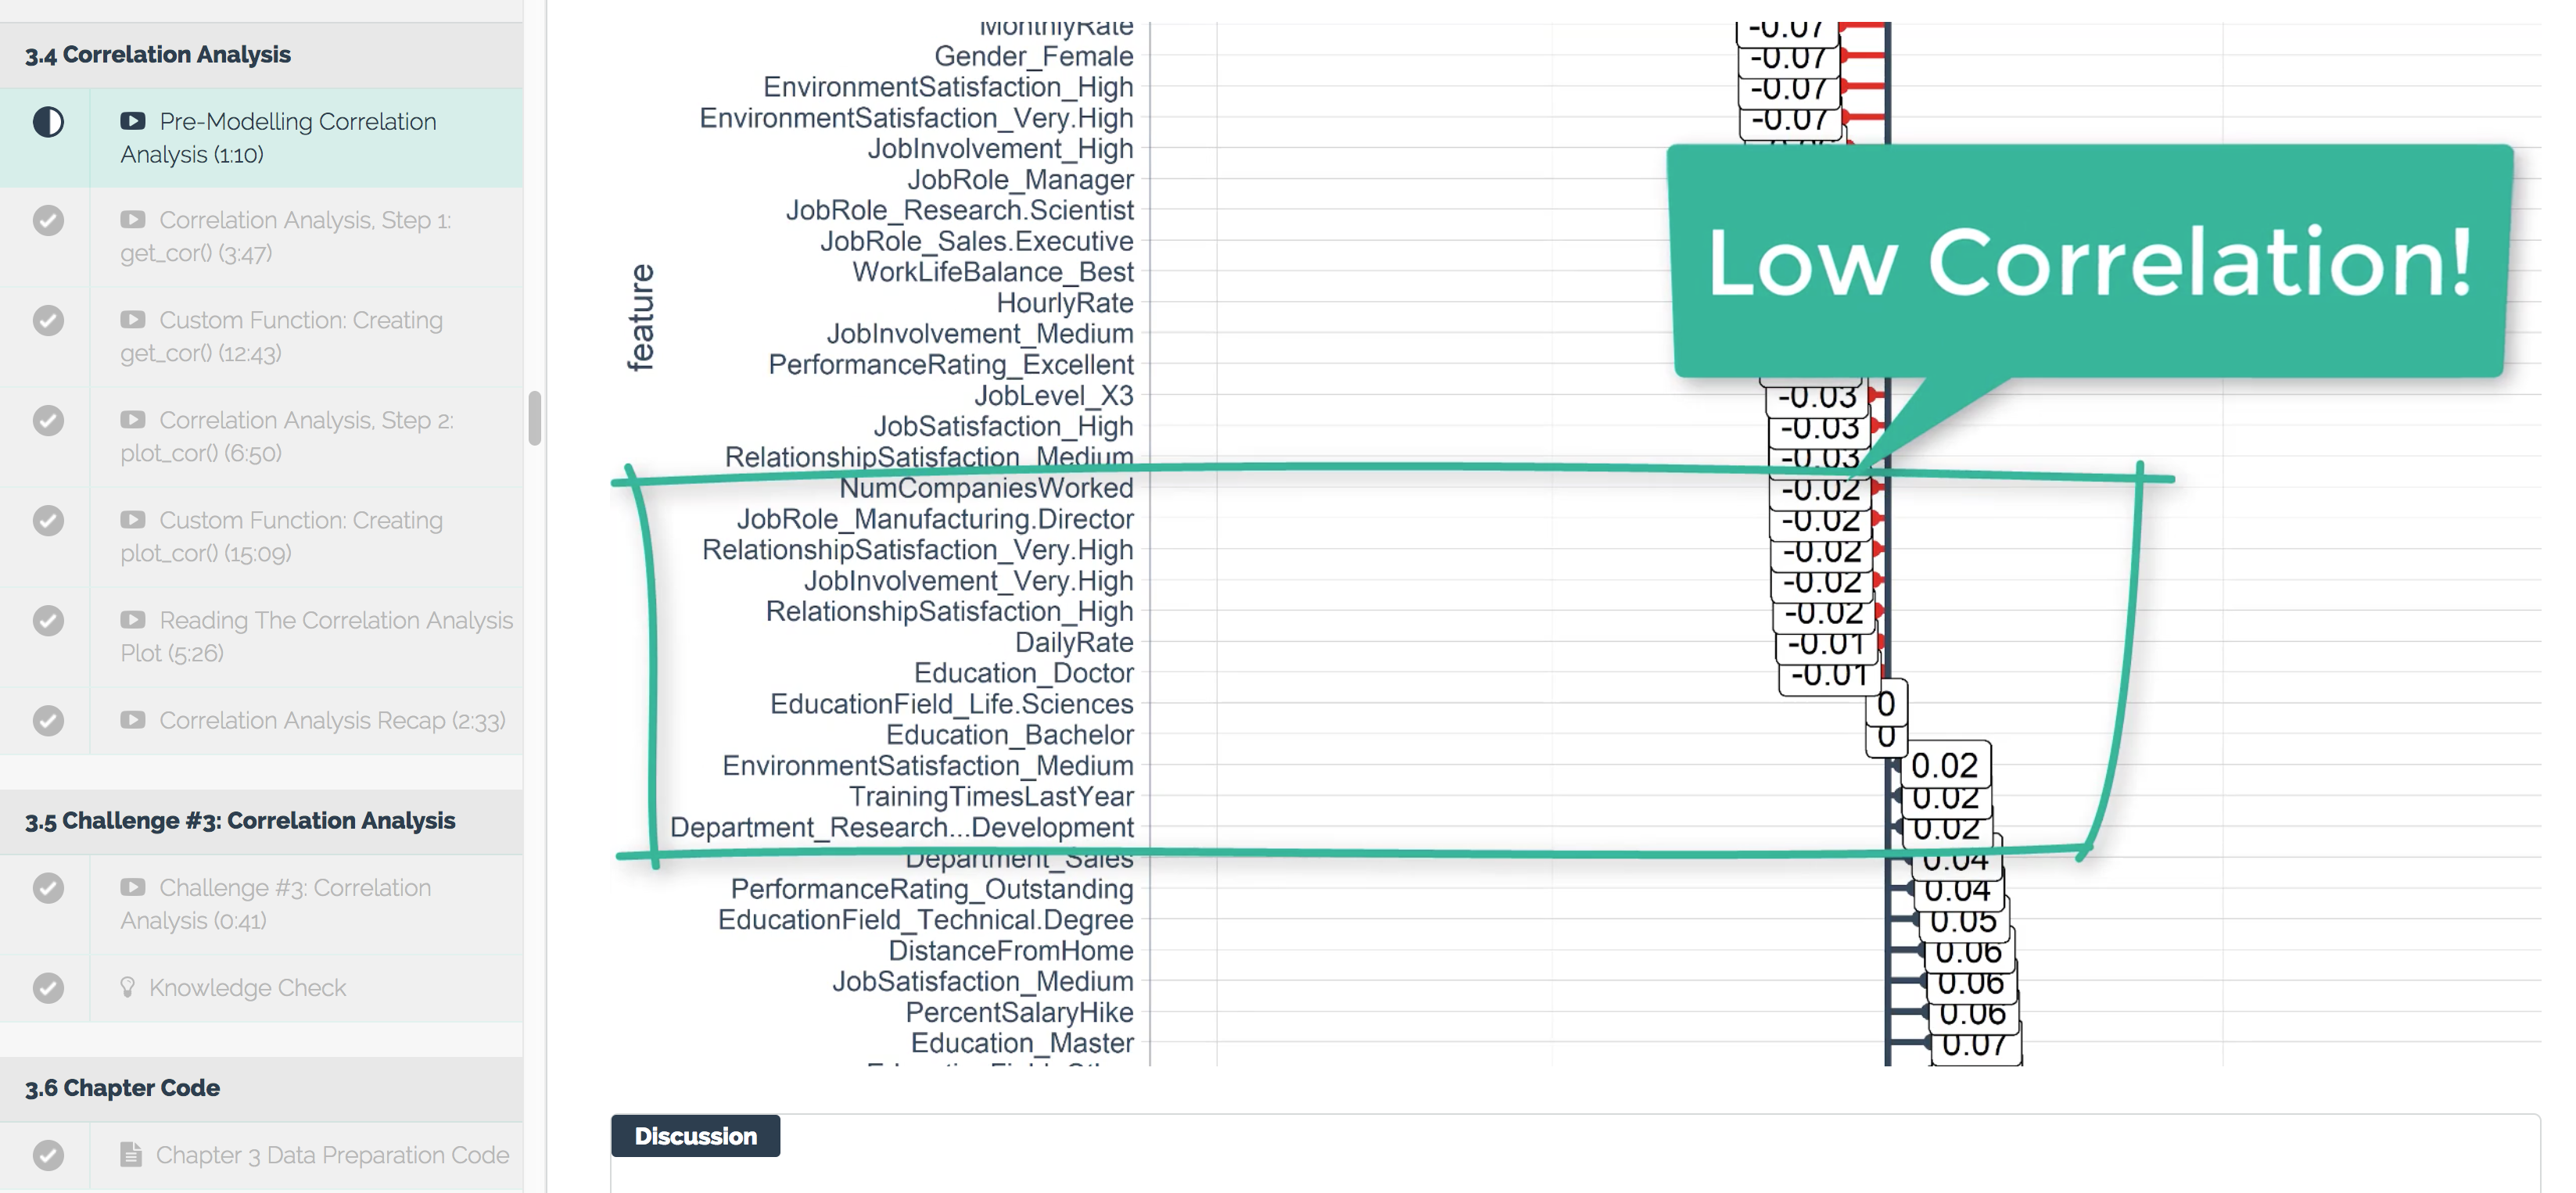
Correlation Analysis
Without good features, you can’t make good predictions. The most effective way to build a good model is to build good features that correlate to the problem. Correlation analysis is a way of reviewing features in the data to let us know if we are on the right track before modeling.
This module will teach you how to group similar features, calculate feature correlation, and analyze feature correlation.
Correlation analysis is an important step because it saves time by avoiding modeling features with low correlation.
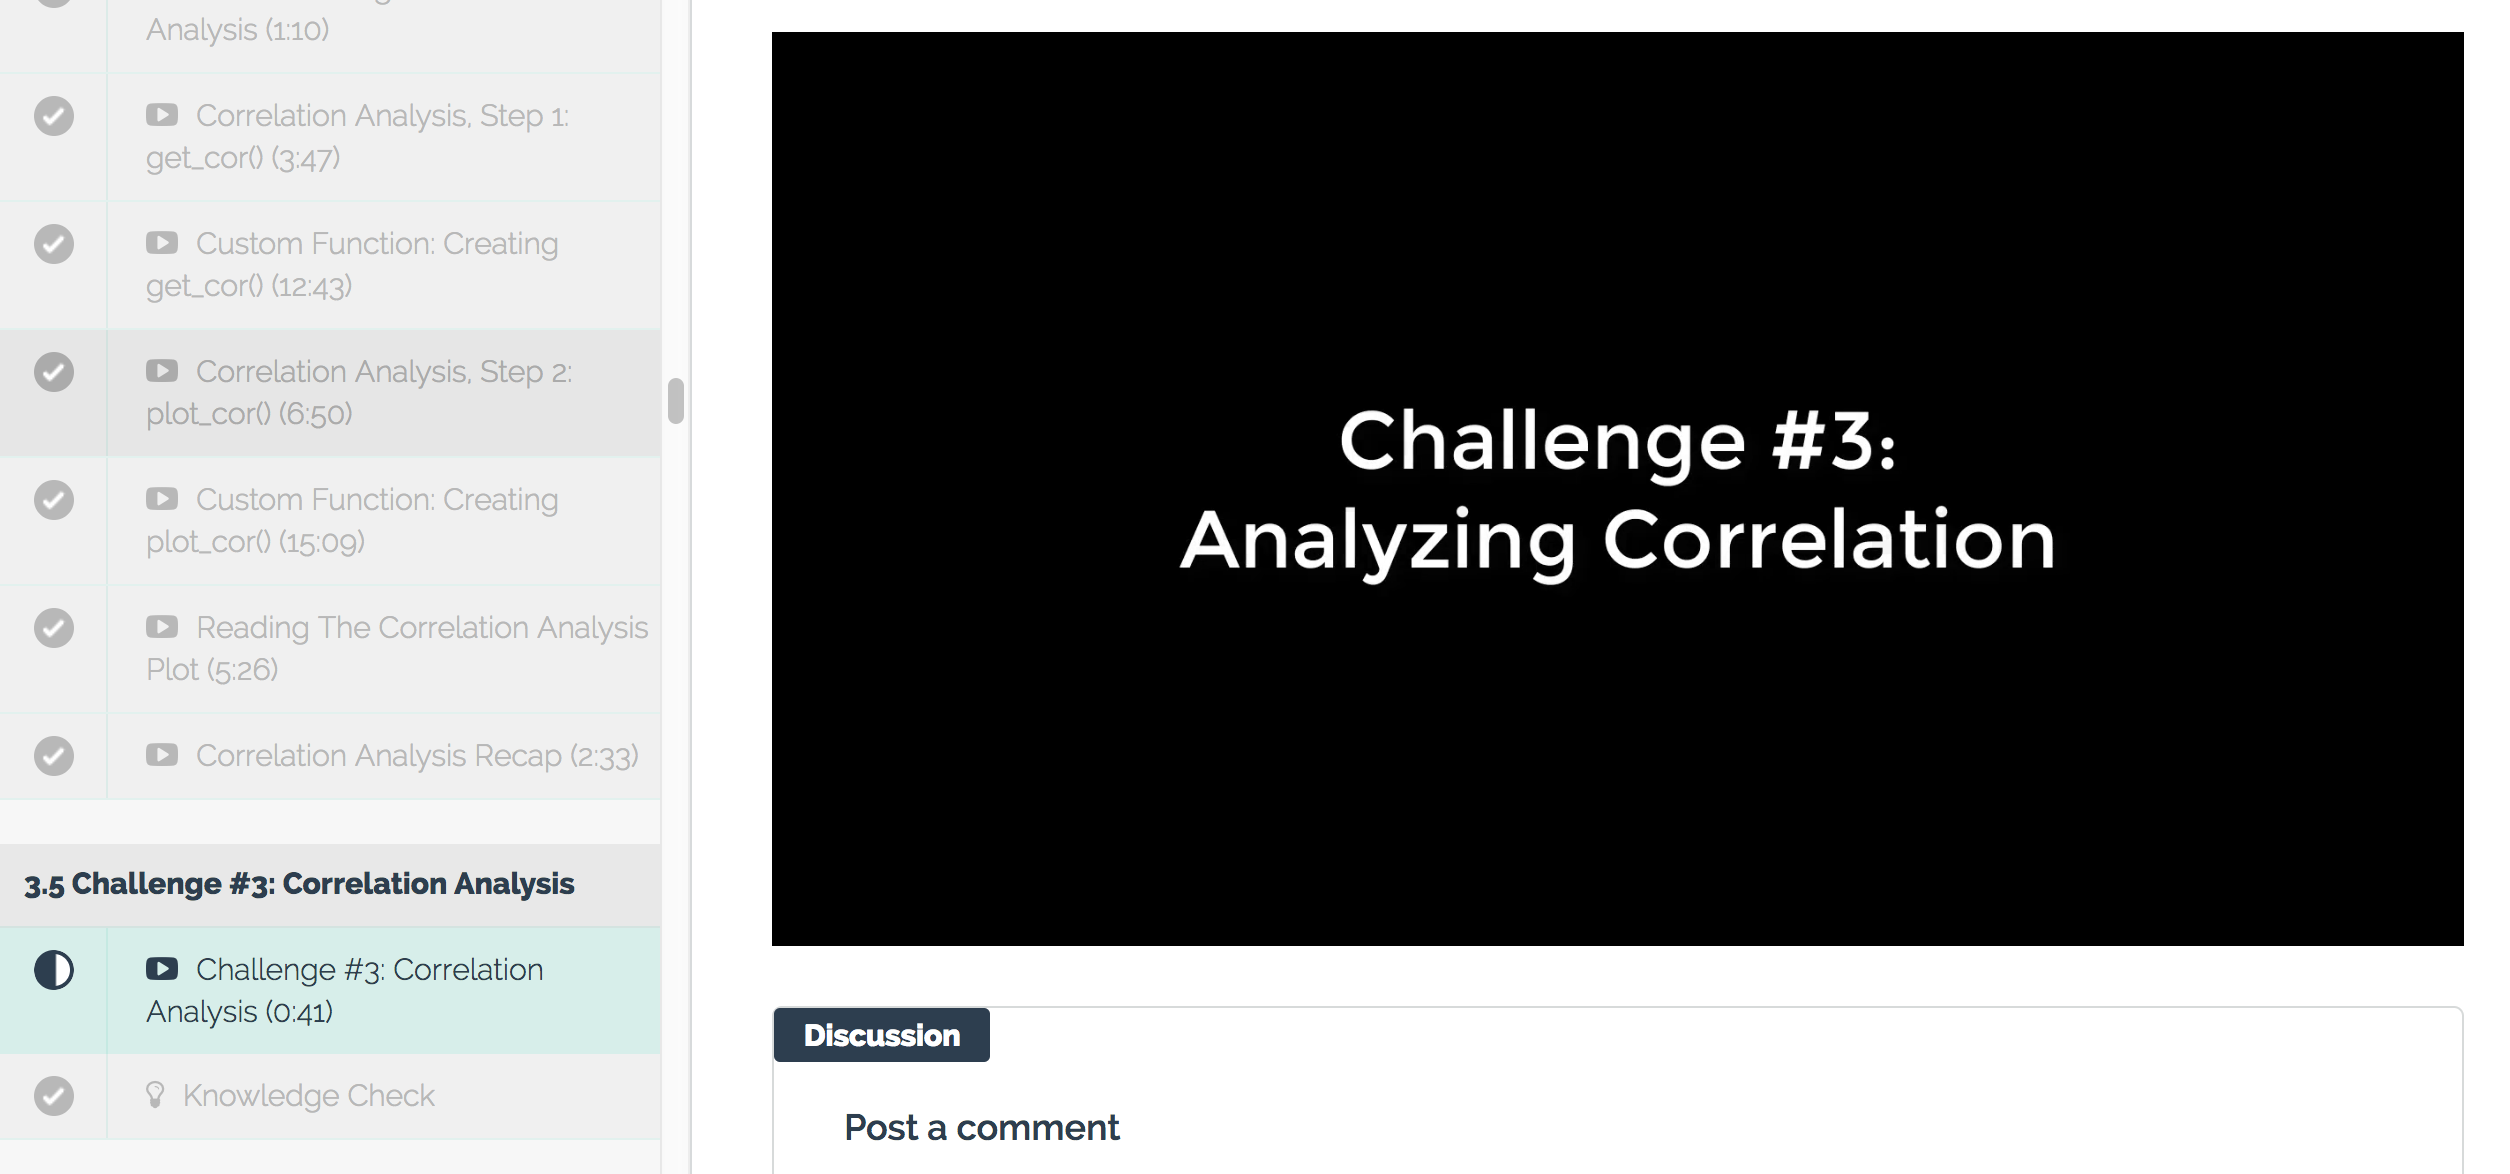
Challenge #3
Course challenges are short exercises that give you the opportunity to apply the skills you’re learning. This week’s modules teach you how to perform correlation analysis on some of the features.
Challenge #3 provides an opportunity for you to apply your correlation analysis skills to a group of features.
You Need To Learn R For Business
To be efficient as a data scientist, you need to learn R. Take the course that has cut data science projects in half (see this testimonial from a leading data science consultant) and has progressed data scientists more than anything they have tried before. Over 10-weeks you learn what it has taken data scientists 10-years to learn:
- Our systematic data science for business framework
- R and H2O for Machine Learning
- How to produce Return-On-Investment from data science
- And much more.
Start Learning Today!
Next Up
The next article in the Data Science With R Series covers Automated Machine Learning with H2O.
Week 5 is an exciting part of the course where you learn how to create machine learning models with the R package, H2O. The culmination of the previous weeks have been preparation for machine learning modeling.
Get ready for a FUN week! During week 5, you will learn:
- Modeling Setup
- H2O Automated Machine Learning
- Advanced concepts, such as cross validation and grid search
- Visualizing the best performing models
Week 5: Modeling & Performance
New Course Coming Soon: Build A Shiny Web App!
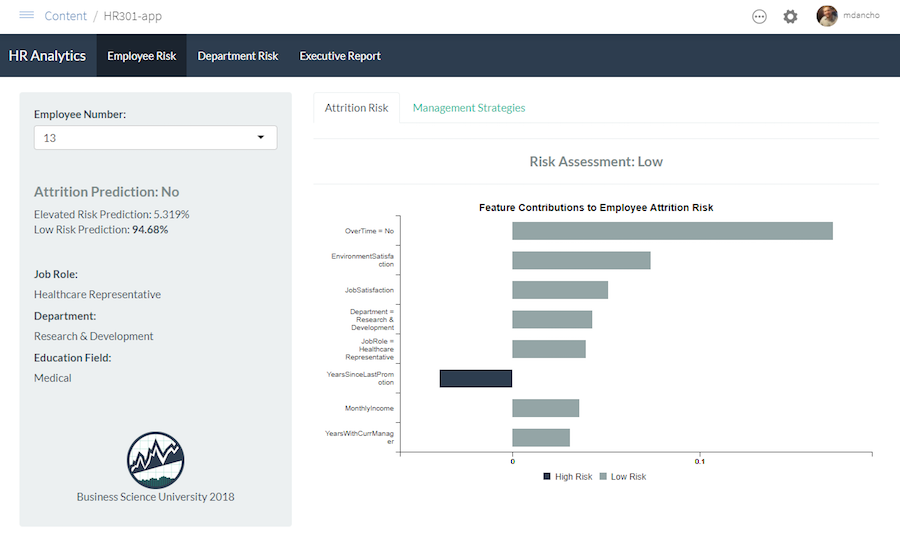
You’re experiencing the magic of creating a high performance employee turnover risk prediction algorithm in DS4B 201-R. Why not put it to good use in an Interactive Web Dashboard?
In our new course, Build A Shiny Web App (DS4B 301-R), you’ll learn how to integrate the H2O model, LIME results, and recommendation algorithm building in the 201 course into an ML-Powered R + Shiny Web App!
Shiny Apps Course Coming in October 2019!!! Sign up for Business Science University Now!
Building an R + Shiny Web App, DS4B 301-R
Get Started Today!