Timetk: Visualize Time Series Data (in 1-Line of Code)
Written by Matt Dancho
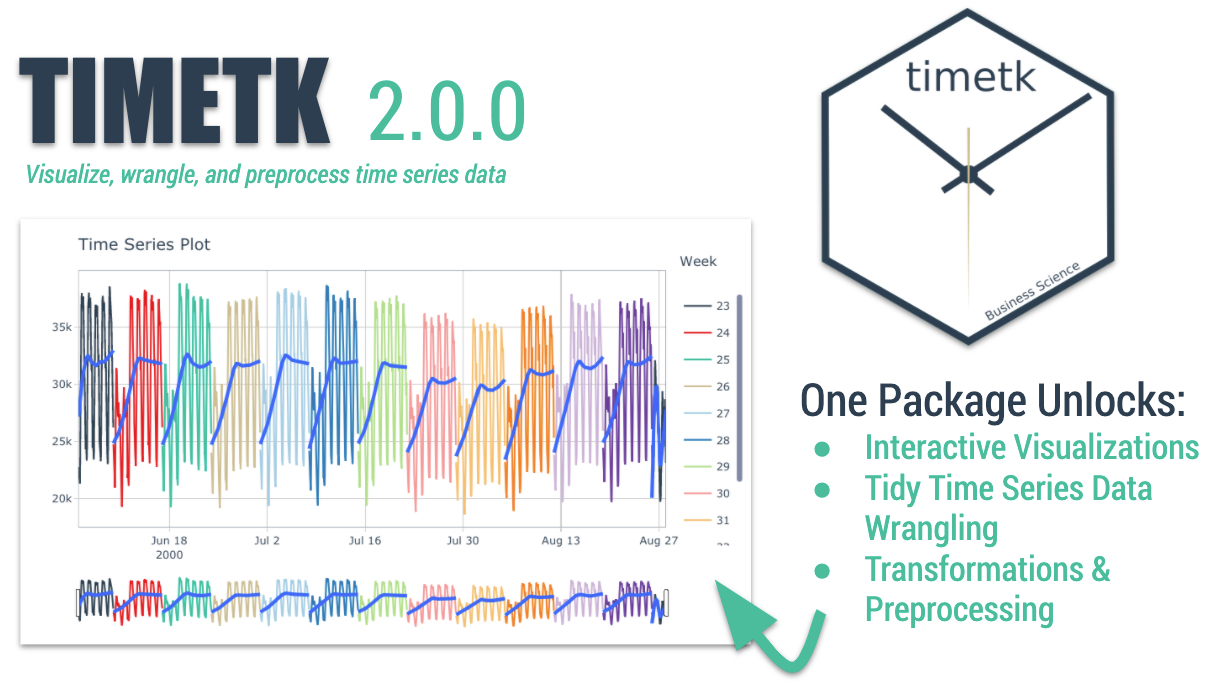
I’m ECSTATIC 😃 to announce the release of timetk version 2.0.0. This is a monumental release that significantly expands the functionality of timetk to go way beyond the original goals of the package. Now, the package is a full-featured time series visualization, data wrangling, and feature engineering toolkit.
- We’ll first give you a little background on why
timetk exists
- Then we’ll do a short demo of what you can do with
timetk (in 1-line of code)
If you like what you see, I have an Advanced Time Series Course where you will learn High-Performance Time Series Analysis and Forecasting.
Time Series Forecasting Article Guide:
This article is part of a series of software announcements on the Modeltime Forecasting Ecosystem.
-
(Start Here) Modeltime: Tidy Time Series Forecasting using Tidymodels
-
Modeltime H2O: Forecasting with H2O AutoML
-
Modeltime Ensemble: Time Series Forecast Stacking
-
Modeltime Recursive: Tidy Autoregressive Forecasting
-
Hyperparameter Tuning Forecasts in Parallel with Modeltime
-
Time Series Forecasting Course: Now Available
Like these articles?
👉 Register to stay in the know
👈
on new cutting-edge R software like modeltime.
Why timetk for time series?
I’ll go into detail about what you can do in 1-line of code, and I have several more articles on how to use a forecasting tool called Modeltime… But, first a little history.
Fixing the inconsistency problem
Time series has been a passion project for me since my days of forecasting sales and economic data for a manufacturing company I worked for. My one gripe has always been that I had to use 50 different packages (zoo, xts, dplyr, etc) made by 50 different people to perform common data wrangling and visualization analyses. timetk solves this problem by making a consistent approach to visualize, wrangle, and preprocess time series data inside the tidyverse and tidymodels ecosystem.
With advancements in tidy-time series, the combination of the tidyverse and time series is an amazingly powerful concept. I’m not the first one to think of this idea. In fact, Davis Vaughan created tibbletime and the “tidyverts” (Rob Hyndman, Earo Wang, and Mitchell O’Hara-Wild) have created a whole forecasting and data wrangling system using a tsibble data structure.
These are amazing packages, but they solve different needs. tibbletime focused on data wrangling. The tidyverts focused on forecasting at scale using ARIMA.
The timetk difference
Visualize, wrangle, and preprocess time series data
Timetk is different. It’s designed for:
- Quick interactive visualizations for easy data exploration
- Time series data wrangling transformations for doing time series summarization, filtering, padding, and simple date-based arithmetic inside the
tidyverse
- Feature engineering and preprocessing that work in the
tidymodels ecosystem so we can do Time Series Machine Learning with Modeltime
So I created timetk version 2.0.0 to solve these needs.
The timetk mission
Here’s the new mission, and what you can do in 1-line of code with timetk >= 2.0.0:
To make it easy to visualize, wrangle, and feature engineer time series data for forecasting and machine learning prediction.
Time Series Visualization
What can you do in one-line of Code?
First step, load these R packages.
library(tidyverse)
library(lubridate)
library(timetk)
1. Investigate a time series
This is fun! In 1 line of code we can visualize a dataset.
# Static ggplot
taylor_30_min %>%
    plot_time_series(date, value, .color_var = week(date),
                     .interactive = FALSE, .color_lab = "Week")
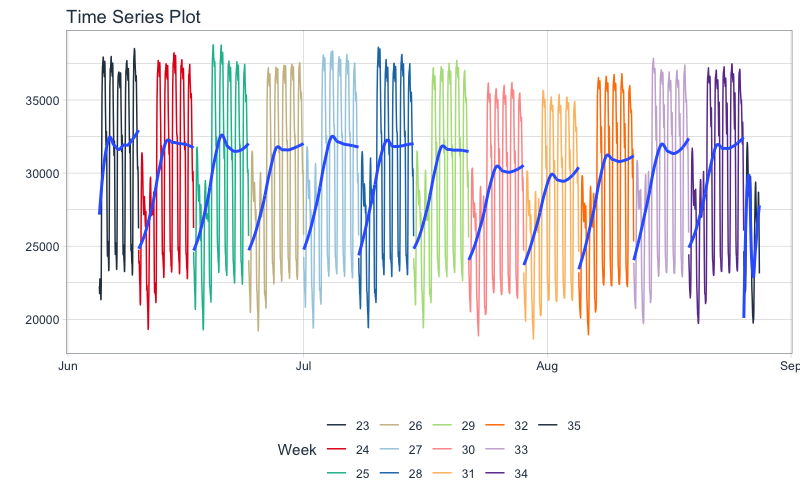
So what did we just do?
We are exploring taylor_30_min, which is a classic electricity-demand time series that comes from one of my all-time-favorite packages, forecast. It’s been updated to the tibble structure with a time stamp column called “date” and a value column called “value”.
We can plotted it using plot_time_series(). I set .interactive = FALSE to return a ggplot (I’ll do that for all of the visualizations in this tutorial). The default is to return an interactive plotly graph, which is great for shiny apps, rmarkdown HTML documents, and super powerful for exploring time series (zooming, panning, etc).
Want the an interactive plotly visualization?
Just try this code and explore the plotly visualization.
# INTERACTIVE Plotly
taylor_30_min %>%
    plot_time_series(date, value, .color_var = week(date),
                     .interactive = TRUE, .plotly_slider = TRUE, .color_lab = "Week")
Let’s pick up the pace. Here’s some more amazing visualization capabilities!
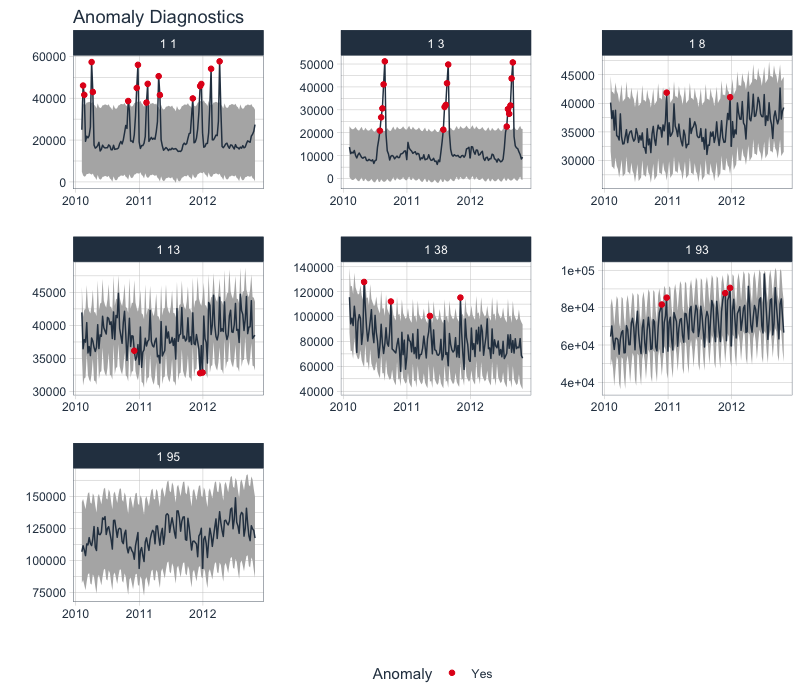
2. Visualize anomalies
We can visualize anomalies for multiple time series groups. Here we use group_by() to group the time series. Note this is a different dataset, walmart_sales_weekly.
walmart_sales_weekly %>%
    group_by(Store, Dept) %>%
    plot_anomaly_diagnostics(Date, Weekly_Sales,
                             .facet_ncol = 3, .interactive = FALSE)
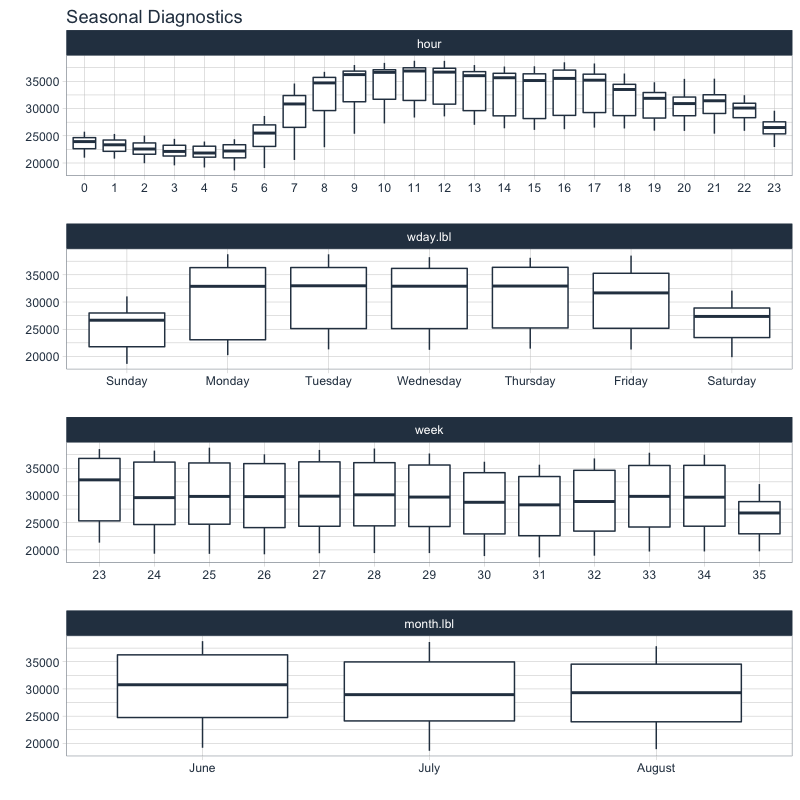
3. Make a seasonality plot
We can get seasonality plots.
taylor_30_min %>%
    plot_seasonal_diagnostics(date, value, .interactive = FALSE)
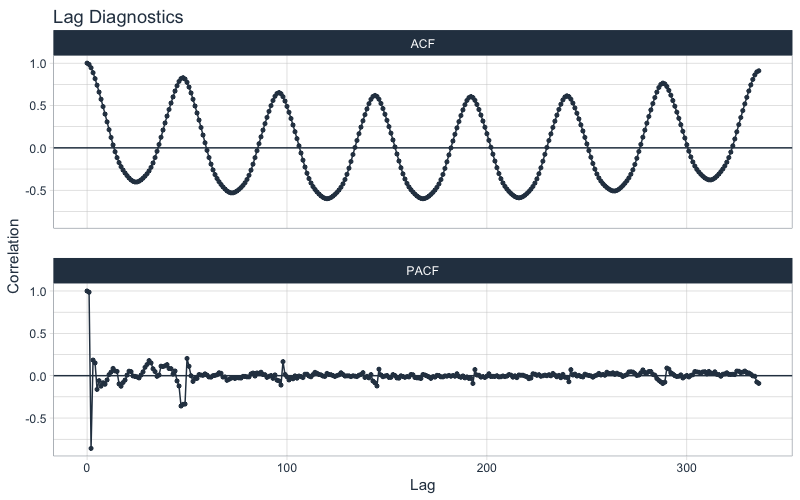
4. Inspect autocorrelation, partial autocorrelation (and cross correlations too)
And we can search the Autocorrelation and Partial Autocorrelation.
taylor_30_min %>%
    plot_acf_diagnostics(date, value, .lags = "1 week", .interactive = FALSE)
Learning More
Like timetk for time series? We just scratched the surface. Believe me, the timetk API is extensive.
So how are you ever going to learn time series analysis and forecasting? You’re probably thinking:
- There’s so much to learn
- My time is precious
- I’ll never learn time series
I have good news that will put those doubts behind you.
You can learn time series analysis and forecasting in hours with my state-of-the-art time series forecasting course. 👇
High-Performance Time Series Course
Become the times series expert in your organization.
My High-Performance Time Series Forecasting in R course is available now. You’ll learn timetk and modeltime plus the most powerful time series forecasting techniques available like GluonTS Deep Learning. Become the times series domain expert in your organization.
👉 High-Performance Time Series Course.
You will learn:
- Time Series Foundations - Visualization, Preprocessing, Noise Reduction, & Anomaly Detection
- Feature Engineering using lagged variables & external regressors
- Hyperparameter Tuning - For both sequential and non-sequential models
- Time Series Cross-Validation (TSCV)
- Ensembling Multiple Machine Learning & Univariate Modeling Techniques (Competition Winner)
- Deep Learning with GluonTS (Competition Winner)
- and more.
Unlock the High-Performance Time Series Course
Have questions on using Timetk for time series?
Make a comment in the chat below. 👇
And, if you plan on using timetk for your business, it’s a no-brainer - Join my Time Series Course Waitlist (It’s coming, it’s really insane).