R for Excel Users: Pivot Tables, VLOOKUPs in R
Written by Matt Dancho
New business and financial analysts are finding R every day. Most of these new userRs (R users) are coming from a non-programming background. They have ample domain experience in functions like finance, marketing, and business, but their tool of choice is Excel (or more recently Tableau & PowerBI).
Learning R can be a major hurdle. You need to learn data structures, algorithms, data science, machine learning, web applications with Shiny and more to be able to accomplish a basic dashboard. This is a BIG ASK for non-coders. This is the problem I aim to begin solving with the release of tidyquant v1.0.0. Read the updated ‘R for Excel Users’ on Business Science.
Let’s demo several of the new Excel features!
Articles in Series
Excel in R: Introducing tidyquant 1.0.0
Pivot Tables, VLOOKUPs, Sum-Ifs, and more
In tidyquant version 1.0.0, I have added the following features to support new useRs transitioning from an Excel background.
New Features
To make the transition to R easier for Excel Users
✅ Pivot Tables in R
✅ VLOOKUP in R
✅ Summarizing “IFS” Functions
✅ 100 + New Excel Functions
✅ NEW API Integrations (Implementation scheduled for March)
I’ll showcase a small portion of the new features in this post. Register Here for new Learning Labs (Free) - I go through real business examples where I showcase packages like using Shiny and tidyquant together (did this in Learning Lab 30).
Shiny App with Pivot Table using tidyquant
Register for New Learning Labs Here
Replication Requirements
Please use tidyquant (>= 1.0.0), which is now available on CRAN.
# devtools::install_github("business-science/tidyquant")
install.packages("tidyquant")
Load the following libraries.
library(tidyverse)
library(tidyquant)
library(knitr)
✅ Pivot Tables
The Pivot Table is one of Excel’s most powerful features. Honestly, when I came to R, one of the biggest things I lost was the Pivot Table - A tool used for quickly summarizing data into a digestable table. It’s now in R with pivot_table().
Excel Pivot Table
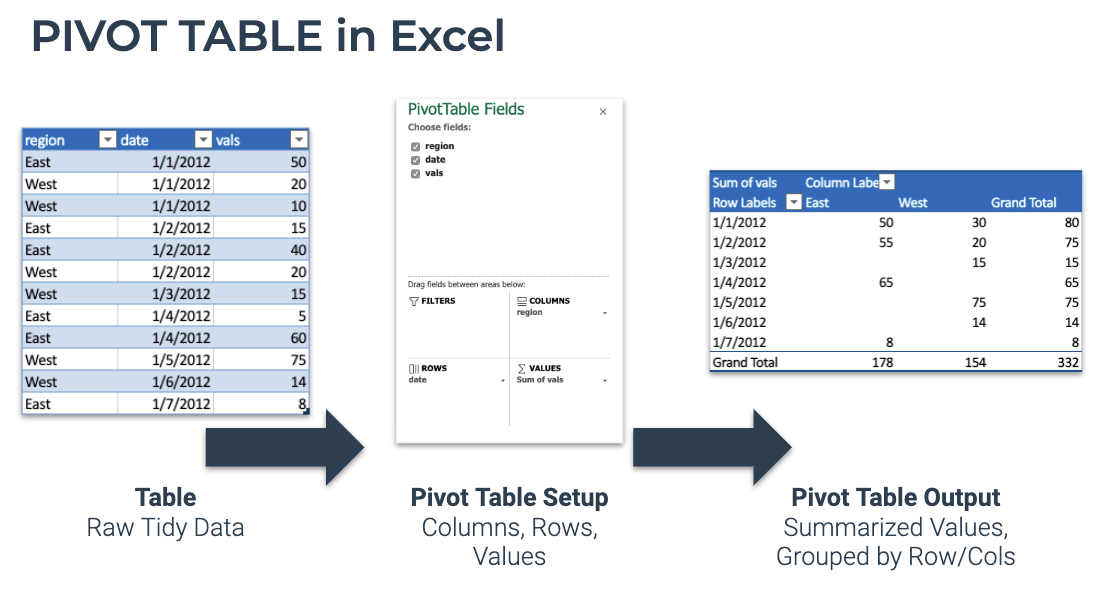
For those that may have never used the Excel Pivot Table before, the process goes something like this.
- Start with a raw table in “long” format where each row is a unique observation
- Use the Excel Pivot Table dialog to position fields into Columns, Rows, and Summarized Values
- The Pivot Table is returned with the data summarized into columns and rows
Excel Pivot Table is now in R
R Pivot Table
Excel’s Pivot Table now in R with pivot_table(). Let’s try it out.
First, let’s get some raw data. The FANG data set ships with tidyquant and represents the ouput of the tq_get(c("FB", "AMZN", "NFLX", "GOOG")) from 2013 to 2016. This is raw OHLCV data with adjusted stock prices downloaded from Yahoo Finance.
FANG
## # A tibble: 4,032 x 8
##    symbol date        open  high   low close    volume adjusted
##    <chr>  <date>     <dbl> <dbl> <dbl> <dbl>     <dbl>    <dbl>
##  1 FB     2013-01-02  27.4  28.2  27.4  28    69846400     28
##  2 FB     2013-01-03  27.9  28.5  27.6  27.8  63140600     27.8
##  3 FB     2013-01-04  28.0  28.9  27.8  28.8  72715400     28.8
##  4 FB     2013-01-07  28.7  29.8  28.6  29.4  83781800     29.4
##  5 FB     2013-01-08  29.5  29.6  28.9  29.1  45871300     29.1
##  6 FB     2013-01-09  29.7  30.6  29.5  30.6 104787700     30.6
##  7 FB     2013-01-10  30.6  31.5  30.3  31.3  95316400     31.3
##  8 FB     2013-01-11  31.3  32.0  31.1  31.7  89598000     31.7
##  9 FB     2013-01-14  32.1  32.2  30.6  31.0  98892800     31.0
## 10 FB     2013-01-15  30.6  31.7  29.9  30.1 173242600     30.1
## # … with 4,022 more rows
We can summarize this information with a Pivot Table using pivot_table(.rows, .columns, .values). First, I’ll take a look to see if there are any missing (NA) values. The only trick is to use a ~ in front of any calculations. All zeros is good.
FANG %>%
    pivot_table(
        .columns = symbol,
        .values  = ~ SUM(is.na(adjusted))
    ) %>%
    kable()
| AMZN |
FB |
GOOG |
NFLX |
| 0 |
0 |
0 |
0 |
Next, I’ll do some financial summarizations. I’d like to take a look at percentage returns by year and quarter. This is easy to do by using stacked functions with the c() operator on .columns and .rows.
FANG %>%
    pivot_table(
        .rows    = c(symbol, ~ QUARTER(date)),
        .columns = ~ YEAR(date),
        .values  = ~ (LAST(adjusted) - FIRST(adjusted)) / FIRST(adjusted)
    ) %>%
    kable()
| symbol |
QUARTER(date) |
2013 |
2014 |
2015 |
2016 |
| AMZN |
1 |
0.0356768 |
-0.1547856 |
0.2060807 |
-0.0680544 |
| AMZN |
2 |
0.0614656 |
-0.0530919 |
0.1723923 |
0.1956892 |
| AMZN |
3 |
0.1082595 |
-0.0299348 |
0.1703285 |
0.1538281 |
| AMZN |
4 |
0.2425300 |
-0.0223965 |
0.2979913 |
-0.1038196 |
| FB |
1 |
-0.0864286 |
0.1010785 |
0.0480561 |
0.1162199 |
| FB |
2 |
-0.0254603 |
0.0745768 |
0.0502020 |
-0.0153369 |
| FB |
3 |
1.0245869 |
0.1613283 |
0.0344034 |
0.1233033 |
| FB |
4 |
0.0838954 |
0.0192031 |
0.1507422 |
-0.1065466 |
| GOOG |
1 |
0.0980851 |
0.0017401 |
0.0441873 |
0.0041923 |
| GOOG |
2 |
0.0988279 |
0.0143170 |
-0.0406450 |
-0.0770892 |
| GOOG |
3 |
-0.0134815 |
-0.0091132 |
0.1659128 |
0.1116688 |
| GOOG |
4 |
0.2634837 |
-0.0736798 |
0.2414403 |
-0.0009578 |
| NFLX |
1 |
1.0571677 |
-0.0297393 |
0.1941594 |
-0.0702983 |
| NFLX |
2 |
0.1571014 |
0.2081494 |
0.5901917 |
-0.1345316 |
| NFLX |
3 |
0.3786783 |
-0.0463327 |
0.1027844 |
0.0194477 |
| NFLX |
4 |
0.1341568 |
-0.2214904 |
0.0792602 |
0.2062750 |
A few points:
- Collapsing - I just used functions to collapse the daily date by
YEAR() and QUARTER(). This essentially creates a new grouping variable that is a part of the date.
- Stacking - I stacked multiple grouping operations with the
c() operator: .rows = c(symbol, ~ QUARTER(date))
- Summarization Details - I added multiple function calls to get the Percentage Change in the
.values summarization operation. This is allowed as long as the result returns a single value.
- Tilde Required - For calculations (e.g.
~ YEAR(date)), I used the tilde (~) each time, which is required.
- Tilde Not Required - For bare column names with no calculation, a tilde (
~) is not required.
My Favorite Part of Pivot Tables in R
We can easily switch Pivot Tables to provide different levels of summarization. Now I’ll quickly change to returns by year. Notice I’m using a new summarization function, PCT_CHANGE_FIRSTLAST() to save me some typing.
FANG %>%
    pivot_table(
        .rows    = symbol,
        .columns = ~ YEAR(date),
        .values  = ~ PCT_CHANGE_FIRSTLAST(adjusted)
    ) %>%
    kable()
| symbol |
2013 |
2014 |
2015 |
2016 |
| AMZN |
0.5498426 |
-0.2201673 |
1.1907495 |
0.1772084 |
| FB |
0.9517858 |
0.4260647 |
0.3340983 |
0.1255136 |
| GOOG |
0.5495473 |
-0.0532416 |
0.4460024 |
0.0404130 |
| NFLX |
3.0014129 |
-0.0584587 |
1.2945491 |
0.1258640 |
✅ VLOOKUP
When I first started learning R, I couldn’t grasp how to merge / join data. It was very frustrating because I was used to Excel’s VLOOKUP function that pulled a value or a column of values as needed.
Excel VLOOKUP
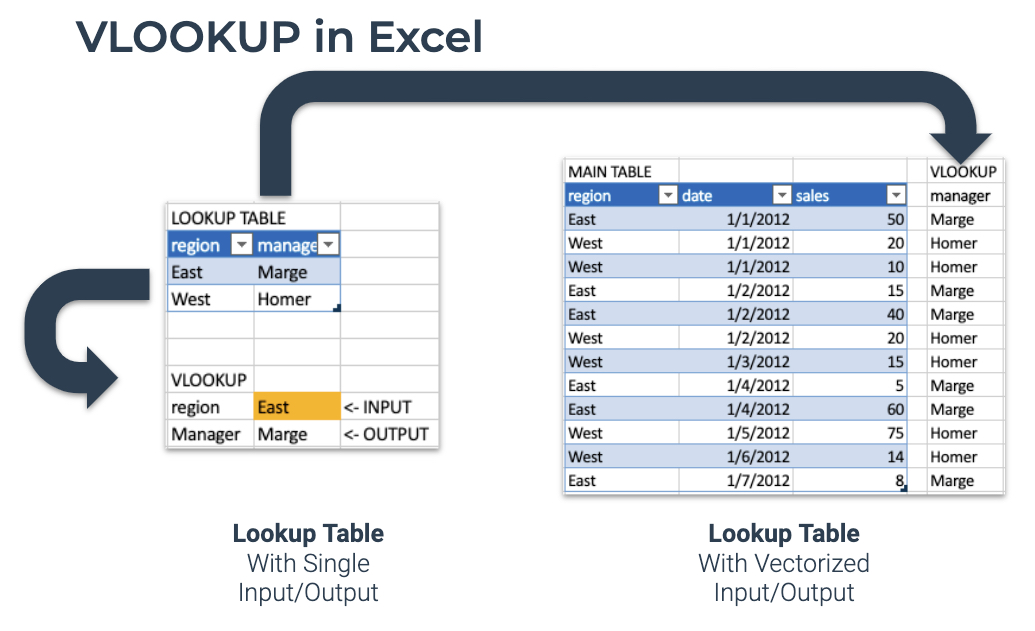
VLOOKUP is an Excel function to lookup and retrieve data from a specific column in table. Here’s how the process works in Excel.
- Start with a Lookup Table. Contains Key-Value pairs.
- Simple Case - Use a VLOOKUP to input a single value and output a single value.
- More Powerful Case - Use a VLOOKUP to add a column to an Excel Table.
Excel VLOOKUP() is now in R
R VLOOKUP
The most popular Excel Reference Function, VLOOKUP, is now in R as VLOOKUP(). It’s vectorized, which means we can use VLOOKUP() inside of dplyr::mutate().
Let’s replicate a VLOOKUP in R using the new VLOOKUP() function. First, let’s create a simple lookup table.
lookup_table <- tibble(
    stock   = c("FB", "AMZN", "NFLX", "GOOG"),
    company = c("Facebook", "Amazon", "Netflix", "Google")
)

lookup_table %>% kable()
| stock |
company |
| FB |
Facebook |
| AMZN |
Amazon |
| NFLX |
Netflix |
| GOOG |
Google |
Simple VLOOKUP Case
First, let’s mimic the “simple” case where we just want to lookup a Single Value.
VLOOKUP("AMZN", lookup_table, stock, company)
## [1] "Amazon"
So what happened? We supplied the string “AMZN”, and the VLOOKUP() function new to search the lookup_table matching the stock column and returning the company.
More Powerful VLOOKUP Case
Let’s try the more Powerful Case - pulling in a column of matched lookup values. We can do this by using the mutate() function from dplyr. This works because VLOOKUP() is vectorized.
FANG %>%
    mutate(company = VLOOKUP(symbol, lookup_table, stock, company))
## # A tibble: 4,032 x 9
##    symbol date        open  high   low close    volume adjusted company
##    <chr>  <date>     <dbl> <dbl> <dbl> <dbl>     <dbl>    <dbl> <chr>
##  1 FB     2013-01-02  27.4  28.2  27.4  28    69846400     28   Facebook
##  2 FB     2013-01-03  27.9  28.5  27.6  27.8  63140600     27.8 Facebook
##  3 FB     2013-01-04  28.0  28.9  27.8  28.8  72715400     28.8 Facebook
##  4 FB     2013-01-07  28.7  29.8  28.6  29.4  83781800     29.4 Facebook
##  5 FB     2013-01-08  29.5  29.6  28.9  29.1  45871300     29.1 Facebook
##  6 FB     2013-01-09  29.7  30.6  29.5  30.6 104787700     30.6 Facebook
##  7 FB     2013-01-10  30.6  31.5  30.3  31.3  95316400     31.3 Facebook
##  8 FB     2013-01-11  31.3  32.0  31.1  31.7  89598000     31.7 Facebook
##  9 FB     2013-01-14  32.1  32.2  30.6  31.0  98892800     31.0 Facebook
## 10 FB     2013-01-15  30.6  31.7  29.9  30.1 173242600     30.1 Facebook
## # … with 4,022 more rows
What I’m Most Excited About Using VLOOKUP for
I actually can’t wait to use VLOOKUP() in Shiny apps. There are many times when I want the user to input a variable (a Key), and internally on the Shiny Server convert it to something more useful in a table (a Value). I showcased this technique LIVE in Learning Lab 30 - Shiny + Tidyquant Apps. Register Here to attend new Learning Labs (FREE).
✅ Summarizing “IFS” Functions
One of the functions that many Excel Users (including myself) become accustomed to is filtering summations, which I refer to as “IFS” functions. These are very handy at quickly filtering on conditions while aggregating your data.
Excel Sum-If’s (and friends)
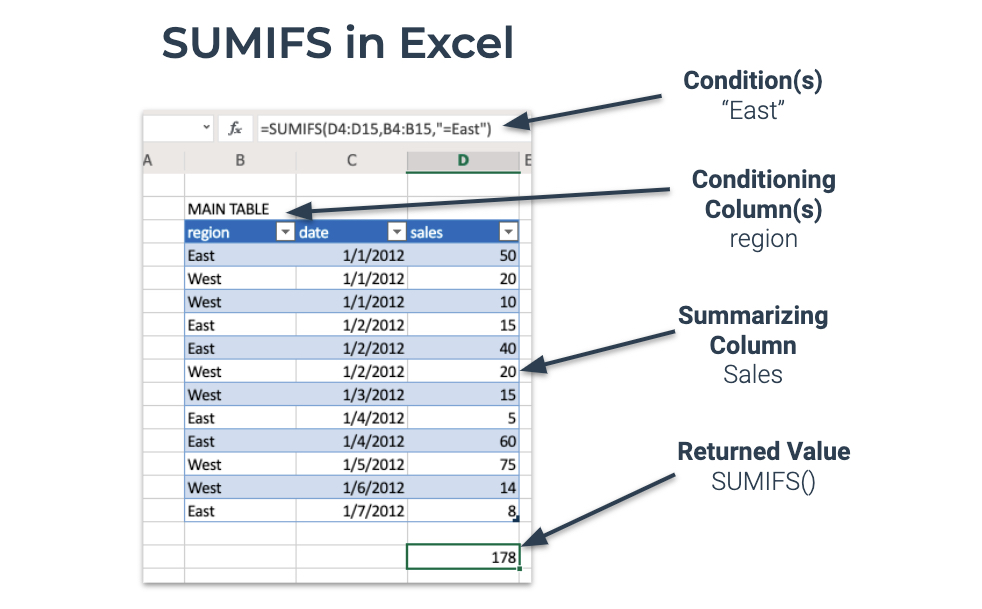
Excel has SUMIFS(), COUNTIFS(), AVERAGEIFS(), and several more Summarizing “IFS” Functions. Here’s how they work:
- Develop a Condition to summarize: Sum Sales when Region = “East”
- Use one or more Conditioning Column(s) to develop a logical cases (e.g. region = “East”)
- Use a Summarizing Column to aggregate (e.g. SUMIFS(sales))
- Put it together returning a single value: SUMIFS(sales, region, “=East”)
Excel SUMIFS is now in R as SUM_IFS()
R Sum-If’s (and friends)
R now has a full suite of “IFS” functions. We can test them to get the basics.
SUM_IFS()
Summarizing things.
SUM_IFS(x = 1:10, x > 5)
## [1] 40
COUNT_IFS()
Counting things.
COUNT_IFS(x = letters, str_detect(x, "[a-c]"))
## [1] 3
Used in tidyverse
Let’s use COUNT_IFS() to count how many times high trade volume occurs in 2015. We can accomplish this shockingly easily by combining summarise() and the COUNT_IFS() function.
FANG %>%
    group_by(symbol) %>%
    summarise(
        high_volume_in_2015 = COUNT_IFS(volume,
                                        year(date) == 2015,
                                        volume > quantile(volume, 0.75))
    )
## # A tibble: 4 x 2
##   symbol high_volume_in_2015
##   <chr>                <int>
## 1 AMZN                    62
## 2 FB                      15
## 3 GOOG                    19
## 4 NFLX                    54
✅ 100+ New Excel Functions
100+ Excel-based statistical, date/date-time, and financial math functions have been ported to R. The things I’m most excited about are Business Calendar calculations:
-
Business Holiday Calendars - Solves a major pain point with business date calculations. Integrations with lubridate and timeDate have enabled Holiday Date Sequences to automate calculation of Net Work Days and working periods.
-
Financial Calculations - I’ve ported NPV, IRR, FV, PV, PMT, and RATE. Then I realized that there’s an amazing package called FinCal. The plan is to leverage FinCal going forward.
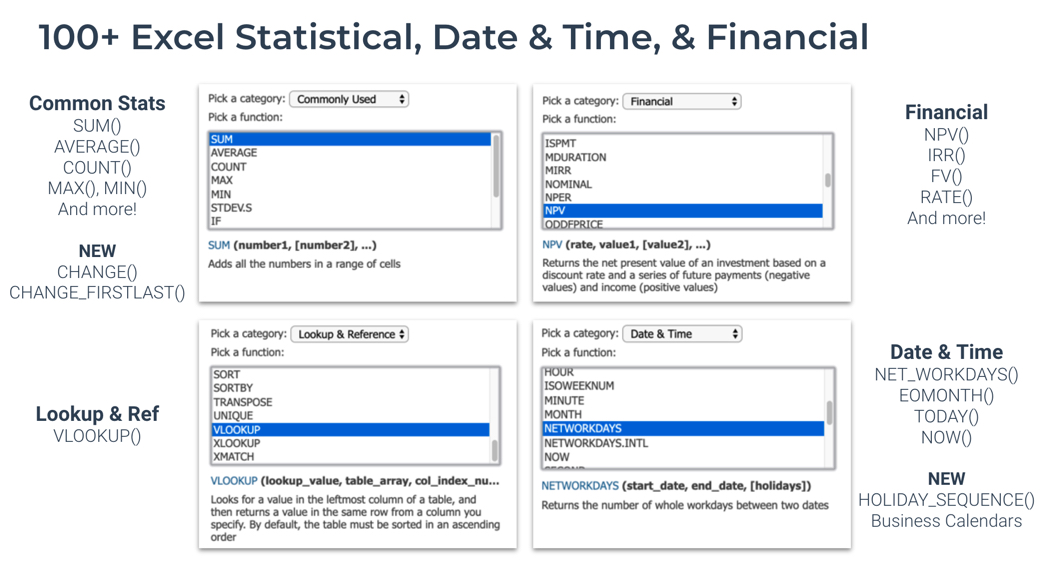
100+ Excel Functions now in R
Business Calendars: Factoring in Business Holidays made Easy
Businesses rely on their ability to accurately predict revenue. A key driver is whether or not the business is open (shocker!). For a business that’s closed on weekends and standard business holidays, it’s now super easy to calculate something simple like NET_WORKDAYS().
Net Working Days Example
When run with just a start and end, it returns the number of days excluding weekends.
NET_WORKDAYS("2020-01-01", "2020-07-01") # 131 Skipping Weekends
## [1] 131
But what about holidays? We have a new function called HOLIDAY_SEQUENCE() to calculate the business holidays between two dates (thanks to timeDate!).
HOLIDAY_SEQUENCE("2020-01-01", "2020-07-01", calendar = "NYSE")
## [1] "2020-01-01" "2020-01-20" "2020-02-17" "2020-04-10" "2020-05-25"
Now we can simply remove these dates from the Net Workdays calculation. We get 126 days removing standard business holidays.
NET_WORKDAYS("2020-01-01", "2020-07-01",
             holidays = HOLIDAY_SEQUENCE("2020-01-01", "2020-07-01",
                                         calendar = "NYSE")) # 126 Skipping 5 NYSE Holidays
## [1] 126
✅ NEW API Integration
The Tingo API is a popular free and open source for stock prices, cryptocurrencies, and intraday feeds from the IEX (Investors Exchange). I’m planning integration via the riingo package.
First, get a Tiingo API Key. Then setup your API Key using tiingo_api_key().
tiingo_api_key("<your-api-key>")
We can use tq_get() to interface with the Tiingo API. Here I’m getting High Frequency Time Series at 5-Minute Intervals via Tiingo’s IEX data feed.
tq_get(c("AAPL", "GOOG"),
       get    = "tiingo.iex",
       from   = "2020-01-01",
       to     = "2020-01-15",
       resample_frequency = "5min")
## # A tibble: 1,578 x 6
##    symbol date                 open  high   low close
##    <chr>  <dttm>              <dbl> <dbl> <dbl> <dbl>
##  1 AAPL   2020-01-02 14:30:00  296.  297.  295.  297.
##  2 AAPL   2020-01-02 14:35:00  297.  298.  297.  297.
##  3 AAPL   2020-01-02 14:40:00  297.  298.  297.  297.
##  4 AAPL   2020-01-02 14:45:00  297.  297.  297.  297.
##  5 AAPL   2020-01-02 14:50:00  297.  297.  297.  297.
##  6 AAPL   2020-01-02 14:55:00  297.  298.  297.  298.
##  7 AAPL   2020-01-02 15:00:00  298.  298.  298.  298.
##  8 AAPL   2020-01-02 15:05:00  298.  298.  298.  298.
##  9 AAPL   2020-01-02 15:10:00  298.  298.  297.  297.
## 10 AAPL   2020-01-02 15:15:00  297.  298.  297.  297.
## # … with 1,568 more rows
Learn more by visiting the help documentation for ?tq_get.
Summary
There’s a ton to learn. So much that I couldn’t possibly go over all of the new features in tidyquant v1.0.0 in this article. And, most importantly, you haven’t seen tidyquant tackle some real messy business problems.
I have good news. I taught all the Excel Features in Learning Lab 30 - Shiny + Tidyquant for Finance Apps (Register Here to attend new Learning Labs, It’s Free), I tackled some real financial data, showing how we can do really important things like:
- Perform Portfolio Analysis
- Use NEW Excel Features
- Build Shiny Apps with Pivot Tables, VLOOKUPs and SUMIFS.
I give away a ton of free R training. It’s a program called Learing Labs. Sign up here. 👇