Marketing Analytics - Fast-Food Promotion Effectiveness
Written by David Curry
Summary
A fast-food chain plans to add a new item to their menu. However, they are undecided on three possible marketing campaigns for promoting the new item.
The new item is introduced at several randomly selected markets to determine which promotion has the best sales performance. Weekly sales for each promotion are recorded for the first four weeks.
To solve this marketing problem, I will be using the Business Science Problem Framework (BSPF) from Business Science University. The BSPF is a methodology for using data science to solve problems in a business context.
This marketing analysis uses marketing campaign data from IBM Watson, found here.
Other articles you might like:
Table of Contents
- Business Objective
- Campaign Data Analysis
- Data Summary
- Data Analysis
- Predict Campaign Performance
- Model Interpretability
- Business Results
- Conclusion
I. Business Objective
The fast-food chain ran a promotion campaign to determine the best market for their new menu item. Our objective is to analyze the marketing promotion data to determine which marketing promotion has the best sales performance for the new item.
II. Campaign Data Analysis
Data analysis is performed to find relationships to help determine which marketing promotion was the most effective.
10-Week System: Data Science Education For Enterprise

Learn to analyze data, create machine learning models and solve business problems with our DS4B 201-R Course.
- Learn by following a proven data science framework
- Learn
H2O & LIME for building High-Performance Machine Learning Models
- Learn Expected Value Framework by connecting Data Science to ROI
- Learn Preprocessing with
recipes
- Learn how to build a Recommendation Algorithm from scratch
- All while learning
R coding!
A. Data Summary
The data consists of 7 variables:
- Market ID - Unique identifier for market.
- Market Size - Size of market area by sales (Small, Medium, Large).
- Location ID - Unique identifier for store location.
- Age - Age of store in years.
- Promotion - One of three promotions that were tested.
- Week - One of four weeks when the promotions were run.
- Sales - Sales amount for a specific LocationID, Promotion and week.
For the variables Market ID, Location ID and Promotion are coded with numbers, therefore you will see references to numbers such as Market ID 3.
There are 548 records (observations), each representing the sales for a given Week, Promotion, and Location.
B. Data Analysis
This section is a walkthrough of the data analysis in order to find relationships that may help with solving the business objective.
1. What is the distribution of sales compared to the other variables?
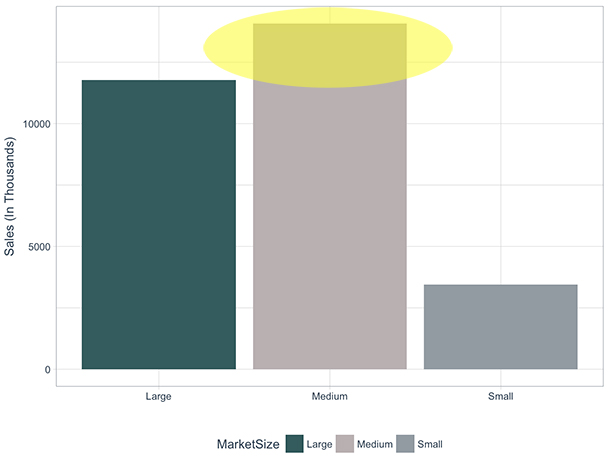
Sales by Market Size
Most sales were made in Medium and Large markets.
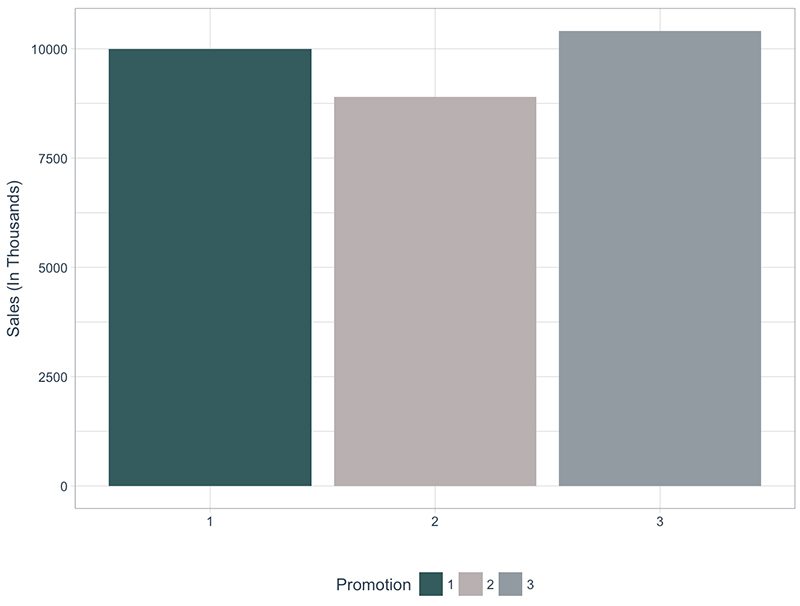
Sales are mostly even across campaign Promotion type.
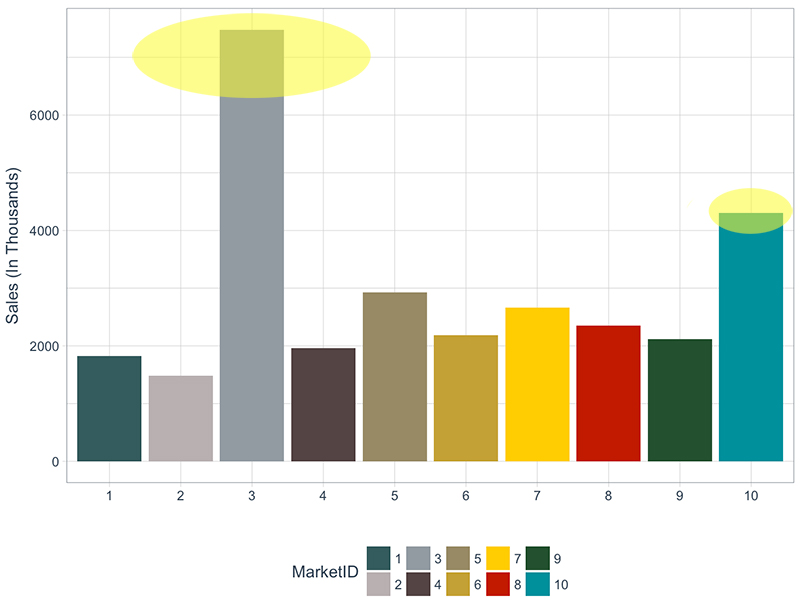
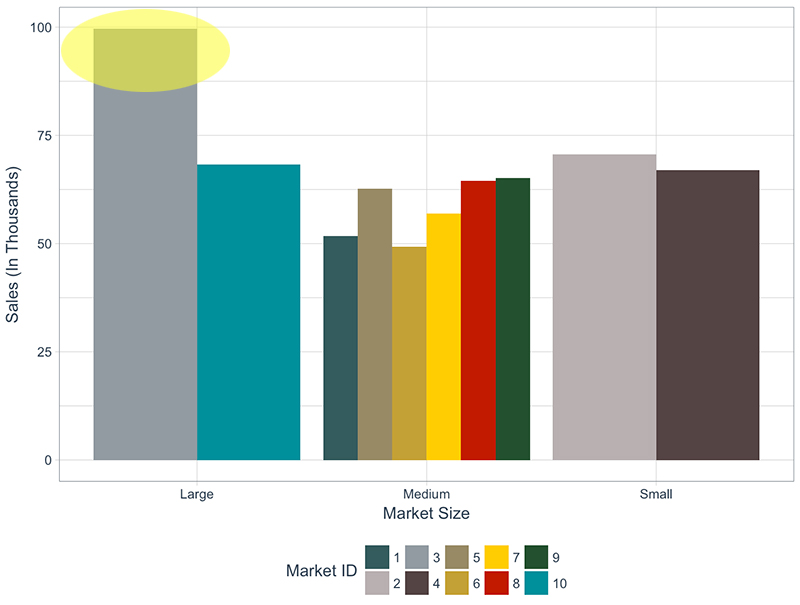
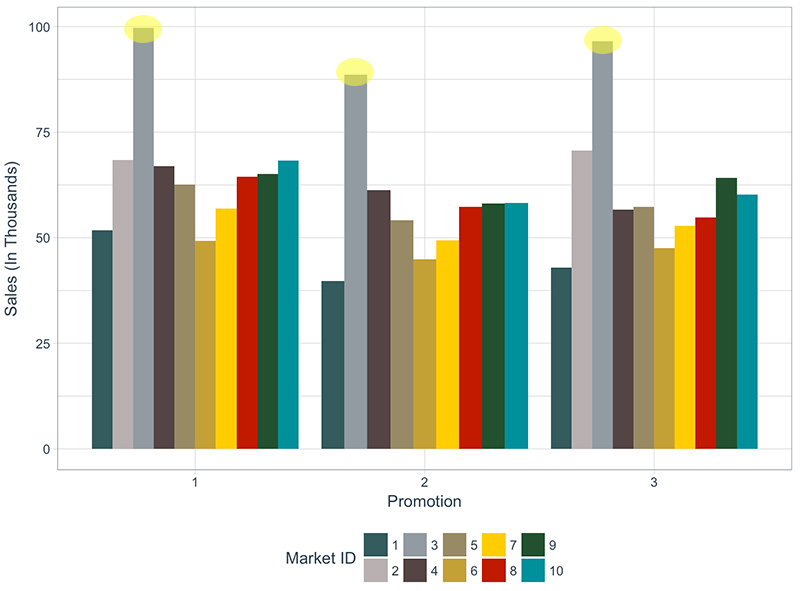
Sales by Market ID
Market 3 has outperformed all other markets with over $6,000,000 in sales. Market 10 in second with just over $4,000,000 in sales.
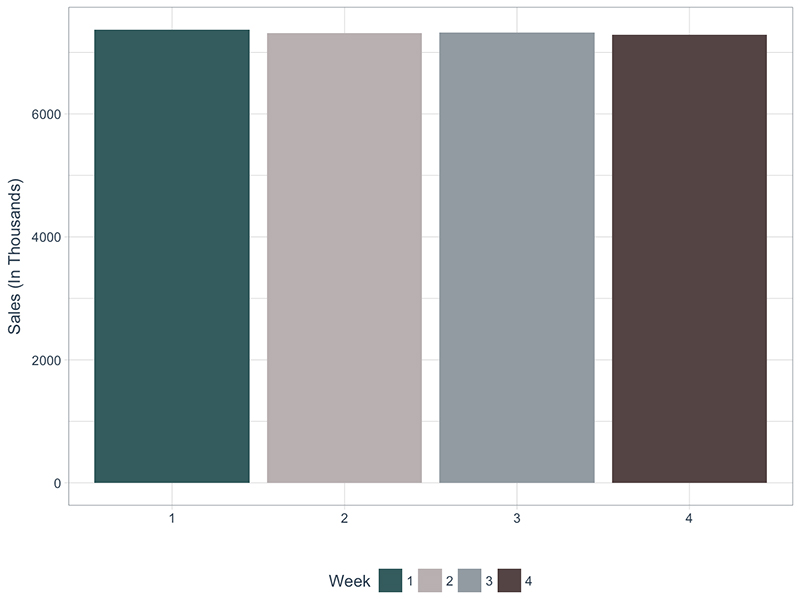
Sales by Week
Sales are mostly even across each Week the promotion was run.
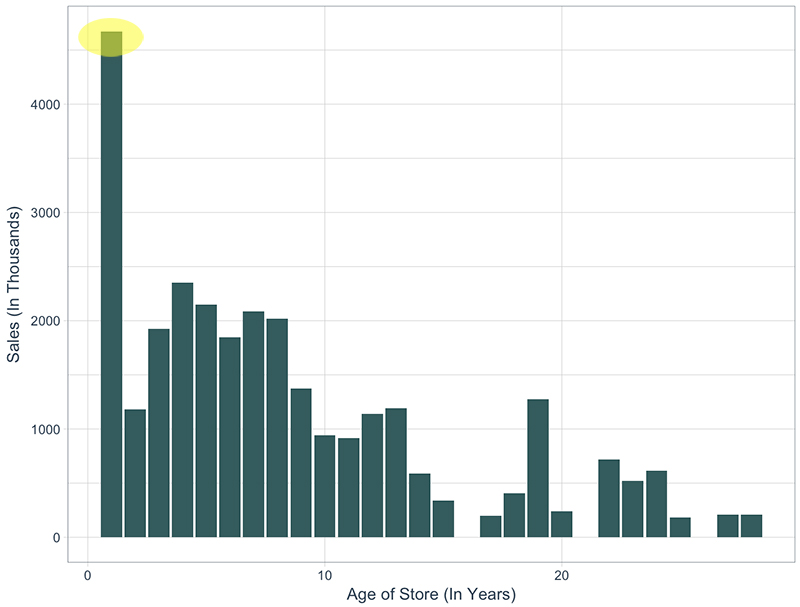
Sales by Age of Store
One-year-old stores outperformed other age stores. Overall, newer stores produced more revenue than older stores.
2. Market Size, Market ID, and Age of Store Comparisons
From the Sales comparisons above, Market Size, Market ID and Age of Store seem to be important variables for campaign sales performance. The following analyzes variable comparisons with Market Size, Market ID, Age of Store and Promotion.
Sales by Market Size and MarketID
Market 3 in the Large Market performed the best.
For each promotion, Large market size outperformed the other market sizes.
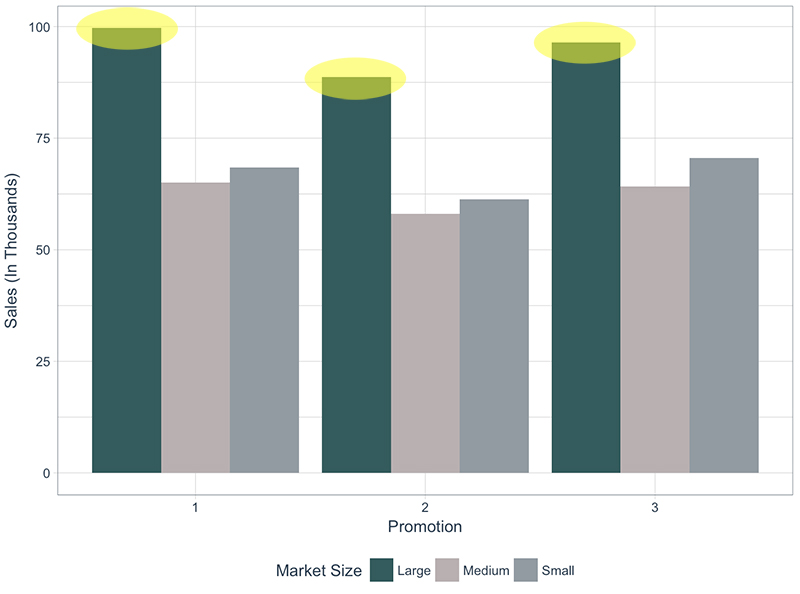
This confirms the ‘Sales by Market ID’ chart from above. Market ID 3 outperforms all other markets across all promotions.
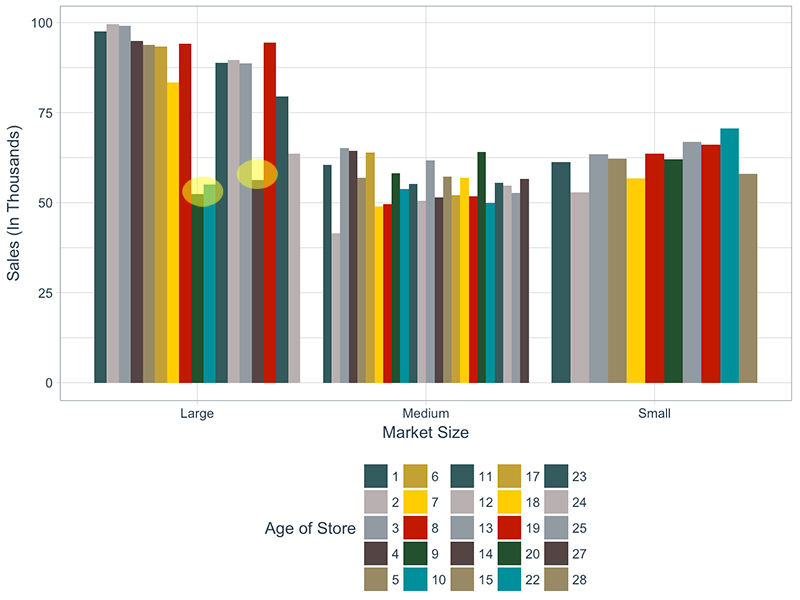
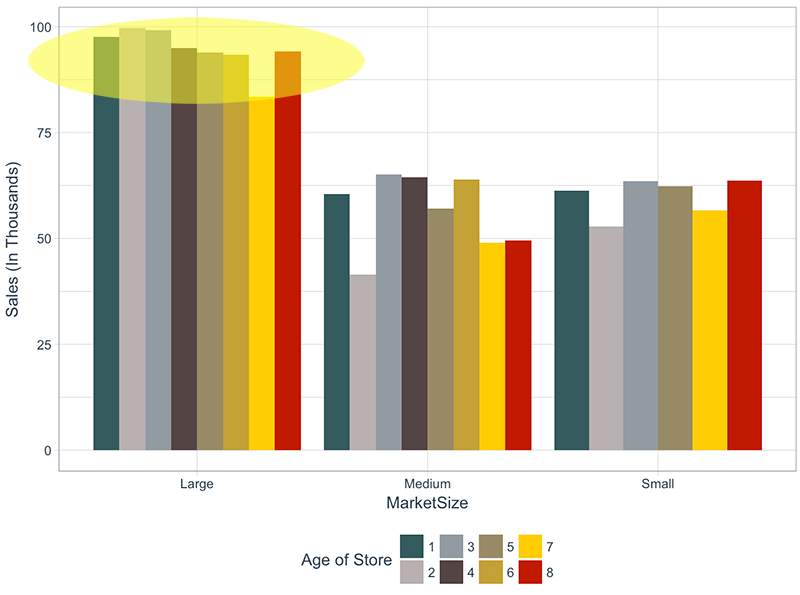
Sales by Market Size and Age of Store
This chart is messy, but it is another look at sales performance by Age of Store, with Market Size.
Large market stores around 9,10,18 years underperformed versus other stores in the same market size.
10-Week System: Data Science Education For Enterprise
Learn to analyze data, create machine learning models and solve business problems with our DS4B 201-R Course.
- Learn by following a proven data science framework
- Learn
H2O & LIME for building High-Performance Machine Learning Models
- Learn Expected Value Framework by connecting Data Science to ROI
- Learn Preprocessing with
recipes
- Learn how to build a Recommendation Algorithm from scratch
- All while learning
R coding!
We created a machine learning model to predict sales. Providing the variables, Market ID, Market Size, Location ID, Age of Store, Promotion and Week, we are able to predict total sales.
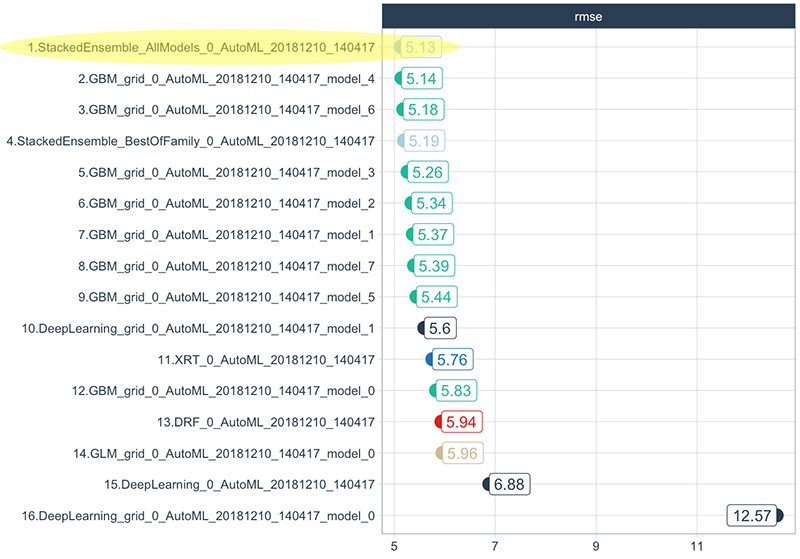
A group of models was created using automated machine learning. Below is a model leaderboard displaying models in order of predictive accuracy. The accuracy is measured on the metric root mean squared error (RMSE). The Stacked Ensemble model performs best, with an RMSE of 5.13.
With continued fine-tuning, the RMSE may be lowered further, creating an even more accurate model.
A. Model Interpretability
Automated machine learning is a good way to automatically generate high-performing models. However, it is important to inspect model details to understand what makes the model good.
The following is a graphical method used to highlight features the model interprets as important to predicting Sales.
On the left (Y-axis) are the variables (features), with some features grouped by numeric ranges. The bottom (X-axis) represents 80 observations from test data used to test the model’s performance. The more green a features are, the more important they are in predicting Sales.
For example, for test cases 25 to 50, Market ID 3, Market Size Large and Location ID numbered below 218 are good features for prediction.
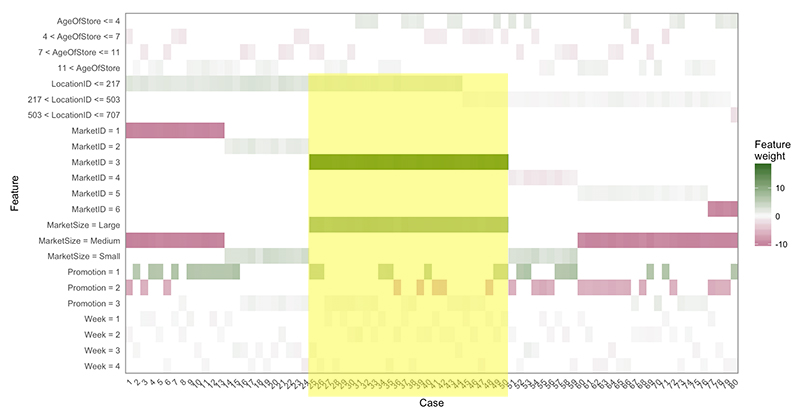
This method of interpretability allows us to communicate what the machine learning model is doing behind the scenes.
IV. Business Results
Our goal is to determine which promotions generate the most sales for the new fast-food item. Based on our analysis, machine learning model, and model interpretability, we determined the following:
- Large Market sales outperform other markets by approximately 40%
- Newer stores have better sales performance than older stores.
- All promotions performed well with Market ID 3.
- Promotions are mostly even, with Promotion 1 having a slight edge in the Large market.
For maximum sales performance, we recommend targeting the new item with Promotion 1, in the Large Market, at stores less than 9 of age.
Verifying Large Market stores under 9 years of age - the chart below confirms Large Market stores under 9 years of age outperform the other market stores:
V. Conclusion
In this marketing analysis, we used promotion campaign data from a fast-food business to determine which promotion produced the most sales. We determined all promotions are close in performance, but the market size and age of store will affect the promotion’s sales performance.
Knowing which locations to promote the new item will allow the fast-food business to target specific locations and maximize sales.
About the Author:
David Curry
Founder, Sure Optimize
[email protected]
ROI-focused Marketing Analytics and Digital Marketing.