explore: simplified exploratory data analysis (EDA) in R
Written by Matt Dancho
When I began applying data science to the company I worked for in 2015, exploratory data analysis (the critical process for performing initial investigations to find important relationships in my data, cleaning my data, spotting anomalies, and checking my assumptions through data visualization) would take me any where from 1 day to 1 week.
It was an important step. But, I wanted to get to modeling (and machine learning) as efficiently as possible because that’s where I could get the deep insights that drove my business. In my mind, EDA was a time consuming process with few tools to help other than basic plotting utilities and a lot of grit. And EDA took a lot of code.
So fast-forward to today. I’m happy to say that I’ve stumbled across a new R package that transforms what used to take me 1 day of work into minutes of enjoyable introductory insight-gathering.
What R package is it? It’s called explore. And I want to share it with you so you can do EDA in under 10-minutes. Here’s what you learn in this R-Tip:
- My 3-Step Process For Exploratory Data Analysis
- How to make a Shiny Exploratory Data Analysis (EDA) App in seconds with
explore
- BONUS: How to use the Shiny EDA App to analyze the 3 most important plots.
SPECIAL ANNOUNCEMENT: AI for Data Scientists Workshop on December 18th
Inside the workshop I’ll share how I built a SQL-Writing Business Intelligence Agent with Generative AI:

What: GenAI for Data Scientists
When: Wednesday December 18th, 2pm EST
How It Will Help You: Whether you are new to data science or are an expert, Generative AI is changing the game. There’s a ton of hype. But how can Generative AI actually help you become a better data scientist and help you stand out in your career? I’ll show you inside my free Generative AI for Data Scientists workshop.
Price: Does Free sound good?
How To Join: 👉 Register Here
R-Tips Weekly
This article is part of R-Tips Weekly, a weekly video tutorial that shows you step-by-step how to do common R coding tasks.
Here are the links to get set up. 👇
This Tutorial Is Available In Video
I have a companion video tutorial that shows even more secrets (plus mistakes to avoid). And, I’m finding that a lot of my students prefer the dialogue that goes along with coding. So check out this video to see me running the code in this tutorial. 👇
What Is Exploratory Data Analysis?
Exploratory Data Analysis (EDA) is how data scientists and data analysts find meaningful information in the form of relationships in the data. EDA is absolutely critical as a first step before machine learning and to explain business insights to non-technical stakeholders like executives and business leadership.
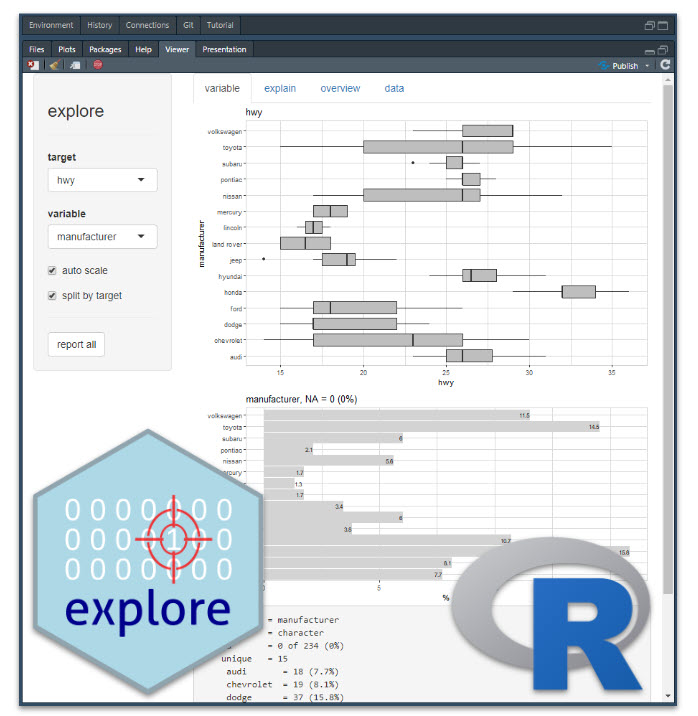
Make exploratory data analysis visuals with explore
What Do I Make In This R-Tip?
By the end of this R-Tip, you’ll make this exploratory data analysis report with 7 exploratory plots. Perfect for impressing your boss and coworkers! (Nice EDA skills)
Don't forget to get the code.
Thank You Developers.
Before we dive into explore, I want to take a moment to thank the data scientist and developer of explore, Roland Krasser. Thank you for making this great R package!
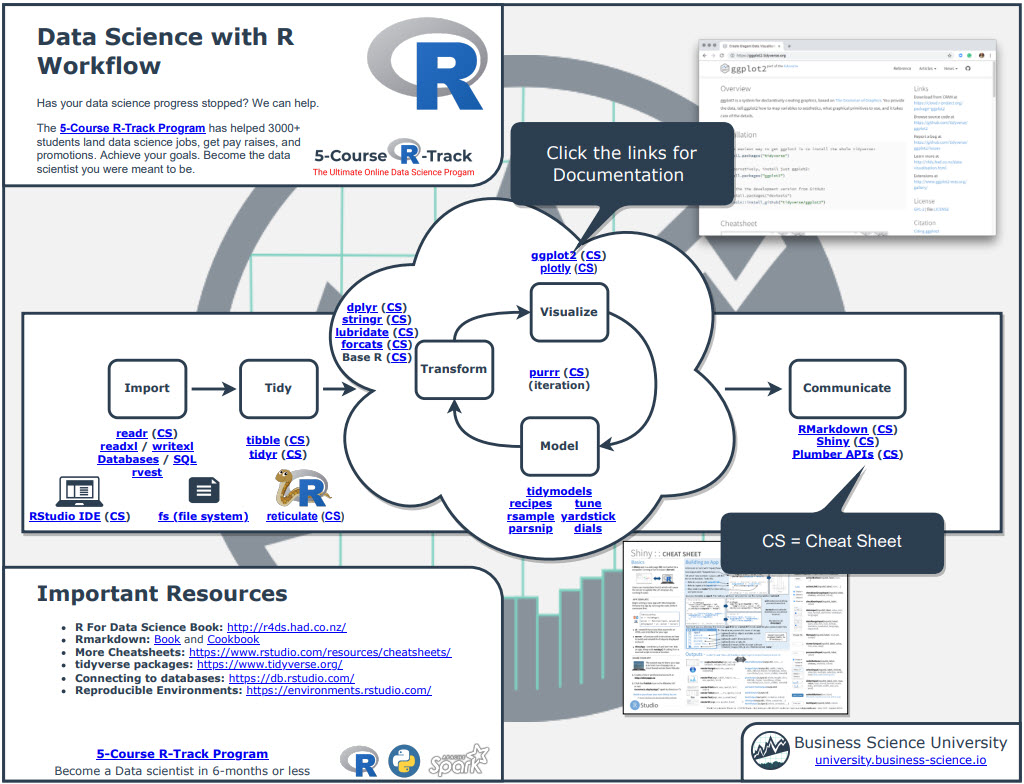
My 3-Step EDA Process
It can be confusing on which EDA R packages to use. So I’ll fill you in on what I actually use in my process. And I’ll share where I see explore fitting into my process specifically for bivariate analysis. But I also use 2 other R packages for EDA, namely DataExplorer and correlationfunnel.
1. DataExplorer
If you follow my R-Tips or are a student in my R-Track courses, you might have seen me use DataExplorer, one of my favorite all-time packages for Exploratory Data Analysis. Don’t worry, if you haven’t you can get up to speed quickly (You can snag my DataExplorer process here.)
Full disclosure, I still use DataExplorer in all of my EDA scripts. The automated data exploration report is just so comprehensive.
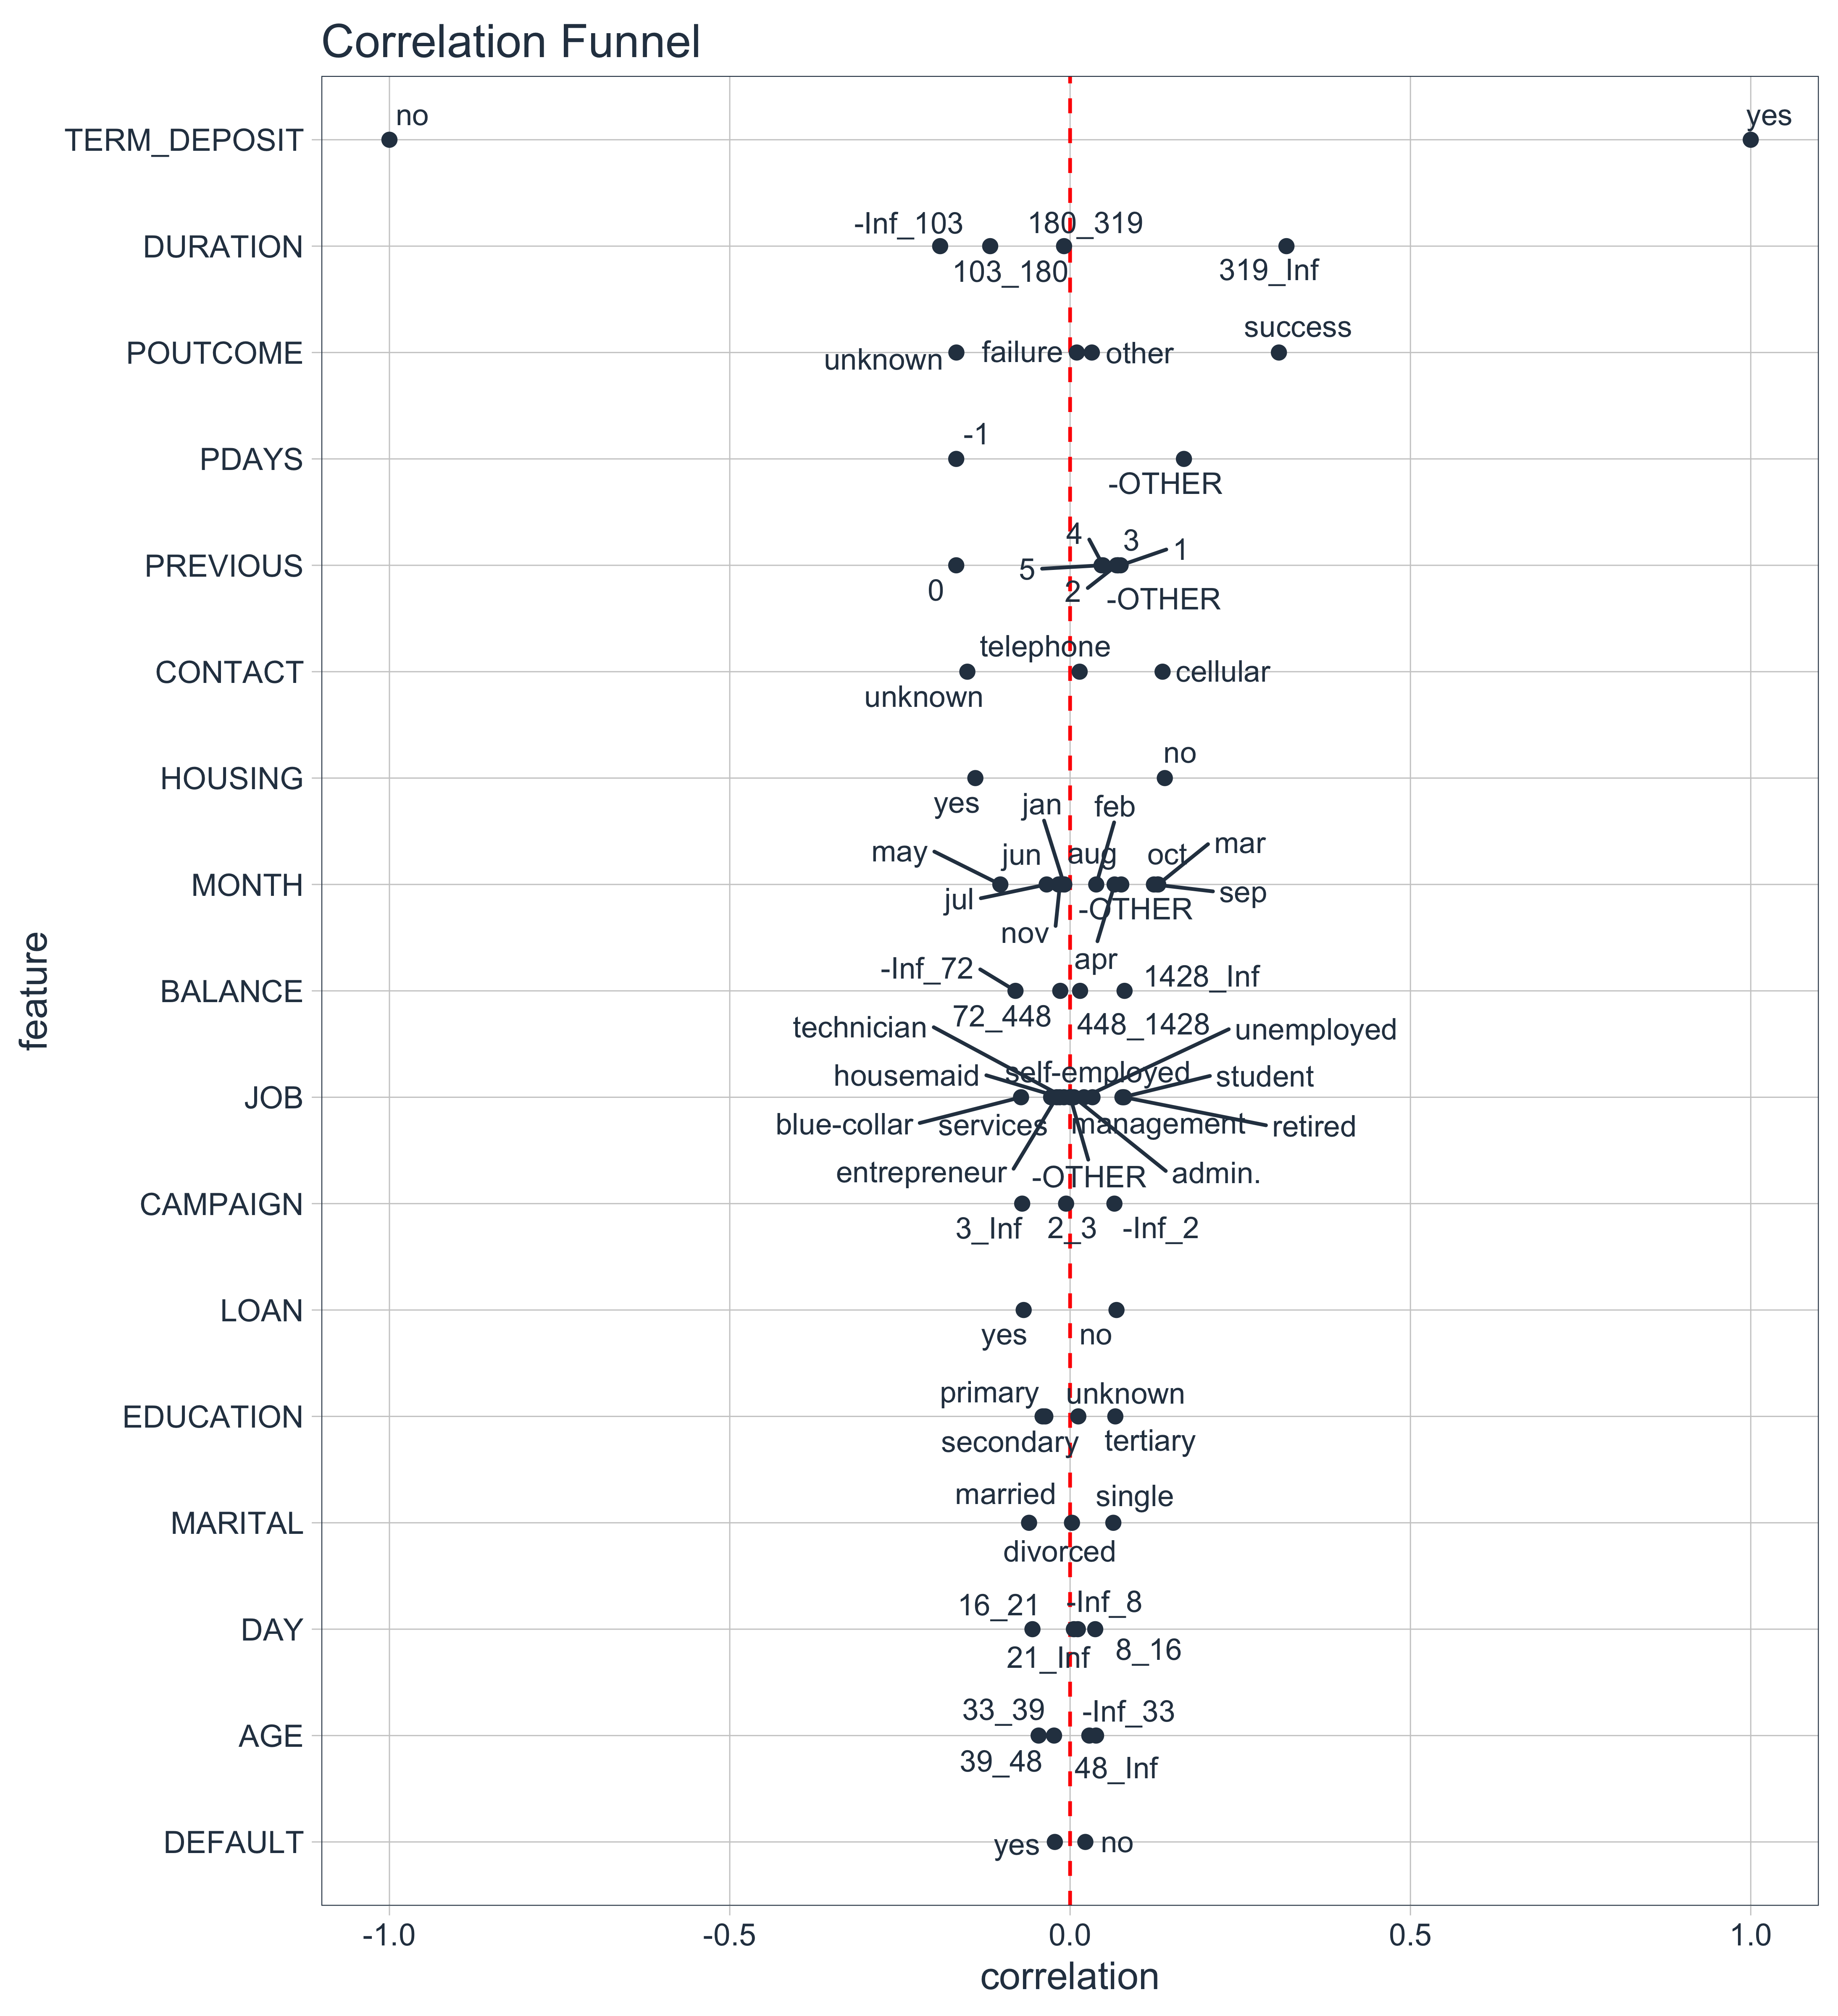
2. correlationfunnel
Next, I use one another R package for EDA. It’s my own correlationfunnel R package. The correlationfunnel package tells me which features to look at so I don’t waste time on bad comparisons. I introduce my correlationfunnel here.
3. Explore
As of this tutorial, I’m loving the explore package’s interactive approach to bivariate analysis with a Shiny App. This allows me to compare multiple features quickly without spending a lot of time.
Now that you have my EDA process, I want to give you…
My Cheat Sheet For My Top 100 R Packages
The next thing you’re going to need is to have access to all of the R packages that I use regularly in my data analysis projects.
Why?
Even I forget which R packages to use from time to time. And this cheat sheet saves me so much time. Instead of googling to filter through 20,000 R packages to find a needle in a haystack. I keep my cheat sheet handy so I know which to use and when to use them. Seriously. This cheat sheet is my bible.
Once you download it, head over to page 3 and you’ll see several R packages I use frequently just for Exploratory Data Analysis.
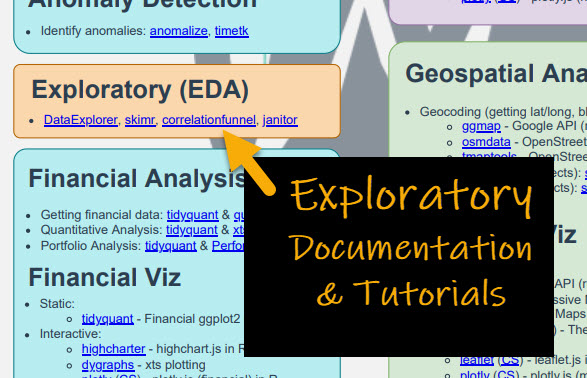
And you get the same guidance which is important when you want to work in these fields:
- Machine Learning
- Time Series
- Financial Analysis
- Geospatial Analysis
- Text Analysis and NLP
- Shiny Web App Development
So steal my cheat sheet. It will save you a ton of time.
What is Bivariate Analysis?
A key reason I like explore is the concept of bivariate analysis. Or the ability to quickly compare two variables - Typically a Predictor and a Response.
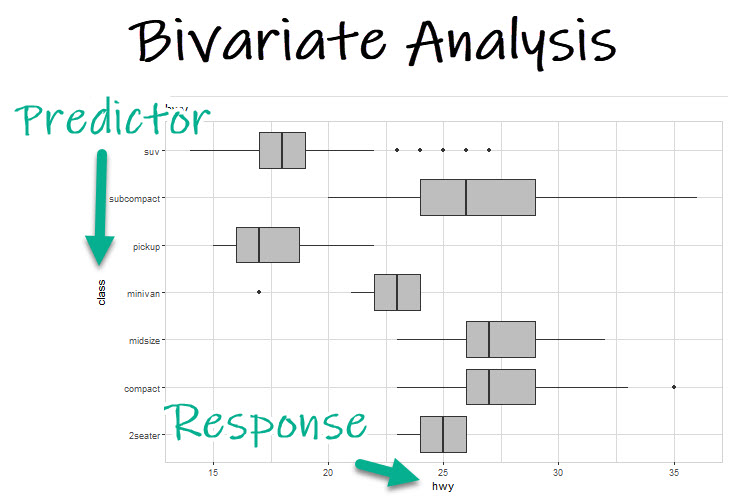
The Predictor
The predictor is the thing that we believe affects the response or outcome. In this case I believe the Class of the vehicle (whether its a Chevy S10 Pickup vs Audi A4 Compact) will have an effect on the fuel economy (how many miles per gallon).
The Response (Our Target)
In most business cases, the response is our target. It’s the thing we are after. In this scenario, I want to know what is going to happen to Fuel Economy (Highway MPG) when I change things like class of the vehicle (compact vs pickup), size of the engine (displacement), and so on.
How can we speed up bi-variate analysis?
Bivariate analysis is time consuming. It’s probably 30% of data exploration. To speed it up, simply follow my process:
- Step 1: Use DataExplorer to get a sense of the data. (DataExplorer is covered here)
- Step 2: Use correlationfunnel to find the most important features vs a target (Correlation funnel is covered here)
- Step 3: Use explore to explore the relationships between important features and the target that
correlationfunnel identified in Step 2 (Discussed today)
OK, so now that we have a process, let’s focus on the explore package from Step 3. Be sure to check out the other tutorials for Steps 1 and 2 in my process (as I won’t be covering those here).
Tutorial: Exploratory Data Analysis with explore
One of the coolest features of explore is the ability to create an Shiny Exploratory App in 1 line of code. This automates:
- Variable and Interaction Analysis (Bivariate Analysis)
- Explanations (with Decision Tree Plot)
Ultimately, this saves the analyst/data scientist SO MUCH TIME.
Focus for this tutorial
I’m constantly doing bi-variate analysis. So that’s what I’m focusing on here. In the YouTube Video I show off the decision tree explanations and some other cool functionality like how to get bivariate plots and make reports with explore, so check the video out if you want to discover more.
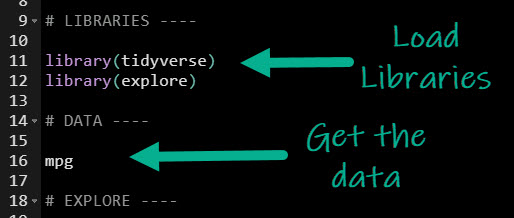
Step 1: Load the libraries and data
To get set up, all we need to do is load the following libraries and data.
Get the code.
We’ll use the mpg dataset, which has data on 234 vehicle models.
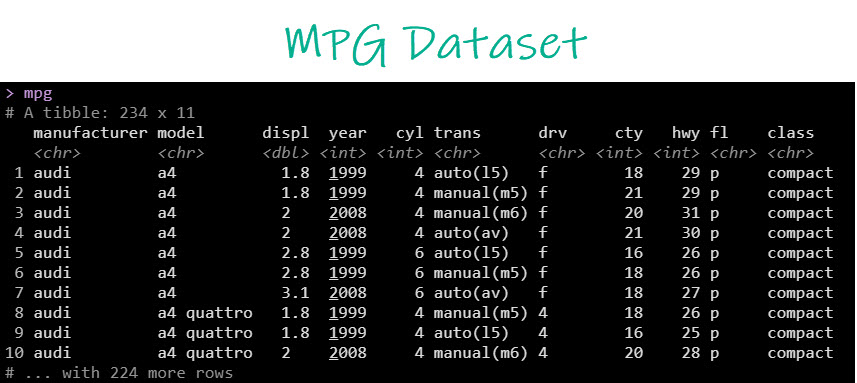
With data in hand, we are ready to create the automatic EDA report. Let’s explore!
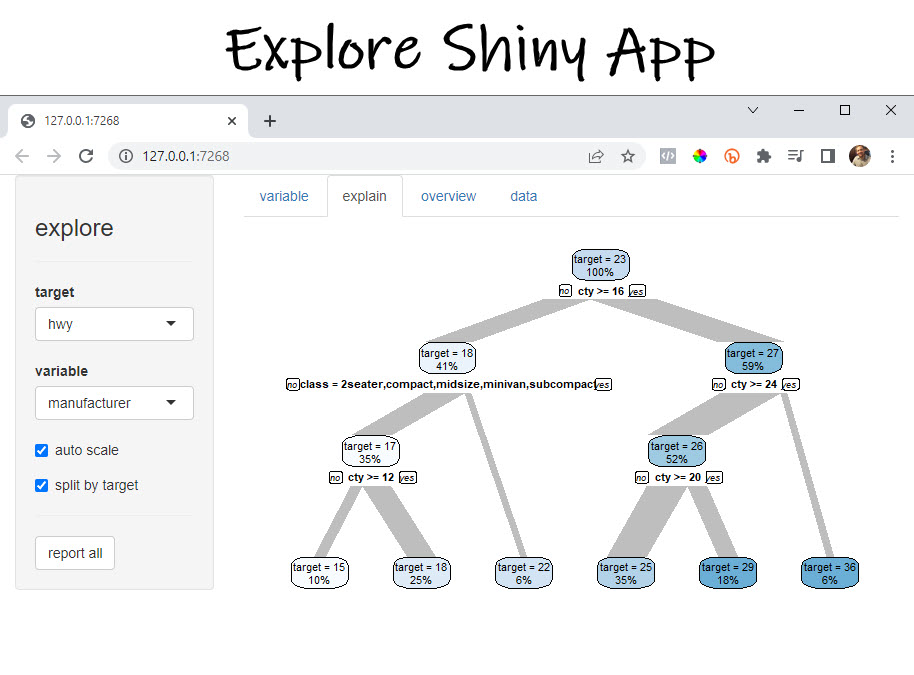
Step 2: Shiny EDA App
Next, use explore() to make our EDA shiny app.
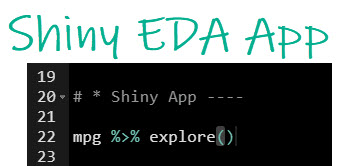
Get the code.
This produces an automatic Shiny EDA App that covers all of the important aspects that we need to analyze in our data! It’s that simple folks.
The shiny app is great, but the next thing you’re probably wondering is how the heck am I going to use this report.
That’s why I want to show you…
BONUS: How To Do Bivariate Analysis with the Shiny EDA App
As an extra special bonus, I figured I’d teach you not only how to make the Shiny EDA App BUT how to use the app too. Here’s how to get the most out of your automatic EDA analysis tool. If you’d like to get the code to produce the individual plots, just sign up for my FREE R-tips codebase. You’ll get all the code sent to your email plus more R-Tips every week.
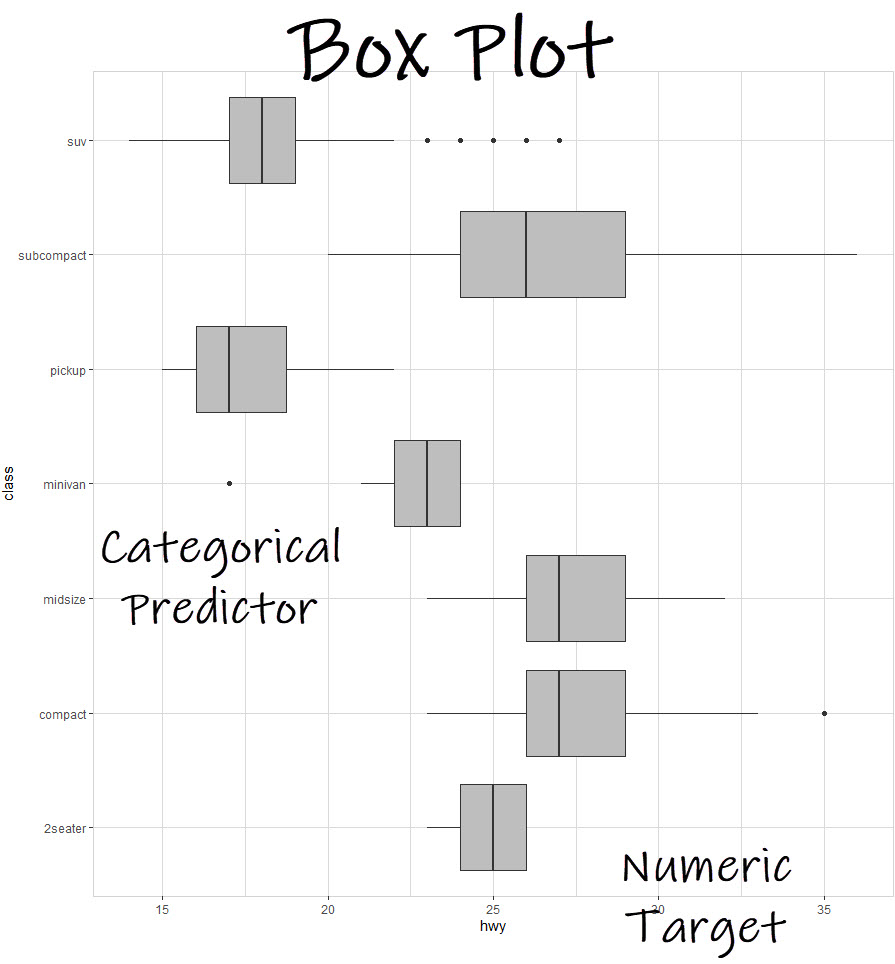
1. Box Plot (Numeric Target + Categorical Predictor)
Get the code.
The first plot we get is a box plot, which is when we compare a numeric target and a categorical predictor. The box plot helps us see which categories pull fuel economy up and down.
Business Insights:
- Pickups and SUVs tend to pull highway fuel economy down
- Compact and midsize have the highest fuel economy
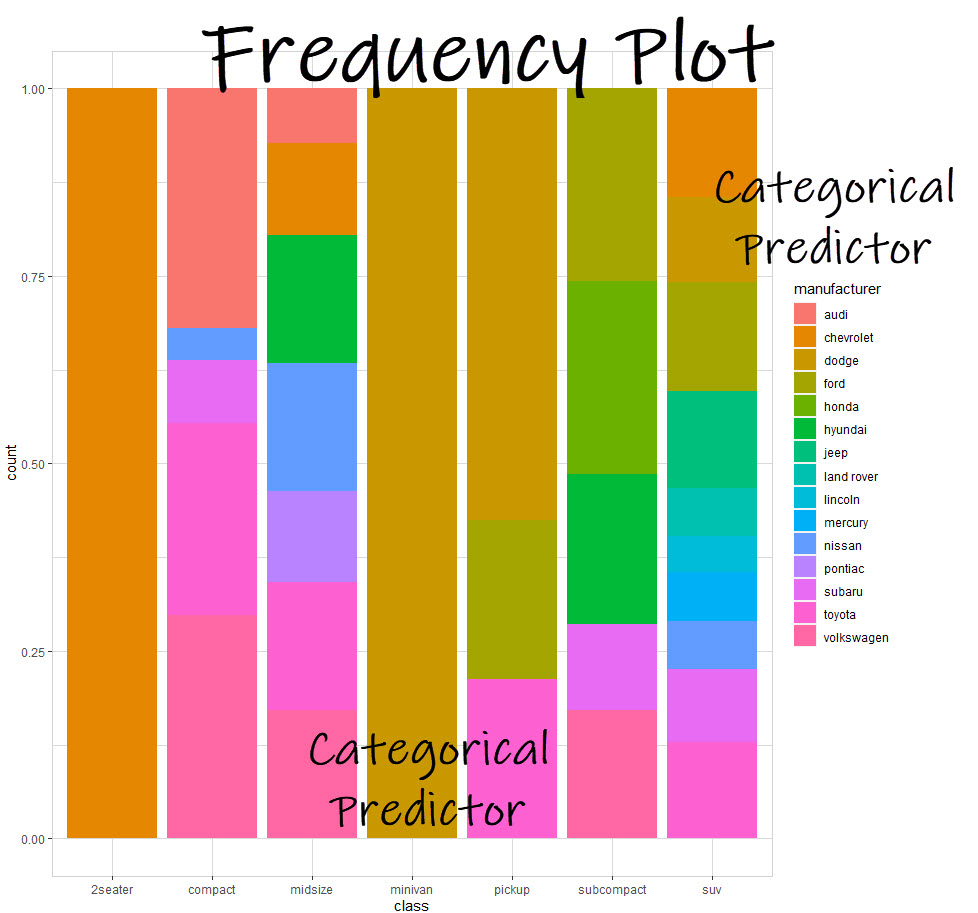
2. Frequency Plot (Categorical vs Categorical)
Get the code.
The 2nd plot we get is a frequency plot, which is when we compare two categories and determine the overlap in terms of the frequency of observations that fall into combinations of categories. This plot won’t help us with figuring out effect on fuel economy (highway mpg), but can be important in data discover.
Business Insights:
- Chevrolet dominates the 2seater category, and Dodge dominates the minivan category
- The most competitive categories are Midsize and SUV
3. Scatter Plot (Numeric vs Numeric)

Get the code.
The 3rd plot we get is a scatter plot, which is when we compare two numeric variables and determine the trend between the two variables. This plot helps us see an immediate trend between highway fuel economy and engine size (displacement).
Business Insights:
- As engine size (displacement) goes up, highway fuel economy goes down. This is an inverse relationship.
Conclusion
You learned how to use the explore library to automatically create an exploratory data analysis shiny app AND perform bivariate analysis the fast way. Great work! But, there’s a lot more to becoming a data scientist.
If you’d like to become a data scientist (and have an awesome career, improve your quality of life, enjoy your job, and all the fun that comes along), then I can help with that.
Need to advance your business data science skills?
I’ve helped 6,107+ students learn data science for business from an elite business consultant’s perspective.
I’ve worked with Fortune 500 companies like S&P Global, Apple, MRM McCann, and more.
And I built a training program that gets my students life-changing data science careers (don’t believe me? see my testimonials here):
6-Figure Data Science Job at CVS Health ($125K)
Senior VP Of Analytics At JP Morgan ($200K)
50%+ Raises & Promotions ($150K)
Lead Data Scientist at Northwestern Mutual ($175K)
2X-ed Salary (From $60K to $120K)
2 Competing ML Job Offers ($150K)
Promotion to Lead Data Scientist ($175K)
Data Scientist Job at Verizon ($125K+)
Data Scientist Job at CitiBank ($100K + Bonus)
Whenever you are ready, here’s the system they are taking:
Here’s the system that has gotten aspiring data scientists, career transitioners, and life long learners data science jobs and promotions…

Join My 5-Course R-Track Program Now!
(And Become The Data Scientist You Were Meant To Be...)
P.S. - Samantha landed her NEW Data Science R Developer job at CVS Health (Fortune 500). This could be you.
