Part 6 - R Shiny vs Tableau (3 Business Application Examples)
Written by Matt Dancho
Shiny, a web framework that is written in R, often gets lumped into the conversation with Tableau and PowerBI - two popular Business Intelligence (BI Tools) used for “Dashboarding”. The critical point is that Shiny is much more than just a dashboarding tool: R and Shiny combine both machine learning and decision-making, packaging your data science analysis into a web application that businesses can use. Here we illustrate 3 powerful use cases for R Shiny Apps in business. View the updated article at Business Science.
Articles in Series
- Part 1 - Five Full-Stack Data Science Technologies for 2020 (and Beyond)
- Part 2 - AWS Cloud
- Part 3 - Docker
- Part 4 - Git Version Control
- Part 5 - H2O Automated Machine Learning (AutoML)
- Part 6 - R Shiny vs Tableau (3 Business Application Examples) (You Are Here)
- [NEW BOOK] - The Shiny Production with AWS Book
Why Shiny?
R Shiny is often thought of as a “Dashboarding tool”, which places it in a category occupied by products like Tableau, PowerBI, QlikView, Data Studio, and other “Business Intelligence Tools”.
Thinking of Shiny as a “Dashboarding tool” limits your perspective of what Shiny can do.
Shiny is much more than just a dashboarding tool. Shiny can be used for Data Science Applications including:
-
✅ Meta-Applications
-
✅ Full-Stack Web Development
-
✅ Real-Time Prediction Applications
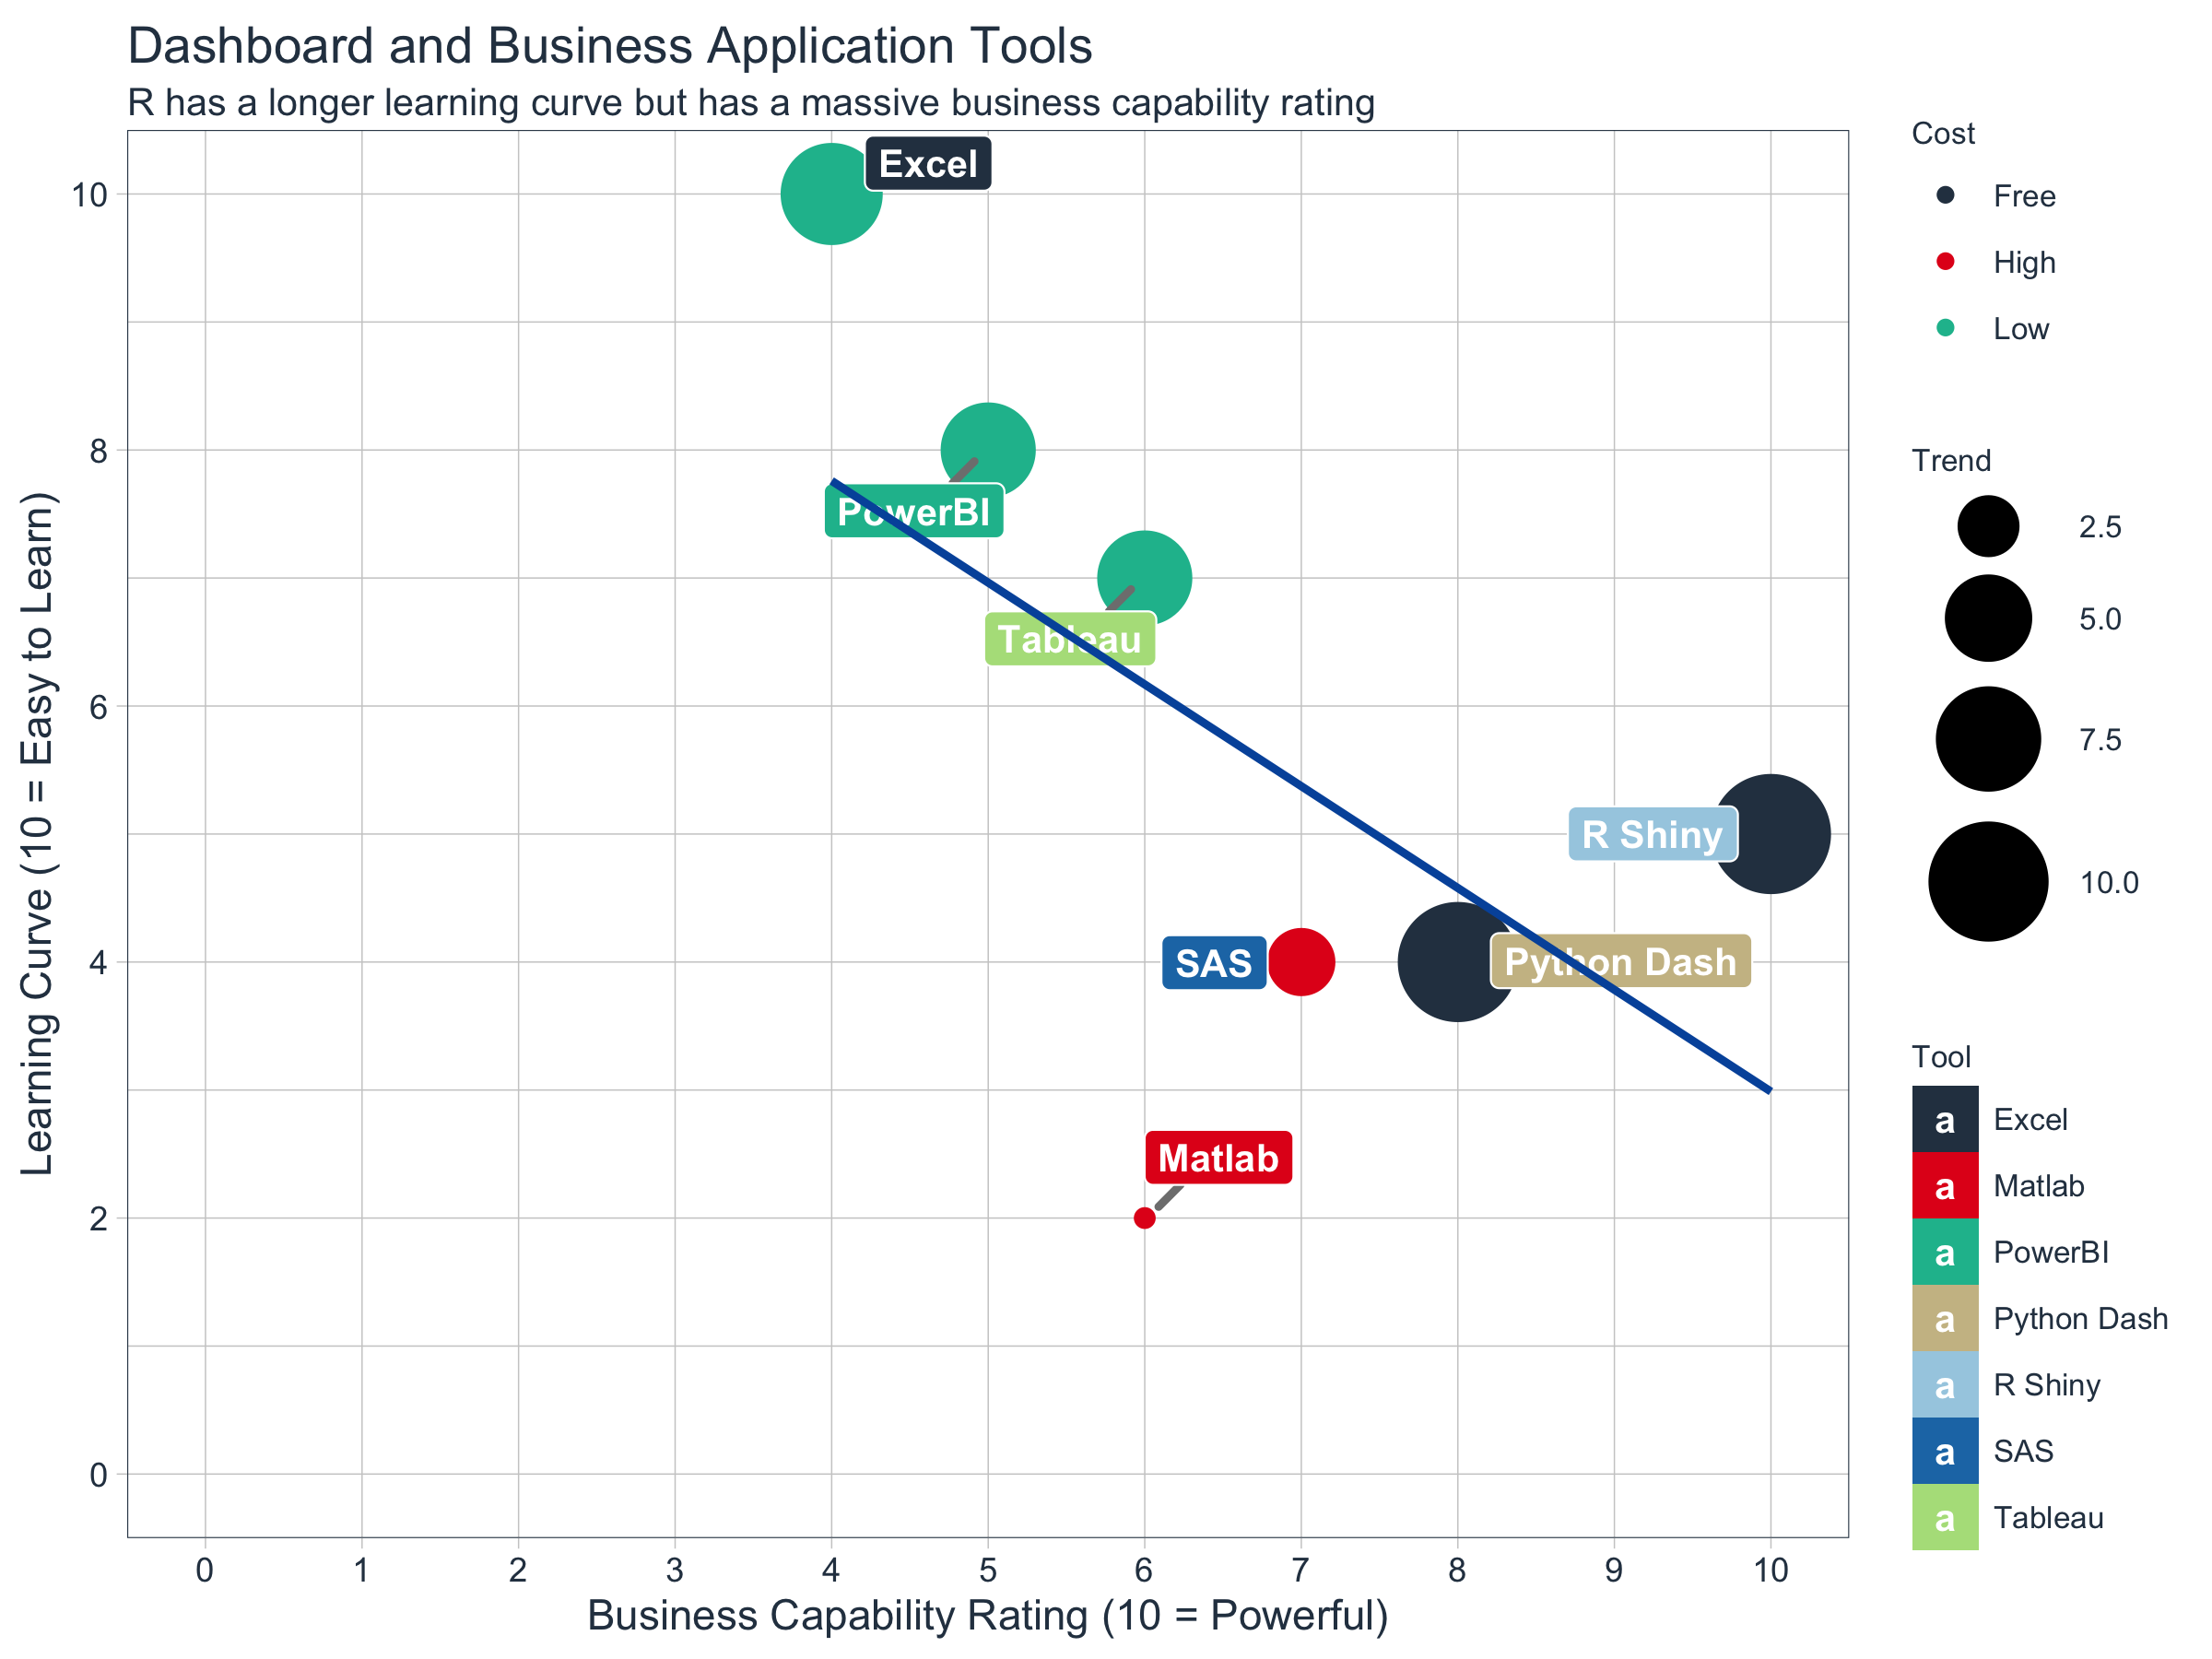
R Shiny Business Capability Rating: 10 of 10
It’s easy to get distracted by Tableau and PowerBI’s visuals, but when it comes to making business decisions, your organization needs to be able to take actions. This is where R Shiny is lightyears ahead of the other tools - R Shiny is a powerful ecosystem for business + data science + apps.
R Shiny has the highest business capability rating
Let’s just skip straight to the benefit: What can Shiny do that the others can’t?
Shiny’s Capability in 3 Examples
Business Applications made possible with R Shiny
I’m going to show you Shiny’s capability with 3 R Shiny Business examples. After seeing these, the decision to learn R Shiny is a no-brainer.
Example 1: The Application Library
A Meta-Application
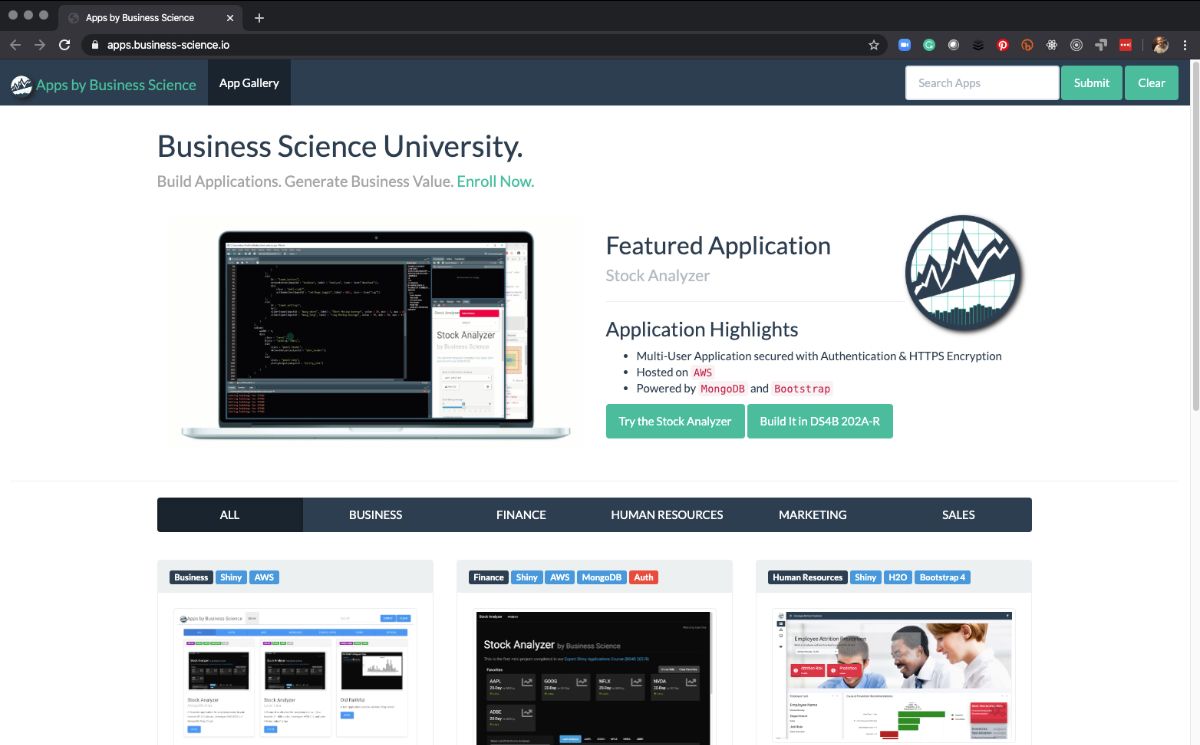
Business Science Application Library
A Meta-Application that houses Shiny Apps
A meta-application is an app that provides an interface to many other applications in a library.
Think of a meta-app like the Apple App Store. Each application in the library serves a specific function and the Meta-App provides searching and filtering capability so users can get to the apps that they need.
The new Business Science App Gallery is an example of a meta-app. The Business Science App Gallery hosts various Shiny Apps that our students build in our courses. The hosted shiny apps range from predictive dashboards to multi-user web applications with security and authentication.
The Business Science App Gallery enables filtering using Full-Text Search and Domain/Industry Categories. Try searching “tidyquant” and see which apps pop up.
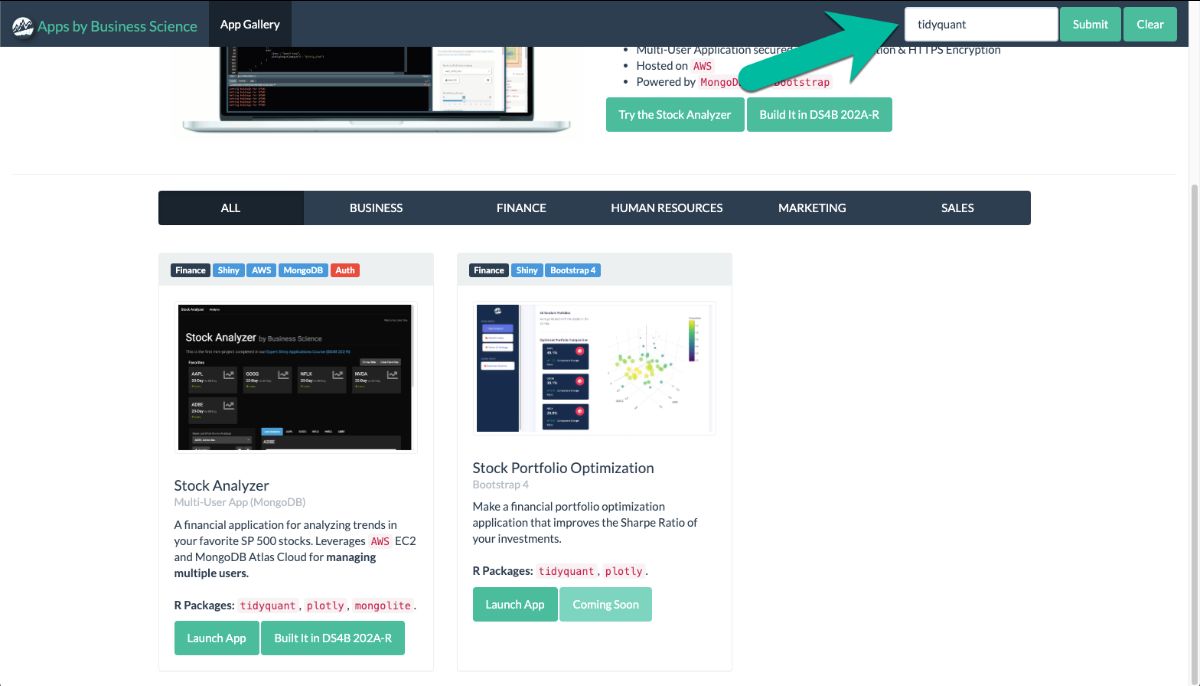
Full-Text Search
Try typing "tidyquant", and see which apps pop up
You build and deploy an App Library on AWS in Shiny Developer with AWS (DS4B 202A-R) Course.
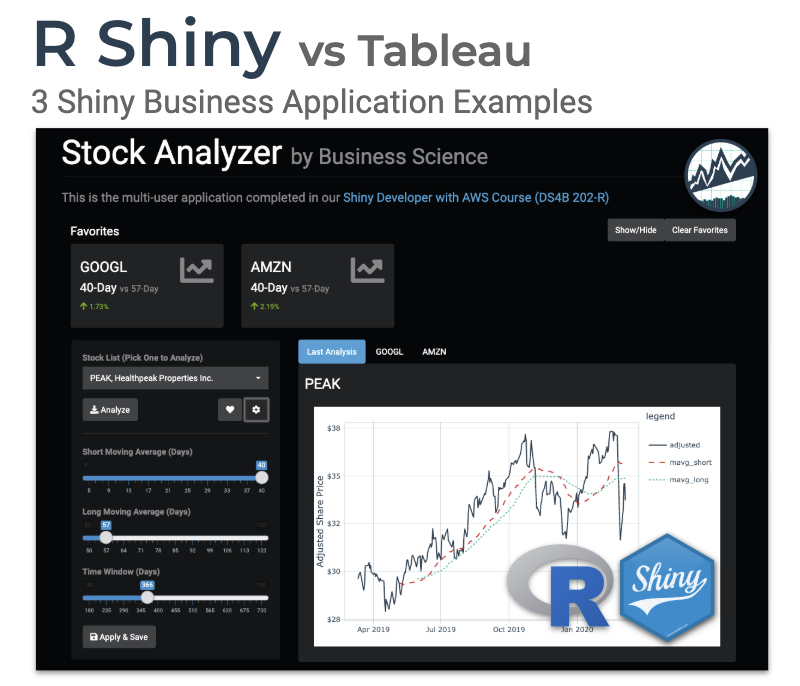
Example 2: The Stock Analyzer
A Full-Stack Web Application
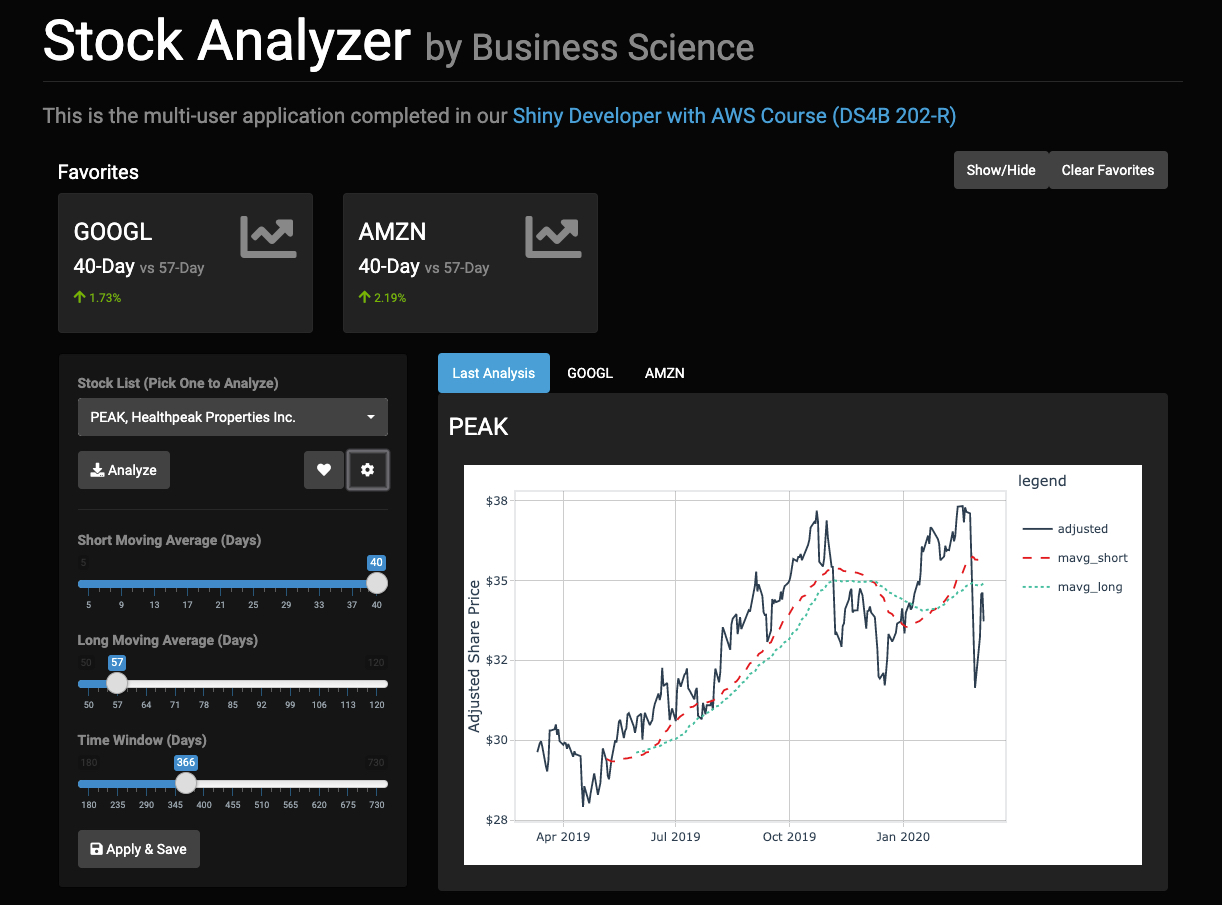
Stock Analyzer
A Full-Stack Web Application
A Full-Stack Web Application is an application that provides user login (authentication), security, and stores this information in a backend database, typically a NoSQL database (i.e. MongoDB).
The full-stack web app is a new concept to many data scientists, but it’s absolutely critical for organizations that need security around their business applications.
The architecture of a full-stack web application includes a backend database that stores user data so that multiple users can authenticate and have a customized experience.
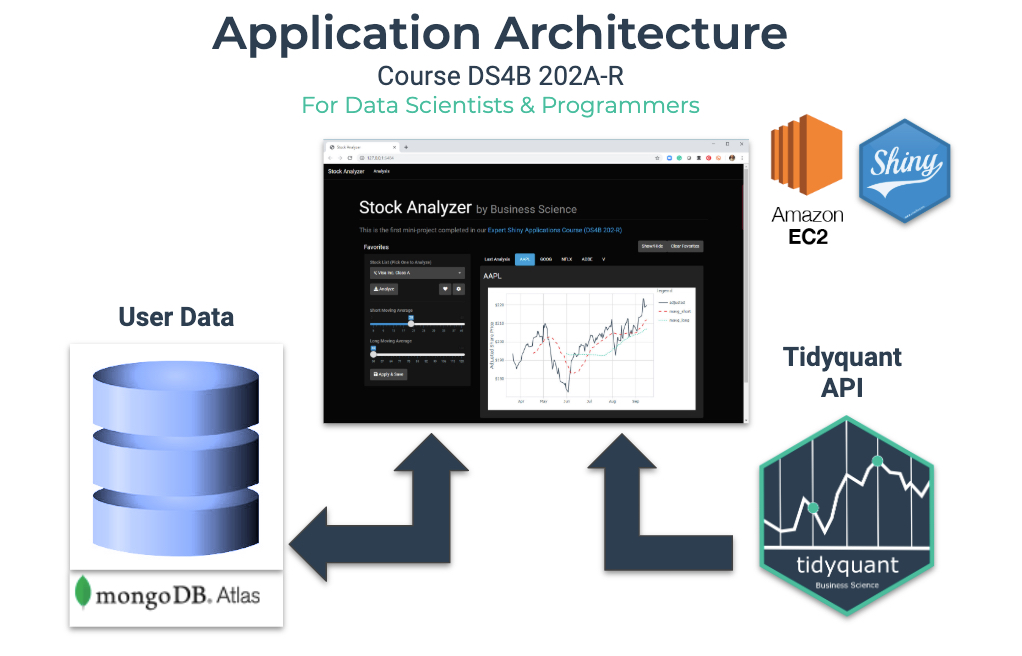
Application Architecture
Users are required to Log In (called authentication) with a Full-Stack Data Science App. The first screen requires authentication before the private content is rendered. Only authenticated users can pass through.
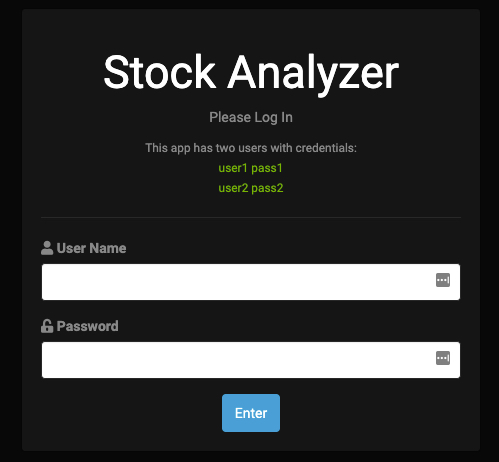
User Authentication (Security Layer)
Once the user logs in (authenticates), the app remembers the user’s favorite stocks and app settings from the previous session. This is called persistent data storage.
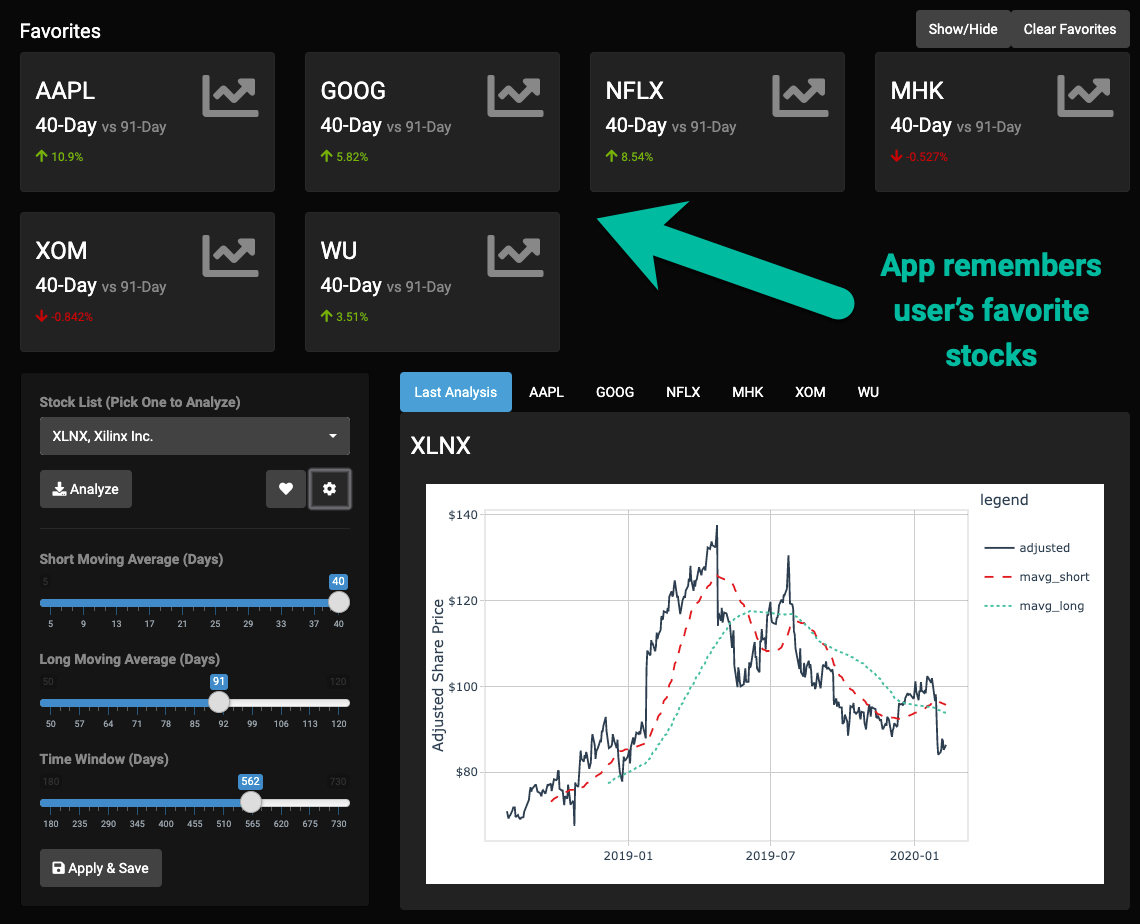
User Favorites (Persistent Data Storage)
Interested in making a “Stock Analyzer” Full-Stack Web Application?
You build and deploy an Stock Analyzer on AWS in Shiny Developer with AWS (DS4B 202A-R) Course.
Example 3: Real-Time Forecasting in a Sales Dashboard
Train and Predict in Real-Time
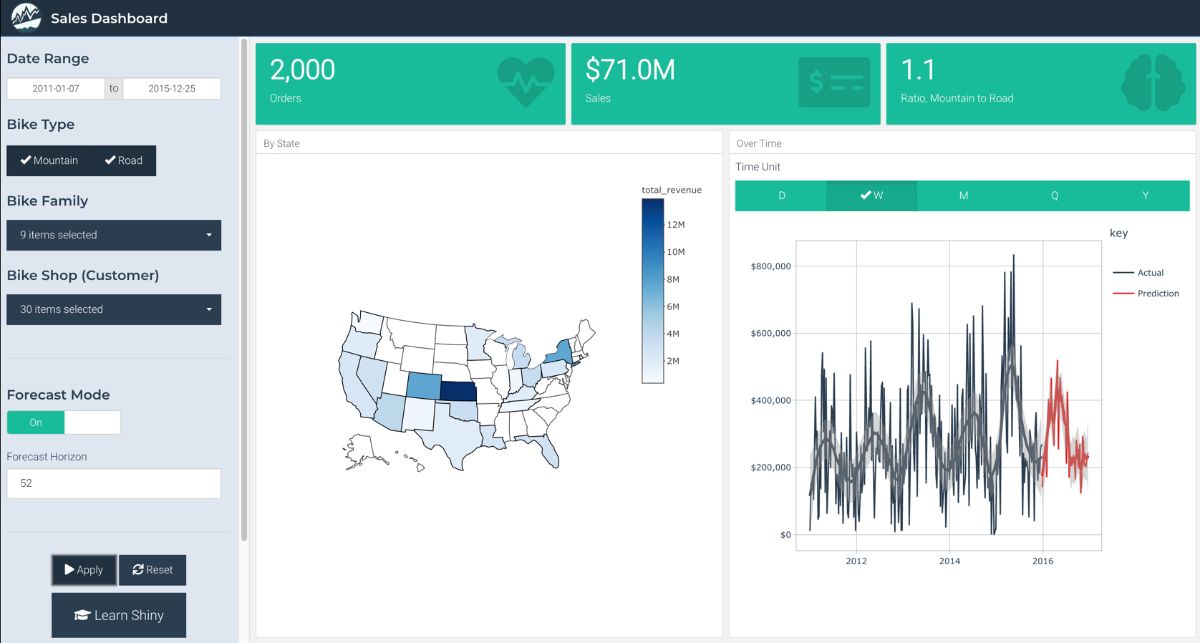
Sales Dashboard with Real-Time Prediction
Applications like a Sales Demand Forecast App need to make predictions (forecasts) in real-time. This is because the inputs to the forecast (which customers, products, time aggregation unit) are not known in advance.
Real-time prediction applications use machine learning to make predictions on the fly.
Using R Shiny, we can integrate machine learning that quickly trains a custom model and makes predictions on-demand.
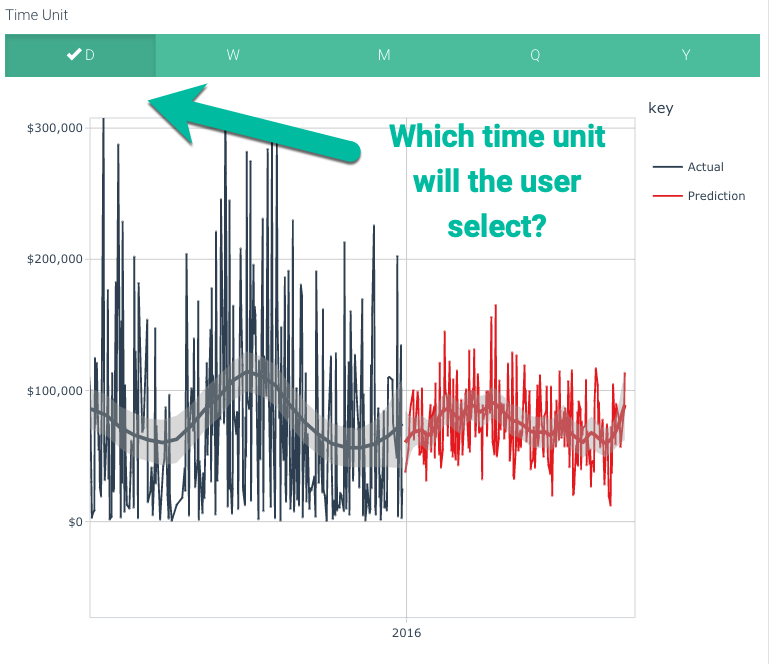
Which time unit will the user select?
The forecast model trains and predicts in real-time
Interested in making a “Sales Demand Forecast App with Real-Time Training and Prediction”?
You build the Sales Demand Forecast App in Shiny Predictive Dashboards (DS4B 102-R) Course.
The R Shiny Ecosystem
Why I love R + Shiny for Business
So many FREE TOOLS EXIST inside the R + Shiny Ecosystem that can be used for Business Applications. Here are the ones I use in business applications most frequently.
Shiny Web Framework Ecosystem
shiny (R to HTML/CSS/JavaScript/Server Processing)flexdashboard (Rmarkdown-based apps)shinyWidgets (more widgets!)esquisse (Tableau in R)shinyjs (JavaScript in R)shinythemes (Bootswatch Themes in R)- and much more
R Machine Learning Suite
Tidymodels (tidyverse compliant modeling, tuning, and preprocessing suite)H2O (Java-based Machine Learning suite)MLR3 (Data.table Machine Learning suite)keras (R interface to Keras Deep Learning library)- and more
Time Series Suite
Tidyverts (tidyverse compliant forecasting and time series tools)Prophet (Facebook’s forecasting algorithm)forecast (original forecasting library)- and more
ETL (Data Wrangling) Suite
Tidyverse (super-popular data manipulation and visualization ecosystem)data.table and dtplyr (Fast in-memory data wrangling)sparklyr (Spark in R)
Database Suite
dbplyr (R-to-SQL Conversion)DBI (Connect to SQL Databases)mongolite (Connect to NoSQL)
Visualization and Reporting Suite
plotly and dygraphs (interactive charting)ggplot2 (static visualizations)rmarkdown (business reporting)
Shiny Unlocks Business Value
R Shiny has so many tools that will unlock business value for your organization and accelerate your career. You need to learn Shiny. Here’s how. 👇
Become Great at Shiny
R Shiny needs to be in your toolbox if you want to productionize Data Science. You simply cannot put machine learning applications into production with other “BI” Tools like Tableau, PowerBI, and QlikView.
If you need to learn R Shiny as fast as possible, I have the perfect program for you. It will accelerate your career. The 4-Course R-Track Bundle through Business Science.
BONUS: Code for the Capability Visual
library(tidyquant)
library(tidyverse)
library(ggrepel)

data_apps <- tribble(
  ~application,  ~business_capability, ~ease_of_learning, ~trend, ~cost,
  "R Shiny",     10,                   5,                 10,     "Free",
  "Python Dash", 8,                    4,                 10,     "Free",
  "Excel",       4,                    10,                7,      "Low",
  "Tableau",     6,                    7,                 6,      "Low",
  "PowerBI",     5,                    8,                 6,      "Low",
  "Matlab",      6,                    2,                 1,      "High",
  "SAS",         7,                    4,                 3,      "High"
)


data_apps %>%
  ggplot(aes(x = business_capability, y = ease_of_learning,
             color = cost, size = trend)) +
  geom_point() +
  geom_label_repel(aes(label = application, fill = application),
                   size = 3.5,
                   fontface = 'bold', color = 'white',
                   box.padding = 0.1, point.padding = 0.5,
                   segment.color = 'grey50', segment.size = 1) +
  geom_smooth(color = palette_dark()[[1]], method = "lm", se = FALSE, show.legend = F) +
  expand_limits(x = c(0, 10), y = c(0, 10)) +
  theme_tq() +
  theme(
      legend.direction = "vertical",
      legend.position  = "right",
      legend.title = element_text(size = 8),
      legend.text  = element_text(size = 8)
  ) +
  scale_fill_tq() +
  scale_color_tq() +
  scale_y_continuous(breaks = seq(0, 10, 2)) +
  scale_x_continuous(breaks = 0:10) +
  scale_size_continuous(range = c(2, 14)) +
  labs(title = "Dashboard and Business Application Tools",
       subtitle = "R has a longer learning curve but has a massive business capability rating",
       x     = "Business Capability Rating (10 = Powerful)",
       y     = "Learning Curve (10 = Easy to Learn)",
       color = "Cost",
       size  = "Trend",
       fill  = "Tool")