Web Scraping and Analyzing Home Rentals (Python + R)
Written by David Lucey
👉 Each month, we release tons of great content on R for Business. Register for our blog to get fresh R Tips straight to your inbox.
Introduction
This tutorial showcases how to use Python with R reticulate.
When I started this mini-project, I hoped to use datatable as our main data frame in conjunction with the Python libraries like BeautifulSoup and data structures not available in R, like dictionaries. I soon learned that datatable doesn’t support dates yet. In Python and R - Part 1: Exploring Data with Datatable, we noted that datatable is still in alpha stage, and worked around the lack of reshaping capability and the inability to pipe our data directly into plots, but this really a deal breaker for this project. As a result, though we were able to keep using plotnine and pandas.
Code Setup
# R Libraries
library("reticulate")

knitr::opts_chunk$set(
  fig.width = 15,
  fig.height = 8,
  out.width = '100%')
# Choose Python 3.7 miniconda
reticulate::use_condaenv(
  condaenv = "r-reticulate",
  required = TRUE
  )
# Install Python packages
lapply(c("bs4", "requests", "plotnine", "mizani"), function(package) {
       conda_install("r-reticulate", package, pip = TRUE)
})

from bs4 import BeautifulSoup
import requests
import itertools
import plotnine as p9
from mizani.breaks import date_breaks
from mizani.formatters import date_format
import pandas as pd
import numpy as np
import re
import time
import json as JSON
import pickle
import datetime
import pprint
Scraping Process
We found vacationrentalslbi.com has an extensive list of rentals, and doesn’t restrict to the particular agency maintaining the listing, so this is the perfect place to gather our data. Naturally, we would like to be polite, so check that we are allowed to scrape. We can see from the R robotstxt library, which indicates that paths_allowed is TRUE, that we are good to go with our intended link.
# Robots.txt says okay to scrape
robotstxt::paths_allowed('https://www.vacationrentalslbi.com/search/for.rent/sleeps_min.4/')
## [1] TRUE
Scraping the website for listings is a two-step process:
- Go through and extract the links to all of the listings
- Navigate back to all of the links and extract the listing details
We set our requests to the website to vary at an average 5-second delay, and build a list of the ‘href’ links from the returned ‘a’ tags. We are not running our scraping code now for the blog post, but the results is shown in the link below loaded from disc.
# Extract links for min sleep of 4 from vacationrentalslbi.com website
links = []
for i in range(0, 1250, 25):
  if i == 0:
     url = 'https://www.vacationrentalslbi.com/search/for.rent/sleeps_min.4/'
  else:
      url = 'https://www.vacationrentalslbi.com/search/for.rent/sleeps_min.4/' + str(i)
  html_content = requests.get(url).text

  # Parse the html content
  soup = BeautifulSoup(html_content, 'lxml')
  time.sleep(5)
  links.append([link['href'] for link in soup.find_all('a', href=True) if 'listing.' in link['href']])

# Extract links
links = list(set(itertools.chain(*links)))
listings = [link for link in links if not '#' in link]
# Load pre-scraped listing links from disc
path = '/Volumes/davidlucey/aDL/data/lbi/'
file = 'listings.txt'
# Pickle load listings
with open(path + file, "rb") as fp:   # Unpickling
  listings = pickle.load(fp)

# First 5 listings
listings[0:4]
## ['https://www.vacationrentalslbi.com/listing.464', 'https://www.vacationrentalslbi.com/listing.165', 'https://www.vacationrentalslbi.com/listing.353', 'https://www.vacationrentalslbi.com/listing.453']
Get Listings from Home
Now, we build a second scraper to take the list of listings, extract the key elements of each and return a dictionary which we store in a list. We won’t go into detail here, but the way to find the desired classes is to navigate to the vacationrentalslbi.com on Google Chrome, select Ctrl-Alt-I, choose the ‘Select Element’ option in the ‘Elements’ pane, and then navigate to the desired spot on the page.
We selected the title, content, description, location, and calendar sub-element tables for ‘booked’ and ‘available’ from the ‘month_box’. It took some work to get the calendar. We then returned a dictionary with all of these elements from our get_dict function.
# Function to take listing, scrape and return key elements as dictionary
def get_dict(listing):

  # Extract html text
  html_content = requests.get(listing).text
  # Parse the html content
  soup1 = BeautifulSoup(html_content)

  # Title and attributes
  title = soup1.find_all("div", class_= "col-md-3 title")
  title = [item.text for item in title]
  content = soup1.find_all("div", class_= "col-md-9 content")
  content = [item.text for item in content]
  d = {title[i]: content[i] for i in range(len(title))}

  # Description and location
  try:
    description = soup1.find("p").get_text()
  except:
    description = None
  d['description'] = description
  try:
    location = soup1.find("div", attrs={"class" : "ld_location"}).get_text()
  except:
    location = None
  d['location'] = location

  # Extract full calendar
  availability = soup1.find_all("div", class_ = "month_box col-sm-4 col-xs-12")
  table_rows = [item.table for item in availability]

  # Extract booked
  l = []
  for tr in table_rows:
    td = tr.find_all('td', class_ = "booked")
    rows = [tr.text for tr in td if tr]
    for row in rows:
      if row != '':
          rows.remove(row)
      l.append(rows)
  l = list(itertools.chain.from_iterable(l))
  df1 = pd.DataFrame(l)
  df1["status"] = "booked"

  # Extract available
  l = []
  for tr in table_rows:
    td = tr.find_all('td', class_ = "available")
    rows = [tr.text for tr in td if tr]
    for row in rows:
      if row != '':
          rows.remove(row)
      l.append(rows)
  l = list(itertools.chain.from_iterable(l))
  df = pd.DataFrame(l)
  df["status"] = "available"

  # Combine 'booked' and 'available' in calendar
  calendar = pd.concat(list([df,df1]))
  calendar[["start_day","start_date","hyphen", "end_date","period"]] = calendar[0].str.split(expand=True)
  calendar[["end_date", "rate"]] = calendar["end_date"].str.split("$", expand=True)

  # Clean up
  del calendar['hyphen']
  del calendar['start_day']
  del calendar[0]
  calendar = calendar.drop_duplicates()

  # Convert to dictionary for return
  d['calendar'] = calendar.to_dict()
  return d
When an element of a listing is not present, we were having breaks, so we put in exception handling for those cases. Although we think we have handled most of the likely errors in get_dict, the full scraping process takes a couple of hours, so we thought best to save to disc after each request. It took us a while how to figure this out, because it turns out not to be so straight-forward to save and append a json to disc. We were able to write to disc as txt as we do in append_record below.
Scrape All Listings
With our get_dict function, we scrape each listing, create a dictionary entry and append it to disc with append_record.
# Loop through listings with get_dict and add to Google Drive
for listing in listings:

  # Initiate dictionaries
  entry = {}
  details = {}

  # Extract listing details with `get_dict` function above
  try:
    details = get_dict(listing)
  except:
    details = None

  # Take break
  time.sleep(5)

  # Get `listing_id` to add as dictionary key
  listing_id = re.findall('\d+', listing)[0]

  # Create dictionary `entry`
  # Then append to lbi.txt file on disc with `append_record` function above
  entry = {listing_id:  details }
  try:
    append_record(entry)
  except:
    print(listing_id + ' Failed')
Again, we wanted to avoid re-running the code, we are showing our saved data from disc. We load the saved data from our text file as a list of 1231 Python dictionaries. The dictionary for a sample listing of ‘464’ is shown in the chunk below. The attributes of the listing are deeply nested and not easy to filter and sort. However, we learned that it is easy to extract the desired elements using the dictionary keys, which we do in the get_calendar function below.
# Load lbi.txt back into notebook as list of dictionaries
filename = 'lbi.txt'
with open(path + filename) as fh:
  lbi = [JSON.loads(line) for line in fh]

# Show listing '464' dictionary
pp = pprint.PrettyPrinter(depth=4)
pp.pprint(lbi[0])
## {'464': {' Payment options': 'Cash, Checks',
##          'Access': ' Stairs',
##          'Bathroom(s)': ' 2 Bathroom(s)Toilet / Shower: 1Toilet / Tub / '
##                         'Shower: 1',
##          'Bedroom(s)': ' 3 Bedroom(s),\n'
##                        '8 SleepsBunk Beds (twin / twin): 1King: 1Queen: 1Sleep '
##                        'Sofa (queen): 1Trundle: 1Twin / Single: 1',
##          'Entertainment': ' DVD Player Game Room Ping Pong Table Satellite '
##                           '/Cable Television',
##          'Indoor Features': ' Blender Central Air Coffee Maker Cooking '
##                             'Utensils Dining Area Dishes & Utensils Dishwasher '
##                             'Internet Keurig Kitchen Living Room Microwave '
##                             'Oven Refrigerator Stove Toaster Vacuum',
##          'Local Activities & Adventures': ' Basketball Cycling Deep Sea '
##                                           'Fishing Fishing Golf Jet Skiing '
##                                           'Paddle Boating Photography Pier '
##                                           'Fishing Rafting Roller Blading '
##                                           'Sailing Scenic Drives Sight Seeing '
##                                           'Snorkeling Surf Fishing Surfing '
##                                           'Swimming Tennis Walking Water '
##                                           'Skiing Water Tubing Wind Surfing',
##          'Location Type': ' Ocean Block Oceanfront Oceanside',
##          'Outdoor Features': ' Balcony / Terrace Beach Badges Community Pool '
##                              'Deck / Patio Heated Pool Outdoor Grill Sun Deck',
##          'Popular Amenities': ' Air Conditioning Pool Washer / Dryer WiFi',
##          'Property Type': ' Condo',
##          'Security deposit': '$300',
##          'Suitability': '  Pets Welcome: No  Smoking Allowed: No smoking  '
##                         'GREAT for Kids: Yes  Winter/Seasonal Rentals: No  Not '
##                         'Many Stairs: Two or more Flights  Wheelchair '
##                         'Accessible: No Parties/events not allowed',
##          'Themes': ' Beach Vacation Family Vacations',
##          'calendar': {'end_date': {'0': '06/26/2020',
##                                    '12': '10/02/2020',
##                                    '202': '08/07/2020',
##                                    '205': '08/14/2020',
##                                    '208': '08/21/2020',
##                                    '21': '07/10/2020',
##                                    '211': '09/11/2020',
##                                    '24': '07/17/2020',
##                                    '27': '07/24/2020',
##                                    '3': '07/03/2020',
##                                    '30': '07/31/2020',
##                                    '376': '09/18/2020',
##                                    '380': '09/25/2020'},
##                       'period': {'0': '/Week',
##                                  '12': '/Week',
##                                  '202': '/Week',
##                                  '205': '/Week',
##                                  '208': '/Week',
##                                  '21': '/Week',
##                                  '211': None,
##                                  '24': '/Week',
##                                  '27': '/Week',
##                                  '3': '/Week',
##                                  '30': '/Week',
##                                  '376': '/Week',
##                                  '380': '/Week'},
##                       'rate': {'0': '2,600',
##                                '12': '1,500',
##                                '202': '3,395',
##                                '205': '3,395',
##                                '208': '3,395',
##                                '21': '3,395',
##                                '211': None,
##                                '24': '3,395',
##                                '27': '3,395',
##                                '3': '3,195',
##                                '30': '3,395',
##                                '376': '1,500',
##                                '380': '1,500'},
##                       'start_date': {'0': '06/20/2020',
##                                      '12': '09/26/2020',
##                                      '202': '08/01/2020',
##                                      '205': '08/08/2020',
##                                      '208': '08/15/2020',
##                                      '21': '07/04/2020',
##                                      '211': '08/22/2020',
##                                      '24': '07/11/2020',
##                                      '27': '07/18/2020',
##                                      '3': '06/27/2020',
##                                      '30': '07/25/2020',
##                                      '376': '09/12/2020',
##                                      '380': '09/19/2020'},
##                       'status': {'0': 'booked',
##                                  '12': 'available',
##                                  '202': 'booked',
##                                  '205': 'booked',
##                                  '208': 'booked',
##                                  '21': 'booked',
##                                  '211': 'booked',
##                                  '24': 'booked',
##                                  '27': 'booked',
##                                  '3': 'booked',
##                                  '30': 'booked',
##                                  '376': 'booked',
##                                  '380': 'booked'}},
##          'description': '"FISHERY FUN" The Fishery is an oceanfront complex '
##                         'that offers so much for the LBI Vacationer. What to '
##                         'do first? Take a swim in the heated pool, enjoy the '
##                         'game room or head to the beach, so many options! '
##                         'After a day of fun in the sun take a stroll into town '
##                         '(close to Ship Bottom and Surf City) to enjoy a meal '
##                         'or do some shopping. This 3 bedroom first floor unit '
##                         'offers a lot of value and fun for the money.  About '
##                         'Sand Dollar Real Estate, Manager  Since 1983, Sand '
##                         'Dollar Real Estate has been successfully assisting '
##                         'LBI vacationers find their perfect summer beach '
##                         'house. We represent over 100 LBI vacation homes and '
##                         'offer secure accounting procedures (including '
##                         'security) in accordance with NJ State Statues. Our '
##                         'local office is open 7 days a week to respond to any '
##                         'issues or questions you might have about your '
##                         'vacation home. All of our guests receive a FREE Goody '
##                         'Bag upon arrival, filled with sweet treats, useful '
##                         'commodities and information on what to do, where to '
##                         'eat and a lot more on how best to enjoy your stay on '
##                         'LBI.  Sand Dollar Real Estate’s experienced staff is '
##                         'here to help you select the best vacation home for '
##                         'you and your family. Our Concierge Service will '
##                         'listen to what you are looking for, ask questions and '
##                         'then search to find the perfect match based on our '
##                         'years of experience. Our staff knows our homes well '
##                         'and can offer you very specific information about our '
##                         'properties. We update our listings weekly to be sure '
##                         'our information is accurate.  It is nice to know that '
##                         'once you book, Sand Dollar Real Estate is available 7 '
##                         'days a week to respond to any issues or questions you '
##                         'might about your vacation home or your vacation stay '
##                         'in general.  We look forward to sharing our Island '
##                         'with your family this Summer.',
##          'location': ' Condo in Long Beach Island, Ship Bottom'}}
Parse Listings
Using get_calendar, we extract the dictionary key for the listing, and then the value desired value elements including ‘rate’, ‘start_date’, ‘end_date’, ‘location’, ‘location_type’ and ‘beds’. We have to clean and transform the ‘rate’ variable to float and the date fields to datetime, and in our case, we are looking for the first two weeks of August, so we filter for just those two weeks. We also add the url back in so it is easy to take a look at an interesting listing in more detail.
We also manufactured some variables for our graphs below. For example, we generated a ‘month-year’ variable so we could aggregate weekly average prices and number of homes available. There were too many different sleep capacities, so we aggregated into just four levels (sleeps 4 or under, 8 or under, 12 or under and more than 12). Beach Haven has 7-8 separate small sections, so we changed to just one.
# Extract availability calendar from disc
def get_calendar(listing):
  key, value = list(listing.items())[0]
  if value is not None:
    data = listing.get(key)['calendar']
    df = pd.DataFrame.from_dict(data)

    # Parse variables in pandas
    df['rate'] = df['rate'].str.replace(',', '').astype(float)
    df['date'] = pd.to_datetime(df['start_date'], errors='ignore')
    df['listing'] = 'https://www.vacationrentalslbi.com/listing.' + key
    try:
      df['location'] = listing[key]['location']
    except:
      df['location'] = None
    df['type'] = df['location'].str.extract('([A-Z][a-z]+)\s')
    df['city'] = df['location'].str.extract('\,\s(.*)')
    df['city'] = df['city'].str.replace('.*Beach Haven.*', 'Beach Haven')
    try:
      df['location_type'] = listing[key]['Location Type']
    except:
      df['location_type'] = None
    try:
      df['beds'] = listing[key]['Bedroom(s)']
    except:
      df['beds'] = None
    df['bedrooms'] = df['beds'].str.extract('(\d+)').astype(int)
    df['sleeps'] = df['beds'].str.split('\,\s').str[1].str.extract('(\d+)').astype(int)
    df['sleeps_bin'] = pd.cut(df['sleeps'], [0, 4, 8, 12, 100])
    return(df)
We loop through our dictionary and use our get_calendar function to extract all of our listings.
data = pd.DataFrame()
for i in range(0,len(lbi)):
  data_new = get_calendar(lbi[i])
  data = data.append(data_new, ignore_index = True)
In the table below, we can see the mean rental rate and number of units available by month. July has the fewest available among the months of the peak period, and also the highest rates. We can also that the average size of houses rented is higher outside the peak period.
# Summary table of 2020 rental average rates and counts by month
table = data.set_index('date')['2020'].resample('M').agg(['mean', 'count'])
table[table.notnull()]
##                    rate        bedrooms           sleeps
##                    mean count      mean count       mean count
## date
## 2020-01-31  1396.875000     8  3.750000     8   9.500000     8
## 2020-02-29  2600.000000     1  3.000000     1   6.000000     1
## 2020-03-31  5300.000000     4  4.000000     4   9.500000     4
## 2020-04-30  4298.461538    13  4.307692    13  11.615385    13
## 2020-05-31  3327.782407   216  3.842593   216   9.685185   216
## 2020-06-30  4548.799439  1426  3.851049  1430   9.606294  1430
## 2020-07-31  5714.932432   888  3.884400   891   9.653199   891
## 2020-08-31  5079.022660  1015  3.822439  1025   9.477073  1025
## 2020-09-30  3056.289474  1064  3.815299  1072   9.542910  1072
## 2020-10-31  2267.789683   252  4.019841   252   9.888889   252
## 2020-11-30  1471.580000    50  4.500000    50  11.240000    50
## 2020-12-31  1493.181818    22  4.363636    22  11.000000    22
Location Inflation
We had hoped to segment and consider the prices for Oceanside, Ocean block, Bayside block and Bayfront, but landlords interpret the meaning of “Oceanside” liberally. We tend to think of that term as looking at the water from your deck, but ~60% of rentals are designated in this category, when true “Oceanside” can’t be more than 10%. In most cases, landlords probably mean Ocean block, but there is not a lot we can do to pick this apart. We also don’t have the exact addresses, so we are probably out of luck to find anything useful in this regard.
data.location_type.value_counts(normalize = True)[1:10]
##  Bayside                             0.216226
##  Oceanside                           0.174151
##  Ocean Block Oceanfront Oceanside    0.146604
##  Oceanfront                          0.061321
##  Bayfront Bayside                    0.048868
##  Ocean Block                         0.044906
##  Bayside Lagoon                      0.020377
##  Bayfront                            0.017736
##  Oceanfront Oceanside                0.010189
## Name: location_type, dtype: float64
Biggest Rental Towns by Volume
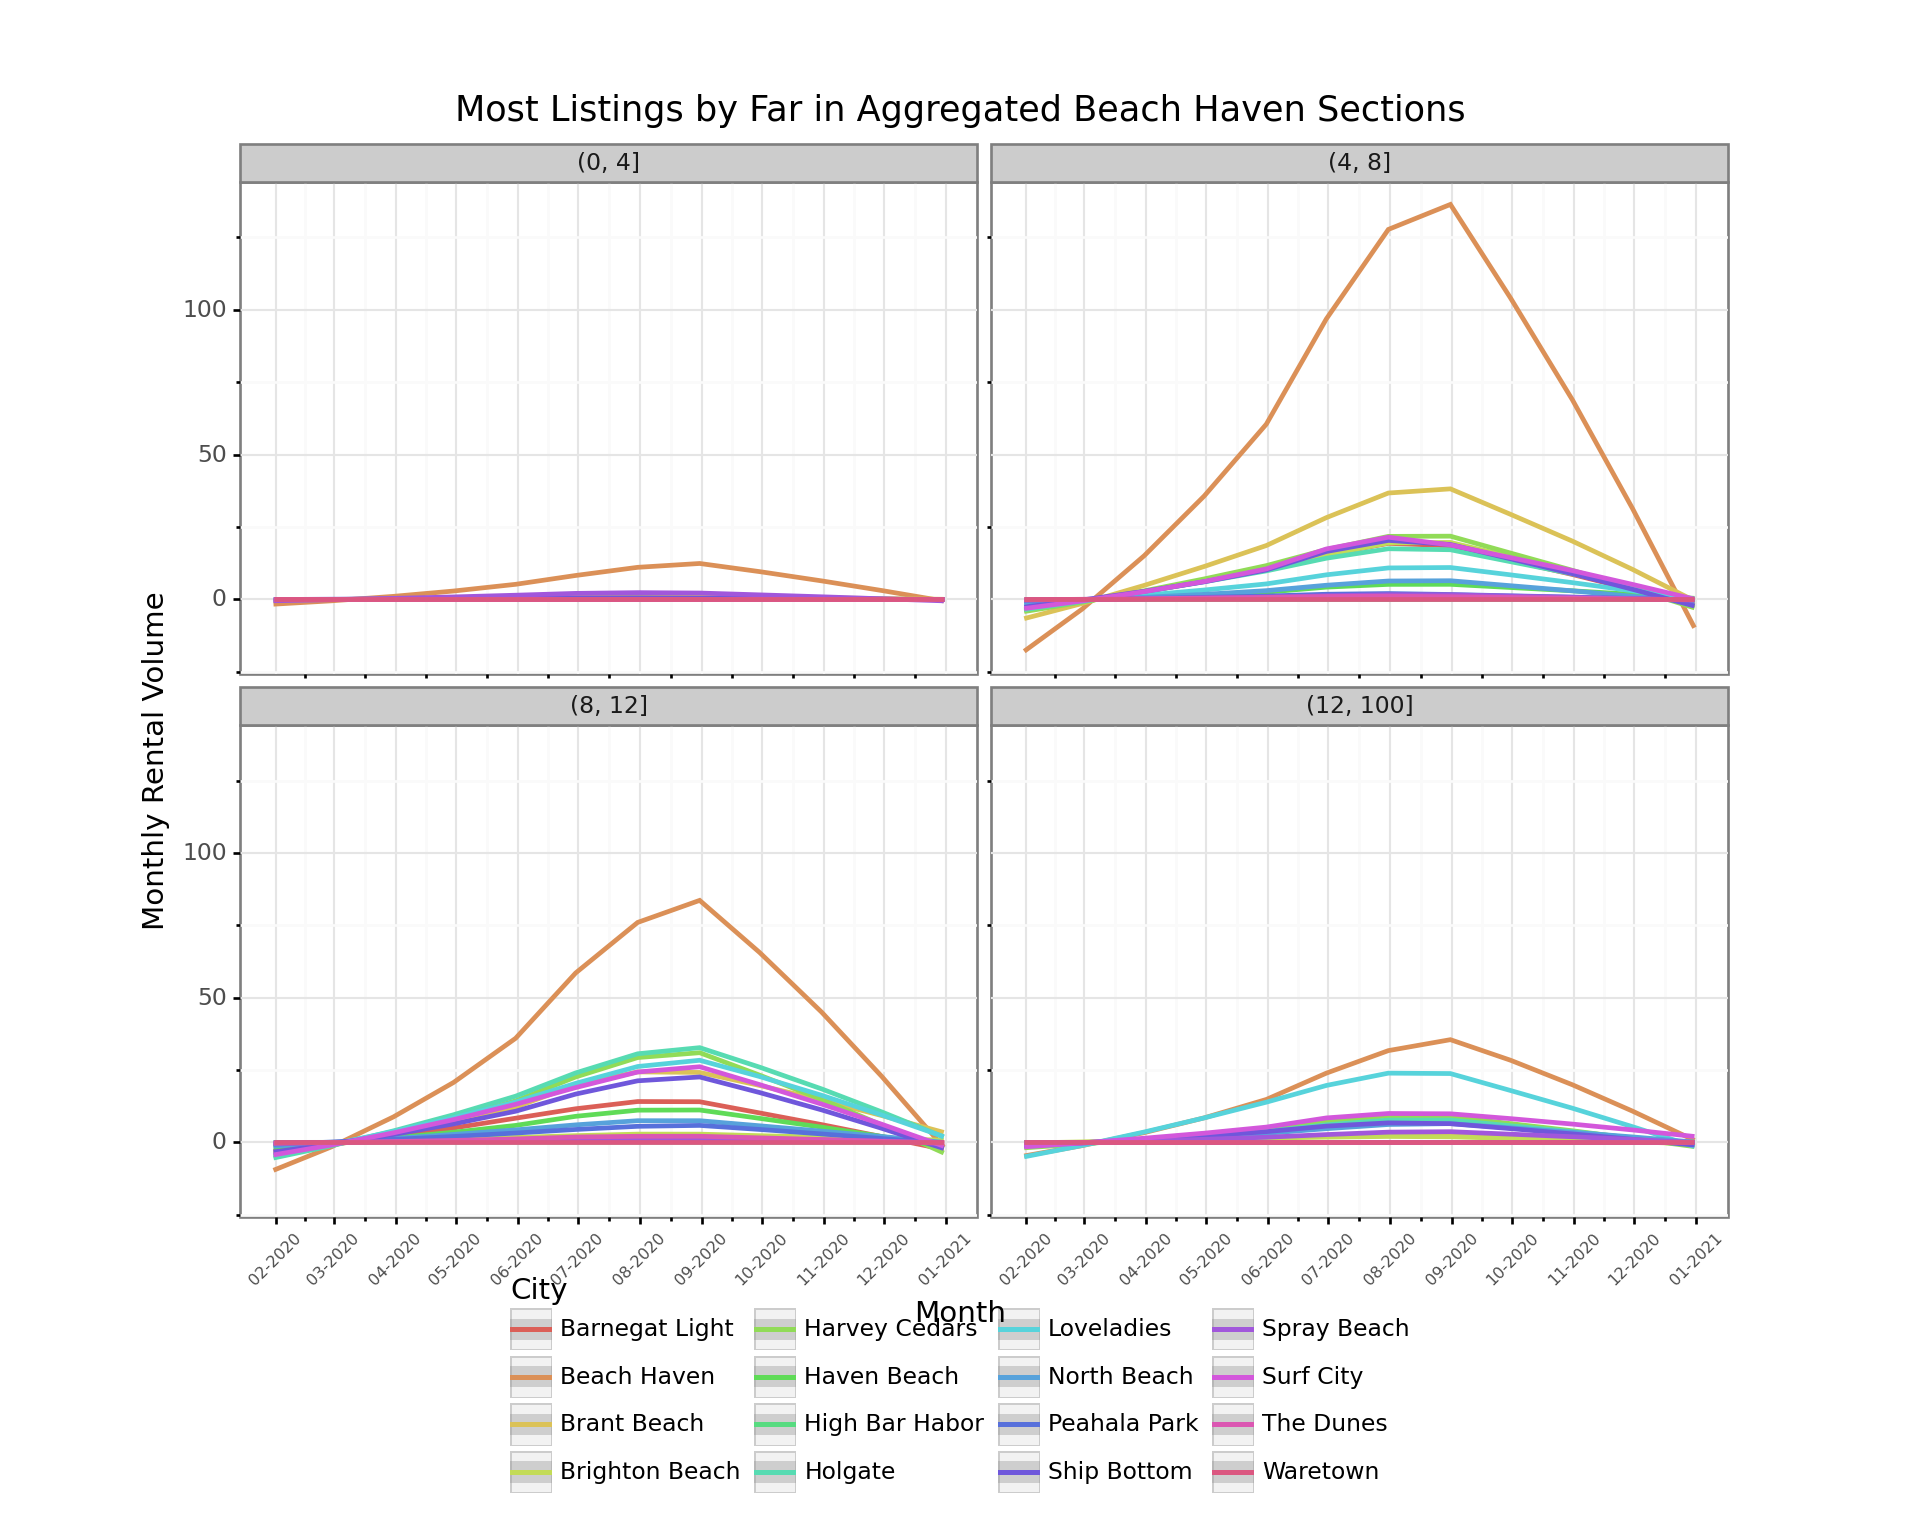
By far the most rental action is in the Beach Haven sections in July and August (shown in orange), but those sections also have more year-round availability than the the other towns. If the plan is to go with less than 8 people, there is not a lot of options. In fact, it was surprising to see that there was more available in the largest sleeps >12 than the family of four category. As mentioned in our previous post about plotnine, the lack of support for plotly hovering is a bit of a detraction here, because it can be hard to tell which color denotes which city. This might mean we have to learn seaborn in the future, just as we have been forced to learn pandas for this post.
filtered_data = data.set_index('date')['2020'].groupby([pd.Grouper(freq='M'), 'city', 'sleeps_bin'])['rate'].count().reset_index()
(p9.ggplot(filtered_data,
      p9.aes(x = 'date',
             y = 'rate',
             group='factor(city)',
             color = 'factor(city)')) +
      p9.geom_smooth() +
      p9.theme_bw() +
      p9.labs(
        title = 'Most Listings by Far in Aggregated Beach Haven Sections',
        subtitle = 'Listed from Smallest to Largest Sleep Capacity',
        x = 'Month',
        y = 'Monthly Rental Volume',
        color = 'City'
        ) +
      p9.scale_x_datetime(breaks=date_breaks('1 month'), labels=date_format('%m-%Y')) +
      p9.theme(
        axis_text_x=p9.element_text(rotation=45, size=6),
        subplots_adjust={'bottom': 0.20},
        figure_size=(10, 3), # inches
        aspect_ratio=1/1.5,    # height:width
        legend_position='bottom',
        legend_direction='horizontal') +
      p9.facet_wrap('~sleeps_bin', ncol = 2)
)
## <ggplot: (-9223363274524820999)>
##
## /Users/davidlucey/Library/r-miniconda/envs/r-reticulate/lib/python3.6/site-packages/plotnine/stats/smoothers.py:168: PlotnineWarning: Confidence intervals are not yet implementedfor lowess smoothings.
##   "for lowess smoothings.", PlotnineWarning)
Availability vs Booked by City
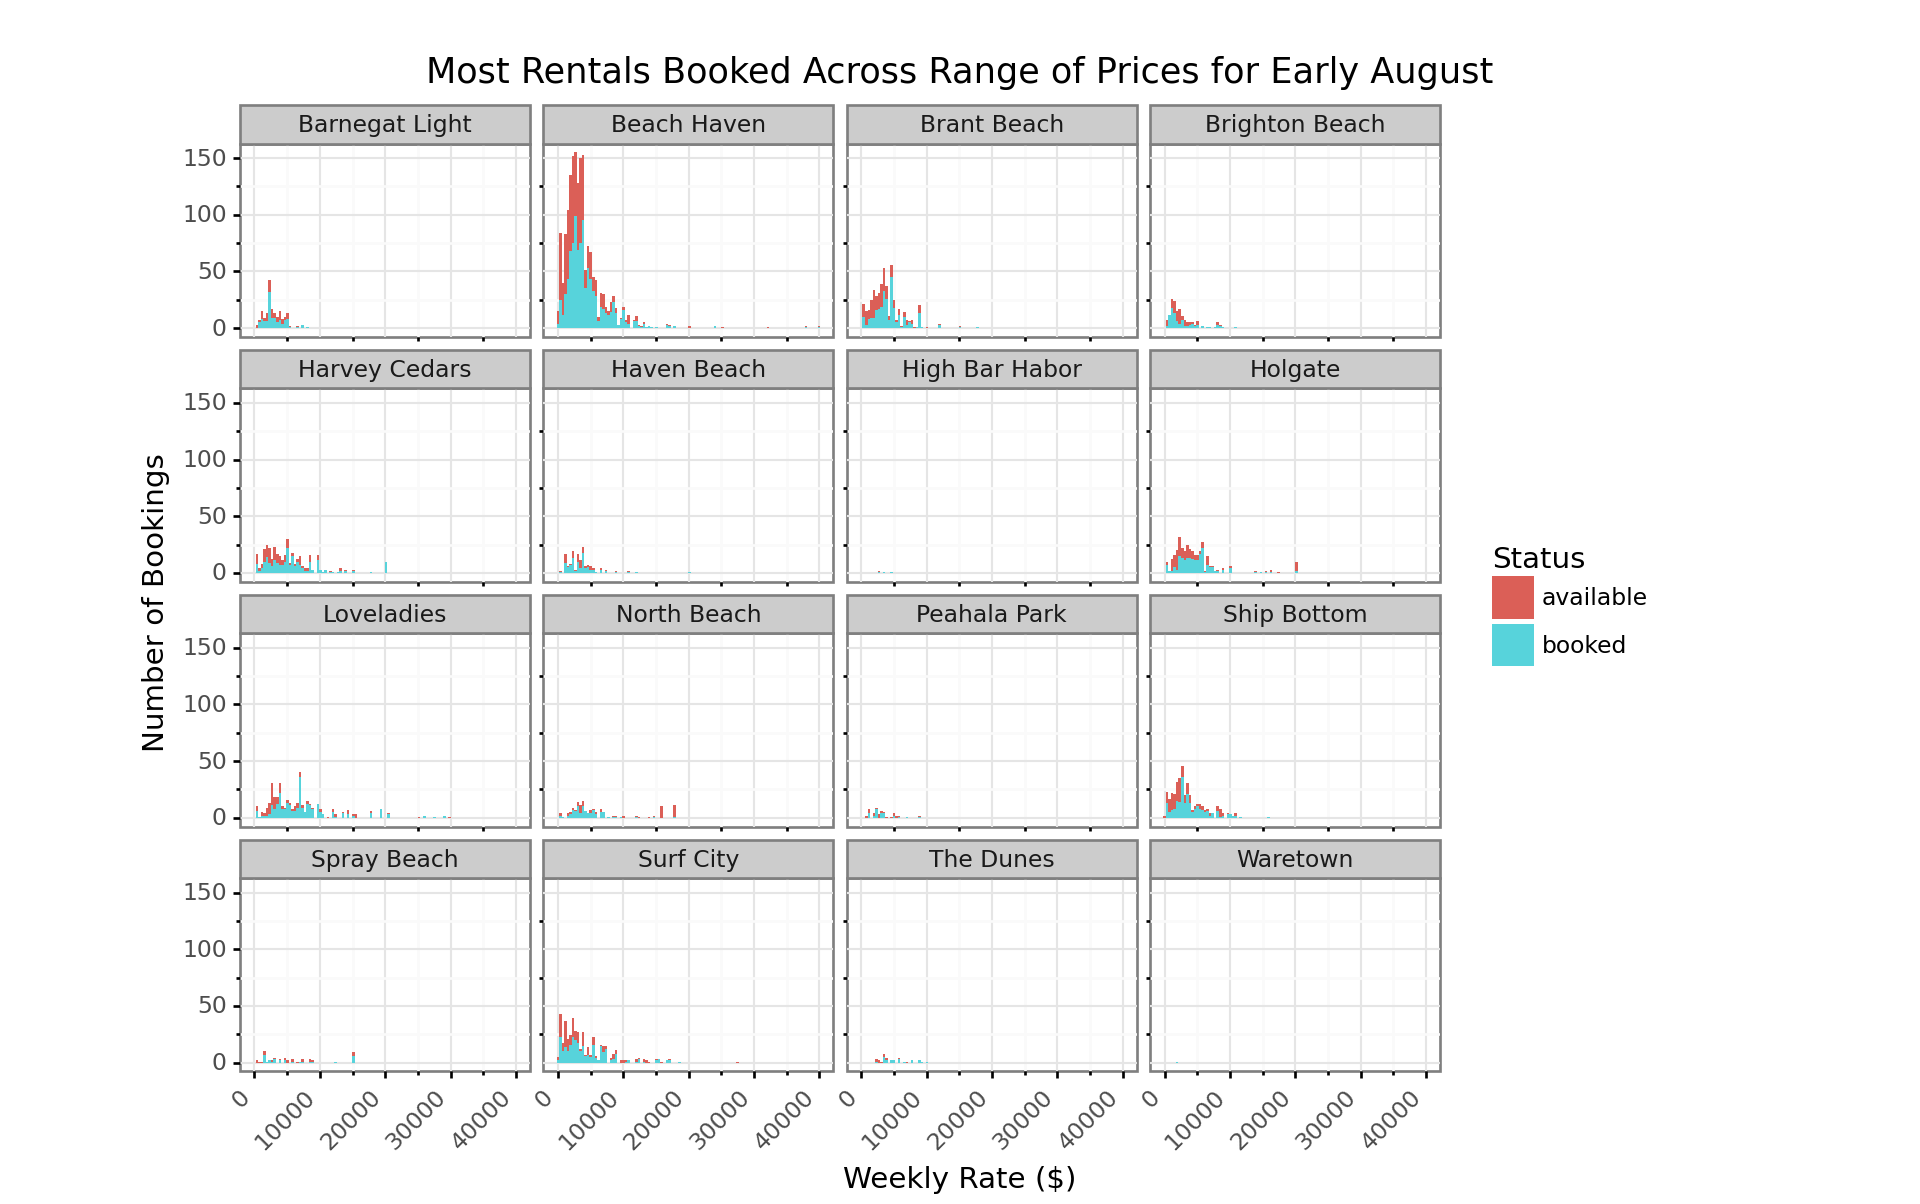
Beach Haven has more B&B’s and some of the only hotels on the Island, so smaller size properties on average and somewhat less consistent visitors. More rentals outside of Beach Haven are probably renewed annually, so it might be more impacted by delayed plans due to COVID-19 than other towns. Coupled with it being about as big as all the other towns put together, this may help explain why also shows a lot more relatively more red at this stage.
filtered_data = data[data['city'].notnull()].set_index('date')['2020']
(p9.ggplot(filtered_data,
    p9.aes('rate',
    group = 'status',
    fill = 'status')) +
    p9.geom_histogram(position ='stack') +
    p9.theme_bw() +
    p9.labs(
      title = "Most Rentals Booked Across Range of Prices for Early August",
      x = 'Weekly Rate ($)',
      y = 'Number of Bookings',
      fill = 'Status'
      ) +
    p9.theme(
      axis_text_x=p9.element_text(rotation=45, hjust=1),
      subplots_adjust={'right': 0.75},
      figure_size=(10, 4), # inches
      aspect_ratio=1/1.5,    # height:width
      legend_position='right',
      legend_direction='vertical') +
    p9.facet_wrap('~city')
)
## <ggplot: (8762329981746)>
##
## /Users/davidlucey/Library/r-miniconda/envs/r-reticulate/lib/python3.6/site-packages/plotnine/stats/stat_bin.py:93: PlotnineWarning: 'stat_bin()' using 'bins = 104'. Pick better value with 'binwidth'.
##   warn(msg.format(params['bins']), PlotnineWarning)
## /Users/davidlucey/Library/r-miniconda/envs/r-reticulate/lib/python3.6/site-packages/plotnine/layer.py:360: PlotnineWarning: stat_bin : Removed 25 rows containing non-finite values.
##   data = self.stat.compute_layer(data, params, layout)
Prices for Booked Properties Peaking in July
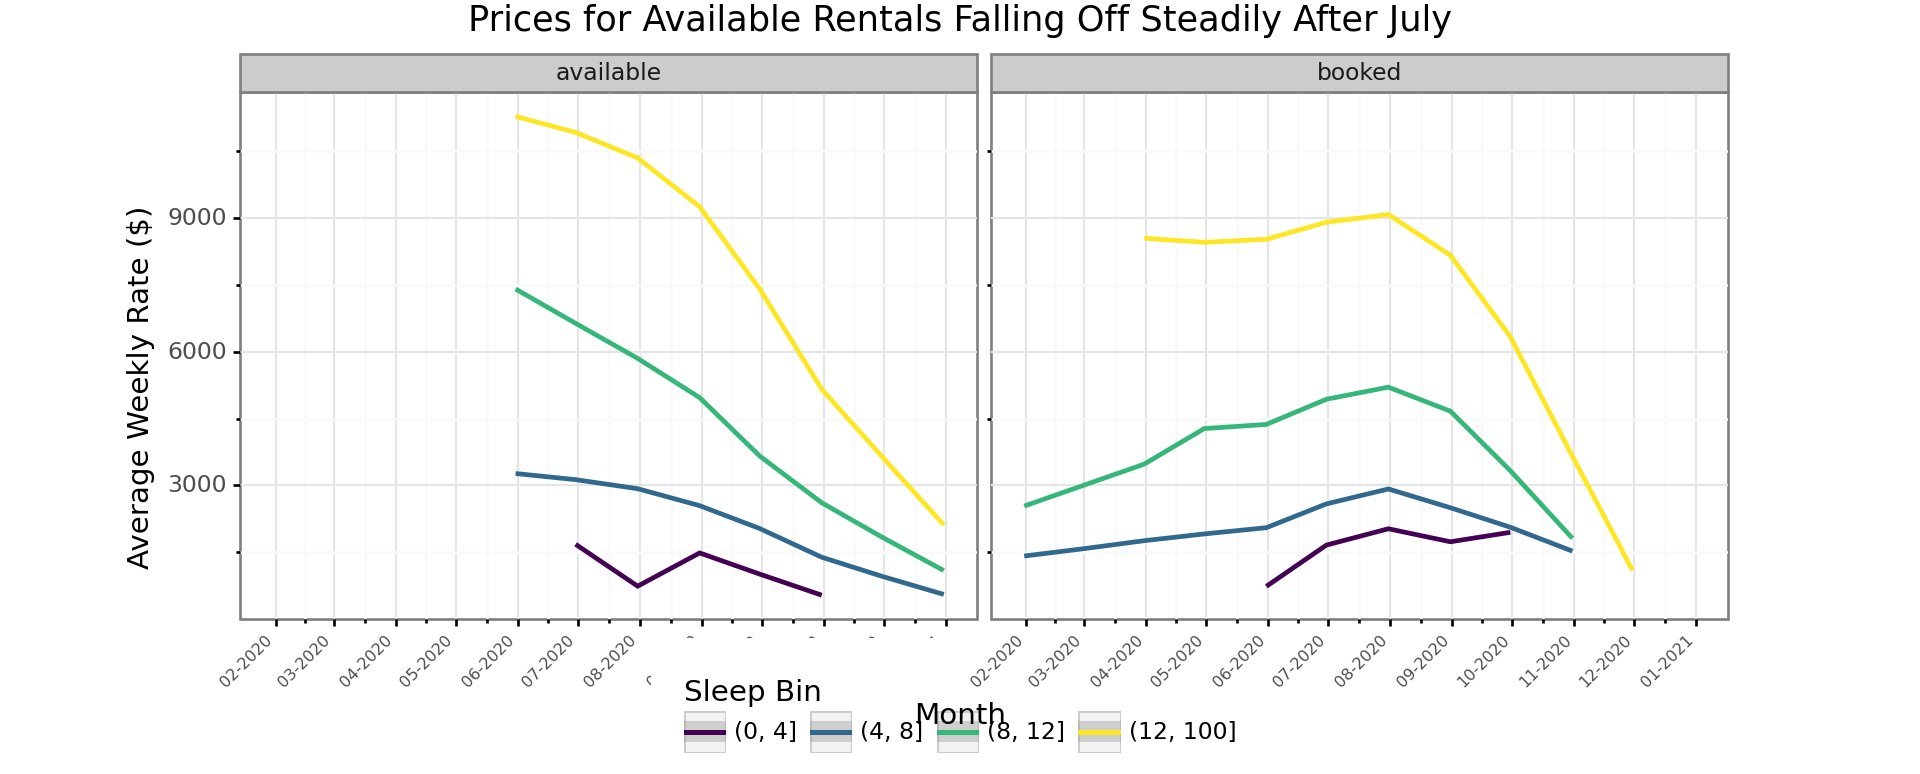
2020 might not be a typical year with the uncertainty around COVID-19, but the fall off in prices starting in August, when there appears to be more supply, is shown here. Landlords may have pulled supply for July when things looked uncertain and then put it back on at the last minute. It also looks like the available properties might be in that category, because they are priced higher than comparable properties. At least for the bigger properties, the posted prices of available properties are clearly higher than for the booked ones. Let’s face it, if you haven’t booked your property sleeping more than 8 by now, it might be tough for most groups of that size to organize at this late stage.
filtered_data = data.set_index('date')['2020'].groupby([pd.Grouper(freq='M'), 'status', 'sleeps_bin'])['rate'].mean().reset_index()
(p9.ggplot(filtered_data,
      p9.aes(x = 'date',
             y = 'rate',
             group = 'factor(sleeps_bin)',
             color = 'factor(sleeps_bin)'
             )) +
      p9.geom_smooth() +
      p9.theme_bw() +
      p9.scale_x_datetime(breaks=date_breaks('1 month'), labels=date_format('%m-%Y')) +
      p9.labs(
        title = "Prices for Available Rentals Falling Off Steadily After July",
        x = 'Month',
        y = 'Average Weekly Rate ($)',
        color = 'Sleep Bin'
        ) +
      p9.facet_wrap('~status') +
      p9.theme(
        axis_text_x=p9.element_text(rotation=45, hjust=1, size=6),
        subplots_adjust={'bottom': 0.20},
        figure_size=(10, 3), # inches
        aspect_ratio=1/1.4,    # height:width
        legend_position='bottom',
        legend_direction='horizontal')
)
## <ggplot: (-9223363274522058934)>
##
## /Users/davidlucey/Library/r-miniconda/envs/r-reticulate/lib/python3.6/site-packages/plotnine/stats/smoothers.py:168: PlotnineWarning: Confidence intervals are not yet implementedfor lowess smoothings.
##   "for lowess smoothings.", PlotnineWarning)
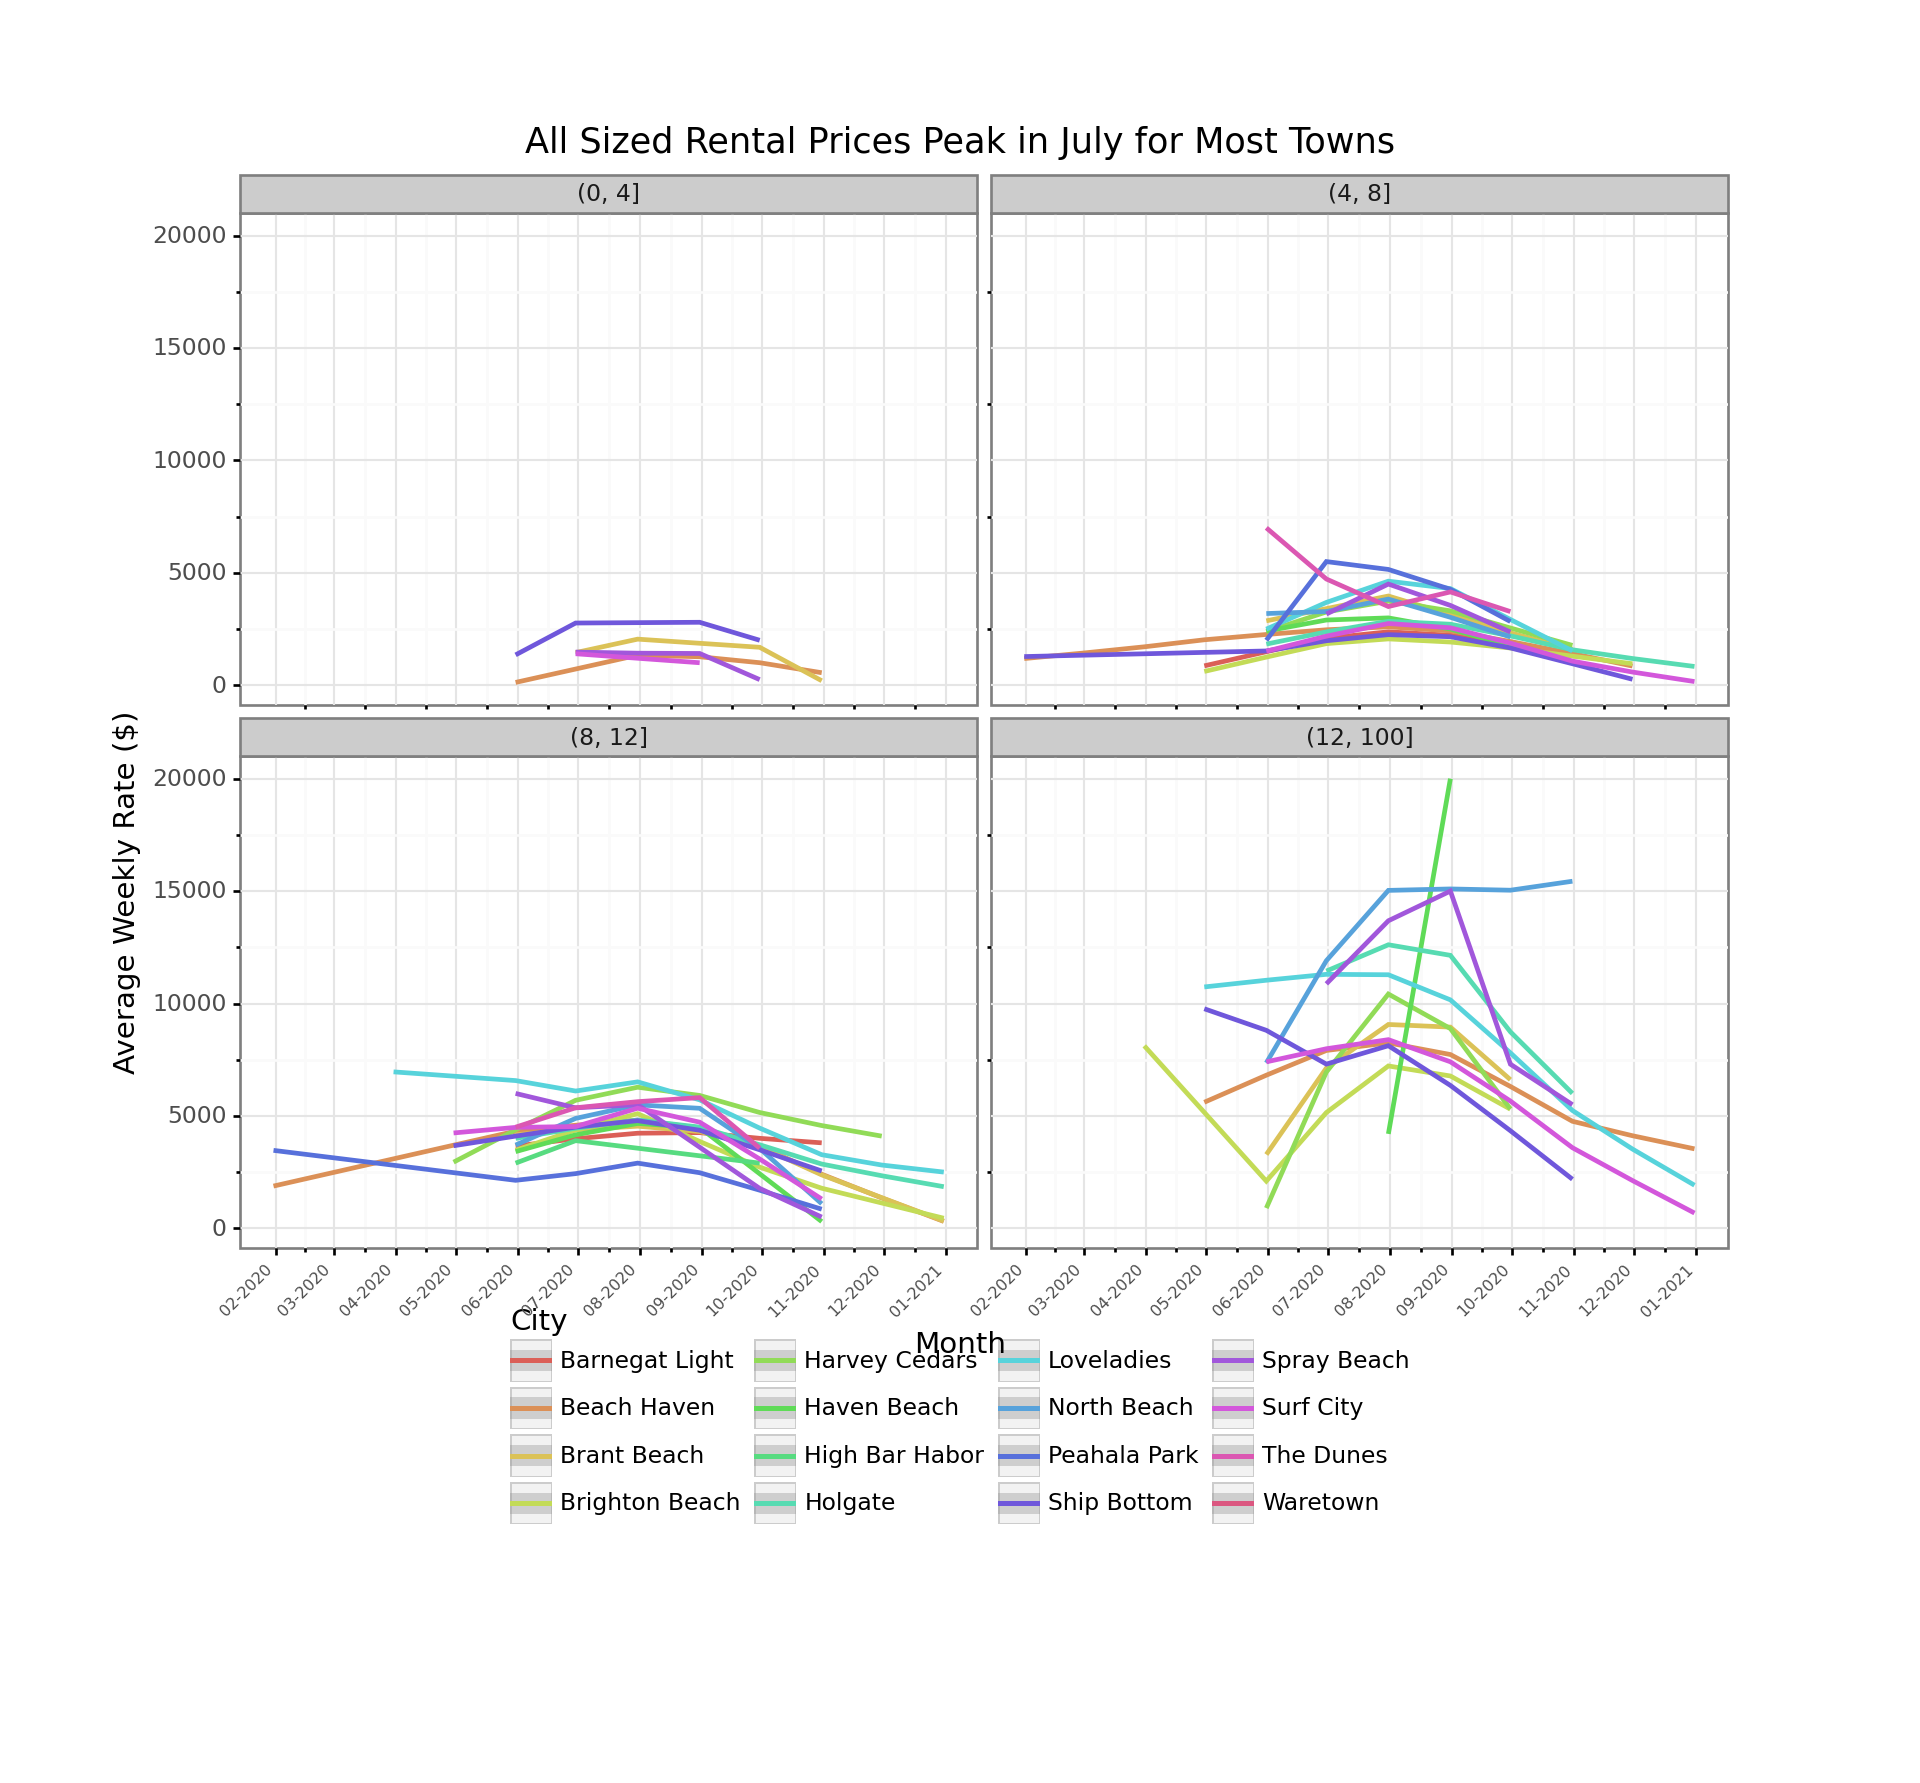
Homegenous Prices Across Cities
For anyone who has been to LBI, it is pretty much nice everywhere. Accept for maybe Loveladies, there aren’t really premium towns in the sense of the NYC suburbs. Loveladies shown in light blue can be seen towards the higher end, but still among the pack. The main distinction is if the house is beachfront or not, but unfortunately, we don’t have a good source of that data at this stage. The rents for the largest homes does show quite a bit more divergence among towns than the other three categories.
filtered_data = data.set_index('date')['2020'].groupby([pd.Grouper(freq='M'), 'city', 'sleeps_bin'])['rate'].mean().reset_index()
(p9.ggplot(filtered_data,
      p9.aes(x = 'date',
             y = 'rate',
             group = 'factor(city)',
             color = 'factor(city)'
             )) +
      p9.geom_smooth() +
      p9.theme_bw() +
      p9.scale_x_datetime(breaks=date_breaks('1 month'), labels=date_format('%m-%Y')) +
      p9.labs(
        title = "All Sized Rental Prices Peak in July for Most Towns",
        x = 'Month',
        y = 'Average Weekly Rate ($)',
        color = 'City'
        ) +
      p9.facet_wrap('~sleeps_bin') +
      p9.theme(
        axis_text_x=p9.element_text(rotation=45, hjust=1, size=6),
        subplots_adjust={'bottom': 0.30},
        figure_size=(10, 4), # inches
        aspect_ratio=1/1.5,    # height:width
        legend_position='bottom',
        legend_direction='horizontal')
)
## <ggplot: (8762332697201)>
##
## /Users/davidlucey/Library/r-miniconda/envs/r-reticulate/lib/python3.6/site-packages/plotnine/stats/smoothers.py:168: PlotnineWarning: Confidence intervals are not yet implementedfor lowess smoothings.
##   "for lowess smoothings.", PlotnineWarning)
Conclusion
Most families are constrained to July and early August, but for those with the freedom to go at other times, there is a lot of opportunity to have a great vacation at an affordable price! We also know that vacationrentalslbi.com also operates sites for Wildwood, North Wildwood, Wildwood Crest and Diamond Beach, so it our scraper would probably work the same for all of those. Now that we have the code, we can parse listings whenever considering a vacation at the Jersey Shore.
Author: David Lucey, Founder of Redwall Analytics
David spent 25 years working with institutional global equity research with several top investment banking firms.