How to Set Up Python's Scikit-Learn in R in 5 minutes
Written by Matt Dancho
The 2 most popular data science languages - Python and R - are often pitted as rivals. This couldn’t be further from the truth. Data scientists that learn to use the strengths of both languages are valuable because they have NO LIMITS.
- Machine Learning: They can switch to Python to leverage
scikit learn and tensorflow.
- Data Wrangling, Visualization, Apps & Reporting: They can quickly change to R to use
tidyverse, shiny and rmarkdown.
The bottom line is that knowing both R and Python makes you SUPER PRODUCTIVE.
Article Updates:
Have 5 minutes?
Then let’s set up Python Scikit Learn
Use feature engineering with timetk to forecast
We’re going to go through the essential setup tips of the PRO’s - those that use Python from R via reticulate.
-
Install the Anaconda Distribution
-
Get Python Scikit Learn Setup in R
-
Do a Cluster Analysis with Affinity Propagation Algorithm to make sure Scikit Learn is running.
Using Python Scikit Learn & R
How do I use them together for Business Projects???
Setting up Python in R is an insane productivity booster, but you still need to learn how to use Python and R together for real business projects. And, it’s impossible to teach you all the in’s and out’s in 1 short article. But, I have great news!
I just launched a NEW LEARNING LAB PYTHON + R SERIES (Register Here) that will show you how to use Python and R together on Real Business Projects:
- Lab 33: Human Resources Employee Segmentation
- Lab 34: Advanced Customer Segmentation and Market Basket Analysis
- Lab 35: TensorFlow for Finance
- Lab 36: TensorFlow for Energy Demand Forecasting
- Lab 37: Social Media Text Analytics!
And it’s FREE to attend live.
Register here to attend Python + R Learning Labs live for free. I’ll notify you in advance of the accelerated 1-hour courses that you can attend via webinar.
2 Steps to Python
Yeah, you heard me right. With only 2 steps, we are able to use Python in R!
Step 1 - Reticulate Setup
Fire up an R Markdown document and load tidyverse and reticulate:
tidyverse - Loads the core data wrangling and visualization packages needed to work in R.reticulate - The key link between R and Python.
library(tidyverse)
library(reticulate)
Your R Markdown should have something that looks like this (possibly without the outline, but that’s where we are headed).
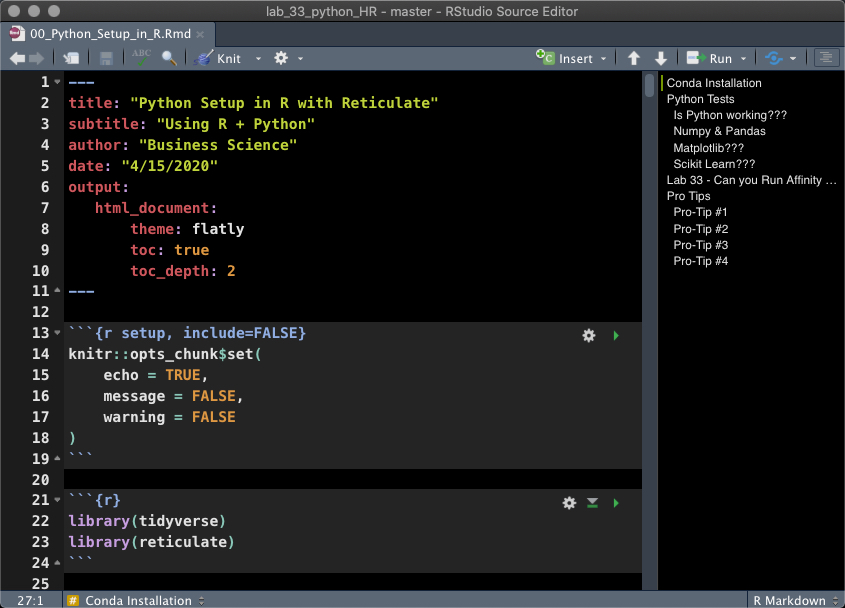
R Markdown (Rmd) File with reticulate
Step 2 - Conda Installation
Next, we need to make sure we have the Python Environment setup that we want to use. For Python Environments, we will use Anaconda (Conda), a python environment management tool specifically developed for data scientists.
Download Conda
Create a New Python Environment
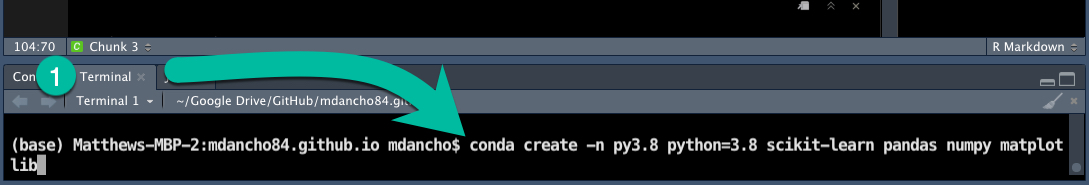
- Run the following code in your terminal:
conda create -n py3.8 python=3.8 scikit-learn pandas numpy matplotlib
This code does the following:
- Creates a new Python environment called “py3.8”
- Installs
python version 3.8
- Installs the latest versions of
scikit-learn, pandas, numpy, and matplotlib.
In the future you can always add more python packages (more on this in Pro Tips).
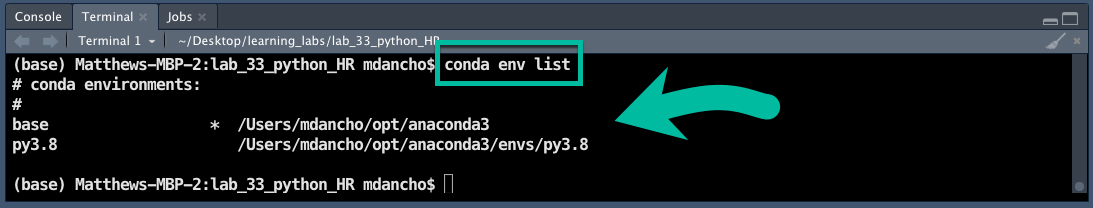
List your Conda Environments (in the Terminal)
- Use
conda list env to list your Conda Environments in the Terminal.
- If you see
py3.8, you are good to go.
List your Conda Enviromnents (in R Markdown)
Back in R Markdown, we can do the same thing using retculate::conda_list().
conda_list()
##        name                                             python
## 1 anaconda3            /Users/mdancho/opt/anaconda3/bin/python
## 2     py3.8 /Users/mdancho/opt/anaconda3/envs/py3.8/bin/python
Set Your Conda Environment (in R Markdown)
Make sure your R Markdown document activates the “py3.8” environment using use_condaenv().
use_condaenv("py3.8", required = TRUE)
Double check that reticulate is actually using your new conda env.
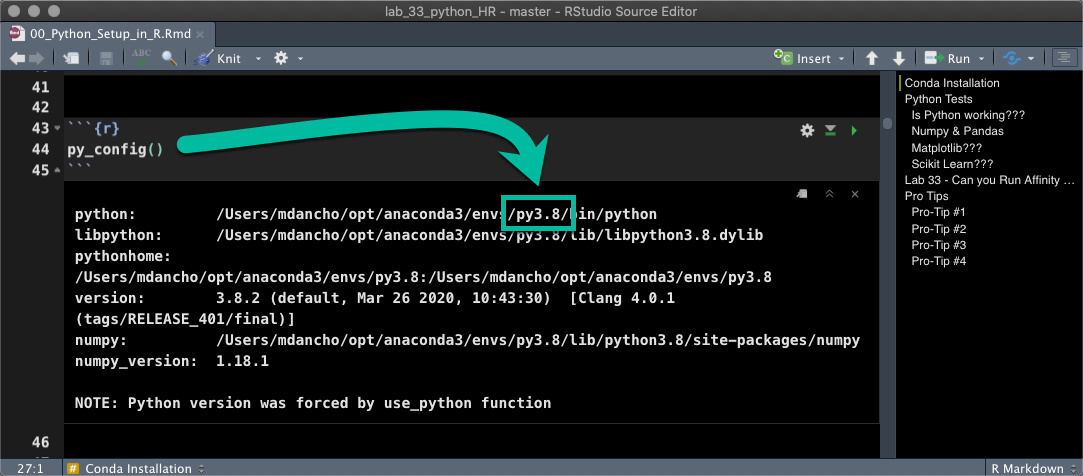
py_config()
## python:         /Users/mdancho/opt/anaconda3/envs/py3.8/bin/python
## libpython:      /Users/mdancho/opt/anaconda3/envs/py3.8/lib/libpython3.8.dylib
## pythonhome:     /Users/mdancho/opt/anaconda3/envs/py3.8:/Users/mdancho/opt/anaconda3/envs/py3.8
## version:        3.8.2 (default, Mar 26 2020, 10:43:30)  [Clang 4.0.1 (tags/RELEASE_401/final)]
## numpy:          /Users/mdancho/opt/anaconda3/envs/py3.8/lib/python3.8/site-packages/numpy
## numpy_version:  1.18.1
##
## NOTE: Python version was forced by use_python function
You should see something like this where the python path is:
python: /Users/mdancho/opt/anaconda3/envs/py3.8/bin/python.
It may not be exact, but you should see “py3.8” in the file path.
Python Tests
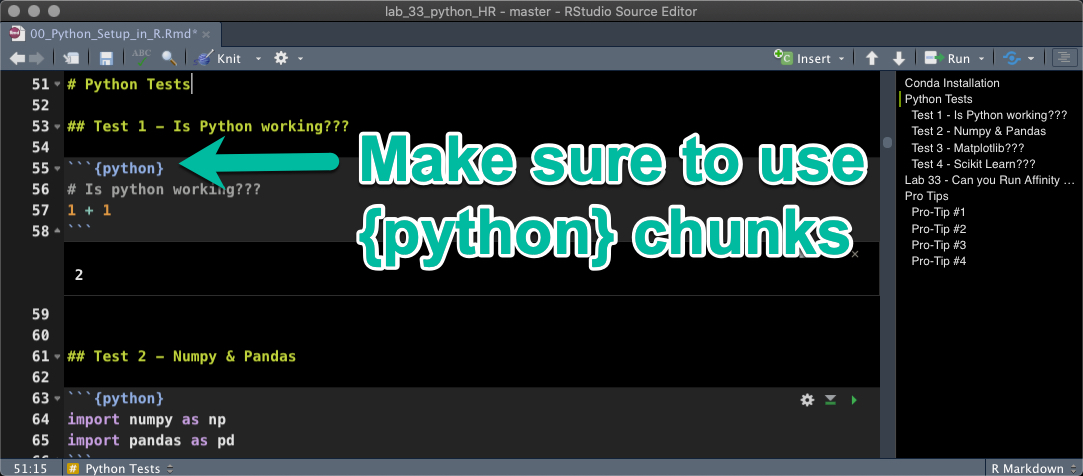
All of the code in this section uses python code chunks. This means you need to use {python} instead of {r} code chunks.
- Errors in this section: Are likely because you have a code chunk with
{r} (it’s super easy to make this mistake)
- Solution: Replace
{r} with {python}.
Spoiler alert - I have a PRO-TIP coming that helps big time.
Test 1 - Is Python working???
- Let’s add 1 + 1
- You should see 2
# Is python working???
1 + 1
## 2
Test 2 - Numpy & Pandas
- Import
numpy and pandas using the import shorthand np and pd respectively.
numpy - Math Calculationspandas - Data Wrangling
import numpy as np
import pandas as pd
Numpy
Test numpy using the np.arange() function to create a sequence of numbers in an array.
np.arange(1, 10)
## array([1, 2, 3, 4, 5, 6, 7, 8, 9])
Pandas
Next, test pandas by creating a data frame df using pd.DataFrame().
# Make a sequence in a data frame using dict format
df = pd.DataFrame(data = {"sequence":np.arange(1,20,.01)})

# Use assign (mutate) equivalent to calculate the np.sin() of the series
df = df.assign(value=np.sin(df["sequence"]))

df
##       sequence     value
## 0         1.00  0.841471
## 1         1.01  0.846832
## 2         1.02  0.852108
## 3         1.03  0.857299
## 4         1.04  0.862404
## ...        ...       ...
## 1895     19.95  0.891409
## 1896     19.96  0.895896
## 1897     19.97  0.900294
## 1898     19.98  0.904602
## 1899     19.99  0.908819
##
## [1900 rows x 2 columns]
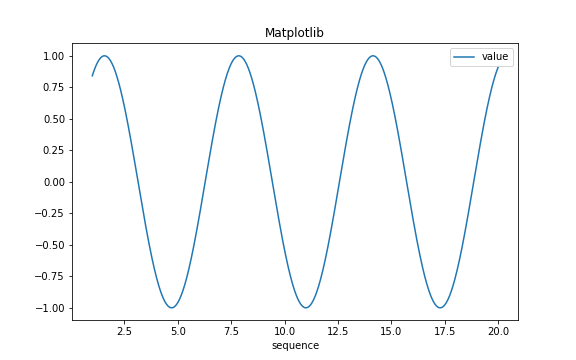
Test 3 - Matplotlib
Run the following pandas plotting code. If the visualization appears, matplotlib is installed.
import matplotlib as plt

df.plot(x="sequence", y = "value", title = "Matplotlib")
Test 4 - Scikit Learn
Run a test Random Forest using RandomForestClassifier from the sklearn.ensemble module of Scikit Learn.
from sklearn.ensemble import RandomForestClassifier

clf = RandomForestClassifier(random_state=0)

X = [[ 1,  2,  3],  # 2 samples, 3 features
     [11, 12, 13]]

y = [0, 1]  # classes of each sample

clf.fit(X, y)
## RandomForestClassifier(bootstrap=True, ccp_alpha=0.0, class_weight=None,
##                        criterion='gini', max_depth=None, max_features='auto',
##                        max_leaf_nodes=None, max_samples=None,
##                        min_impurity_decrease=0.0, min_impurity_split=None,
##                        min_samples_leaf=1, min_samples_split=2,
##                        min_weight_fraction_leaf=0.0, n_estimators=100,
##                        n_jobs=None, oob_score=False, random_state=0, verbose=0,
##                        warm_start=False)
Use the predict() method to make a prediction on the training data set.
clf.predict(X) # predict classes of the training data
## array([0, 1])
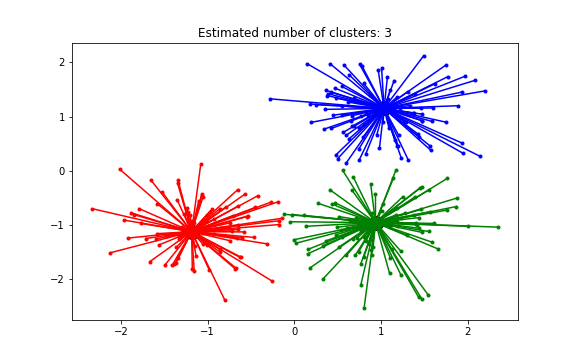
Can you Run Affinity Progagation???
If you are planning to attend Learning Lab 33 - HR Analytics Employee Clustering with Python Scikit Learn (Register Here), you will need to be able to perform the following algorithms to comple an Employee Clustering and Termination Analysis Project:
- Affinity Propagation and DBSCAN Clustering Algorithms
- TSNE Manifold Embedding
A simple test is to run the AffinityPropagation test from Scikit Learn’s website.
from sklearn.cluster import AffinityPropagation
from sklearn.datasets import make_blobs

# #############################################################################
# Generate sample data
centers = [[1, 1], [-1, -1], [1, -1]]
X, labels_true = make_blobs(n_samples=300, centers=centers, cluster_std=0.5,
                            random_state=0)

# Compute Affinity Propagation
af = AffinityPropagation(preference=-50).fit(X)
cluster_centers_indices = af.cluster_centers_indices_
labels = af.labels_

n_clusters_ = len(cluster_centers_indices)

# #############################################################################
# Plot result
import matplotlib.pyplot as plt
from itertools import cycle

plt.close('all')
plt.figure(1)
plt.clf()

colors = cycle('bgrcmykbgrcmykbgrcmykbgrcmyk')
for k, col in zip(range(n_clusters_), colors):
    class_members = labels == k
    cluster_center = X[cluster_centers_indices[k]]
    plt.plot(X[class_members, 0], X[class_members, 1], col + '.')
    plt.plot(cluster_center[0], cluster_center[1], 'o', markerfacecolor=col,
             markeredgecolor='k', markersize=14)
    for x in X[class_members]:
        plt.plot([cluster_center[0], x[0]], [cluster_center[1], x[1]], col)

plt.title('Estimated number of clusters: %d' % n_clusters_)
plt.show()
Become Great at Shiny
Up until now we haven’t talked about Shiny! It’s web application framework that is used to take your python and R machine learning models into Production.
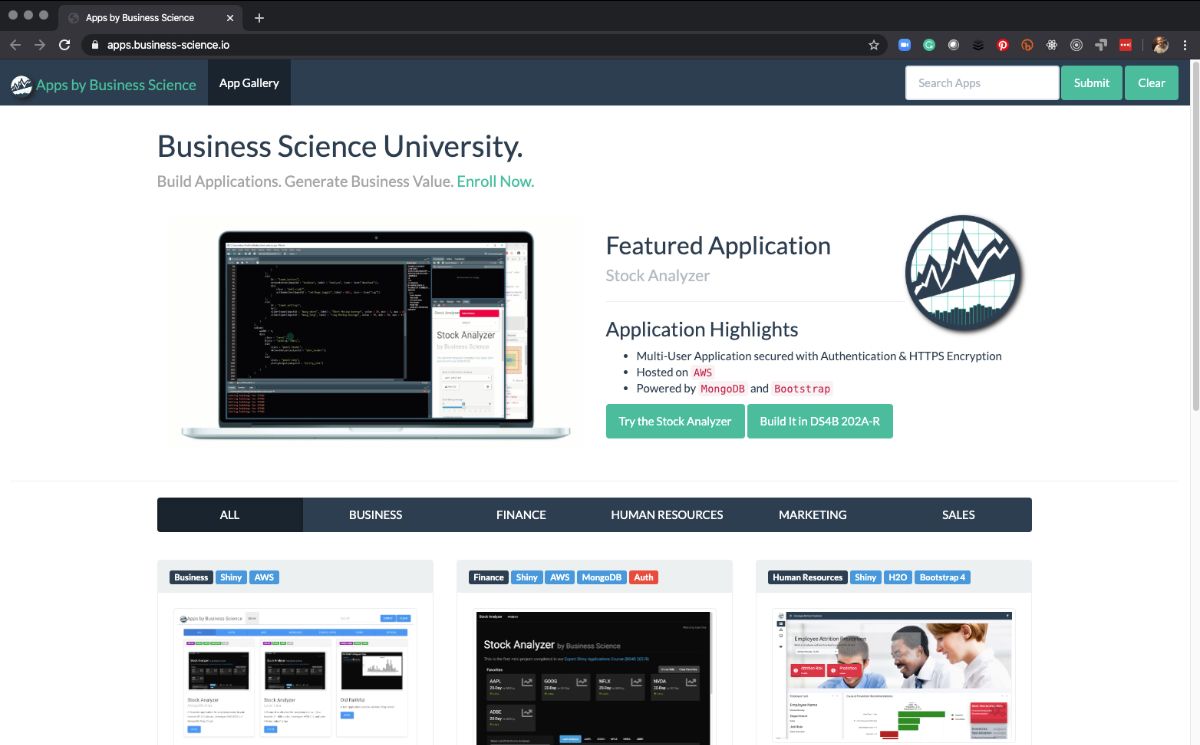
Business Science Application Library
A Meta-Application that houses Shiny Apps
R Shiny needs to be in your toolbox if you want to productionize Data Science. You simply cannot put machine learning applications into production with other “BI” Tools like Tableau, PowerBI, and QlikView.
CRITICAL POINT: You can USE SHINY to productionize python Scikit Learn and Tensorflow Models
If you need to learn R Shiny as fast as possible, I have the perfect program for you. It will accelerate your career. The 4-Course R-Track Bundle through Business Science.
Pro Tips (Python in R)
Now that you have python running in R, use these pro-tips to make your experience way more enjoyable.
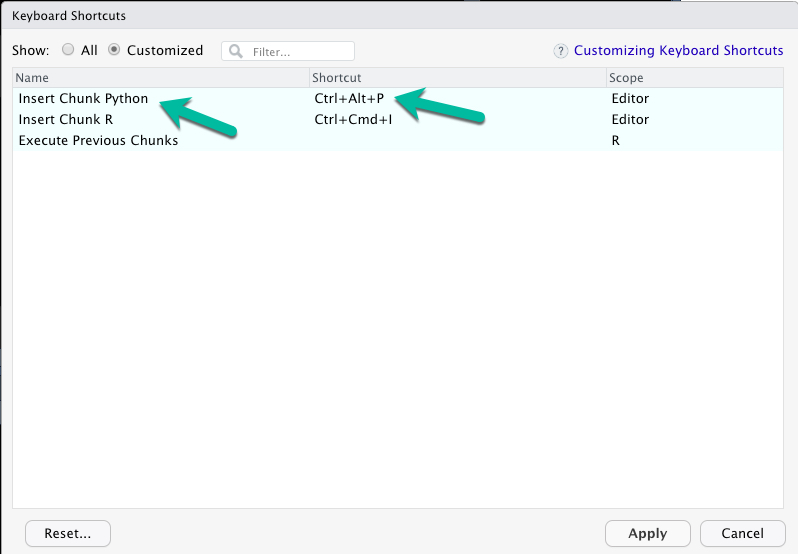
Pro-Tip #1 - Python Chunk Keyboard Shortcut
I can’t stress this one enough - Set up a Keyboard shortcut for Python Code Chunks. This is a massive productivity booster for Rmarkdown documents.
- My preference:
Ctrl + Alt + P
When you hit Ctrl + Alt + P, a {python} code chunk will appear in your R Markdown document.
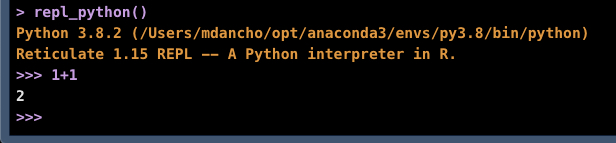
Pro-Tip #2 - Use Python Interactively
For debugging Python Code Chunks in R Markdown, it can help to use the repl_python() to convert your Console to a Python Code Console. To do so:
- In R Console, you can run python interactively using
repl_python(). You will see >>> indicating you are in Python Mode.
- Make sure the correct Python / Conda Environment is selected.
- To escape Python in the console, just hit
escape.
Pro-Tip #3 - 4 Conda Terminal Commands
At some point you will need to create, modify, add more packages to your Conda Environment(s). Here are 4 useful commands:
- Run
conda env list to list the available conda environments
- Run
conda activate <env_name> to activate a conda environment
- Run
conda update --all to update all python packages in a conda environment.
- Run
conda install <package_name> to install a new package
Have questions on using Python + R?
Make a comment in the chat below. 👇
And, if you plan on using Python + R at work, it’s a no-brainer - attend my Learning Labs (they are FREE to attend live).