The Top 5 Time Series Analysis Concepts (that helped me the most in my career)
Written by Matt Dancho
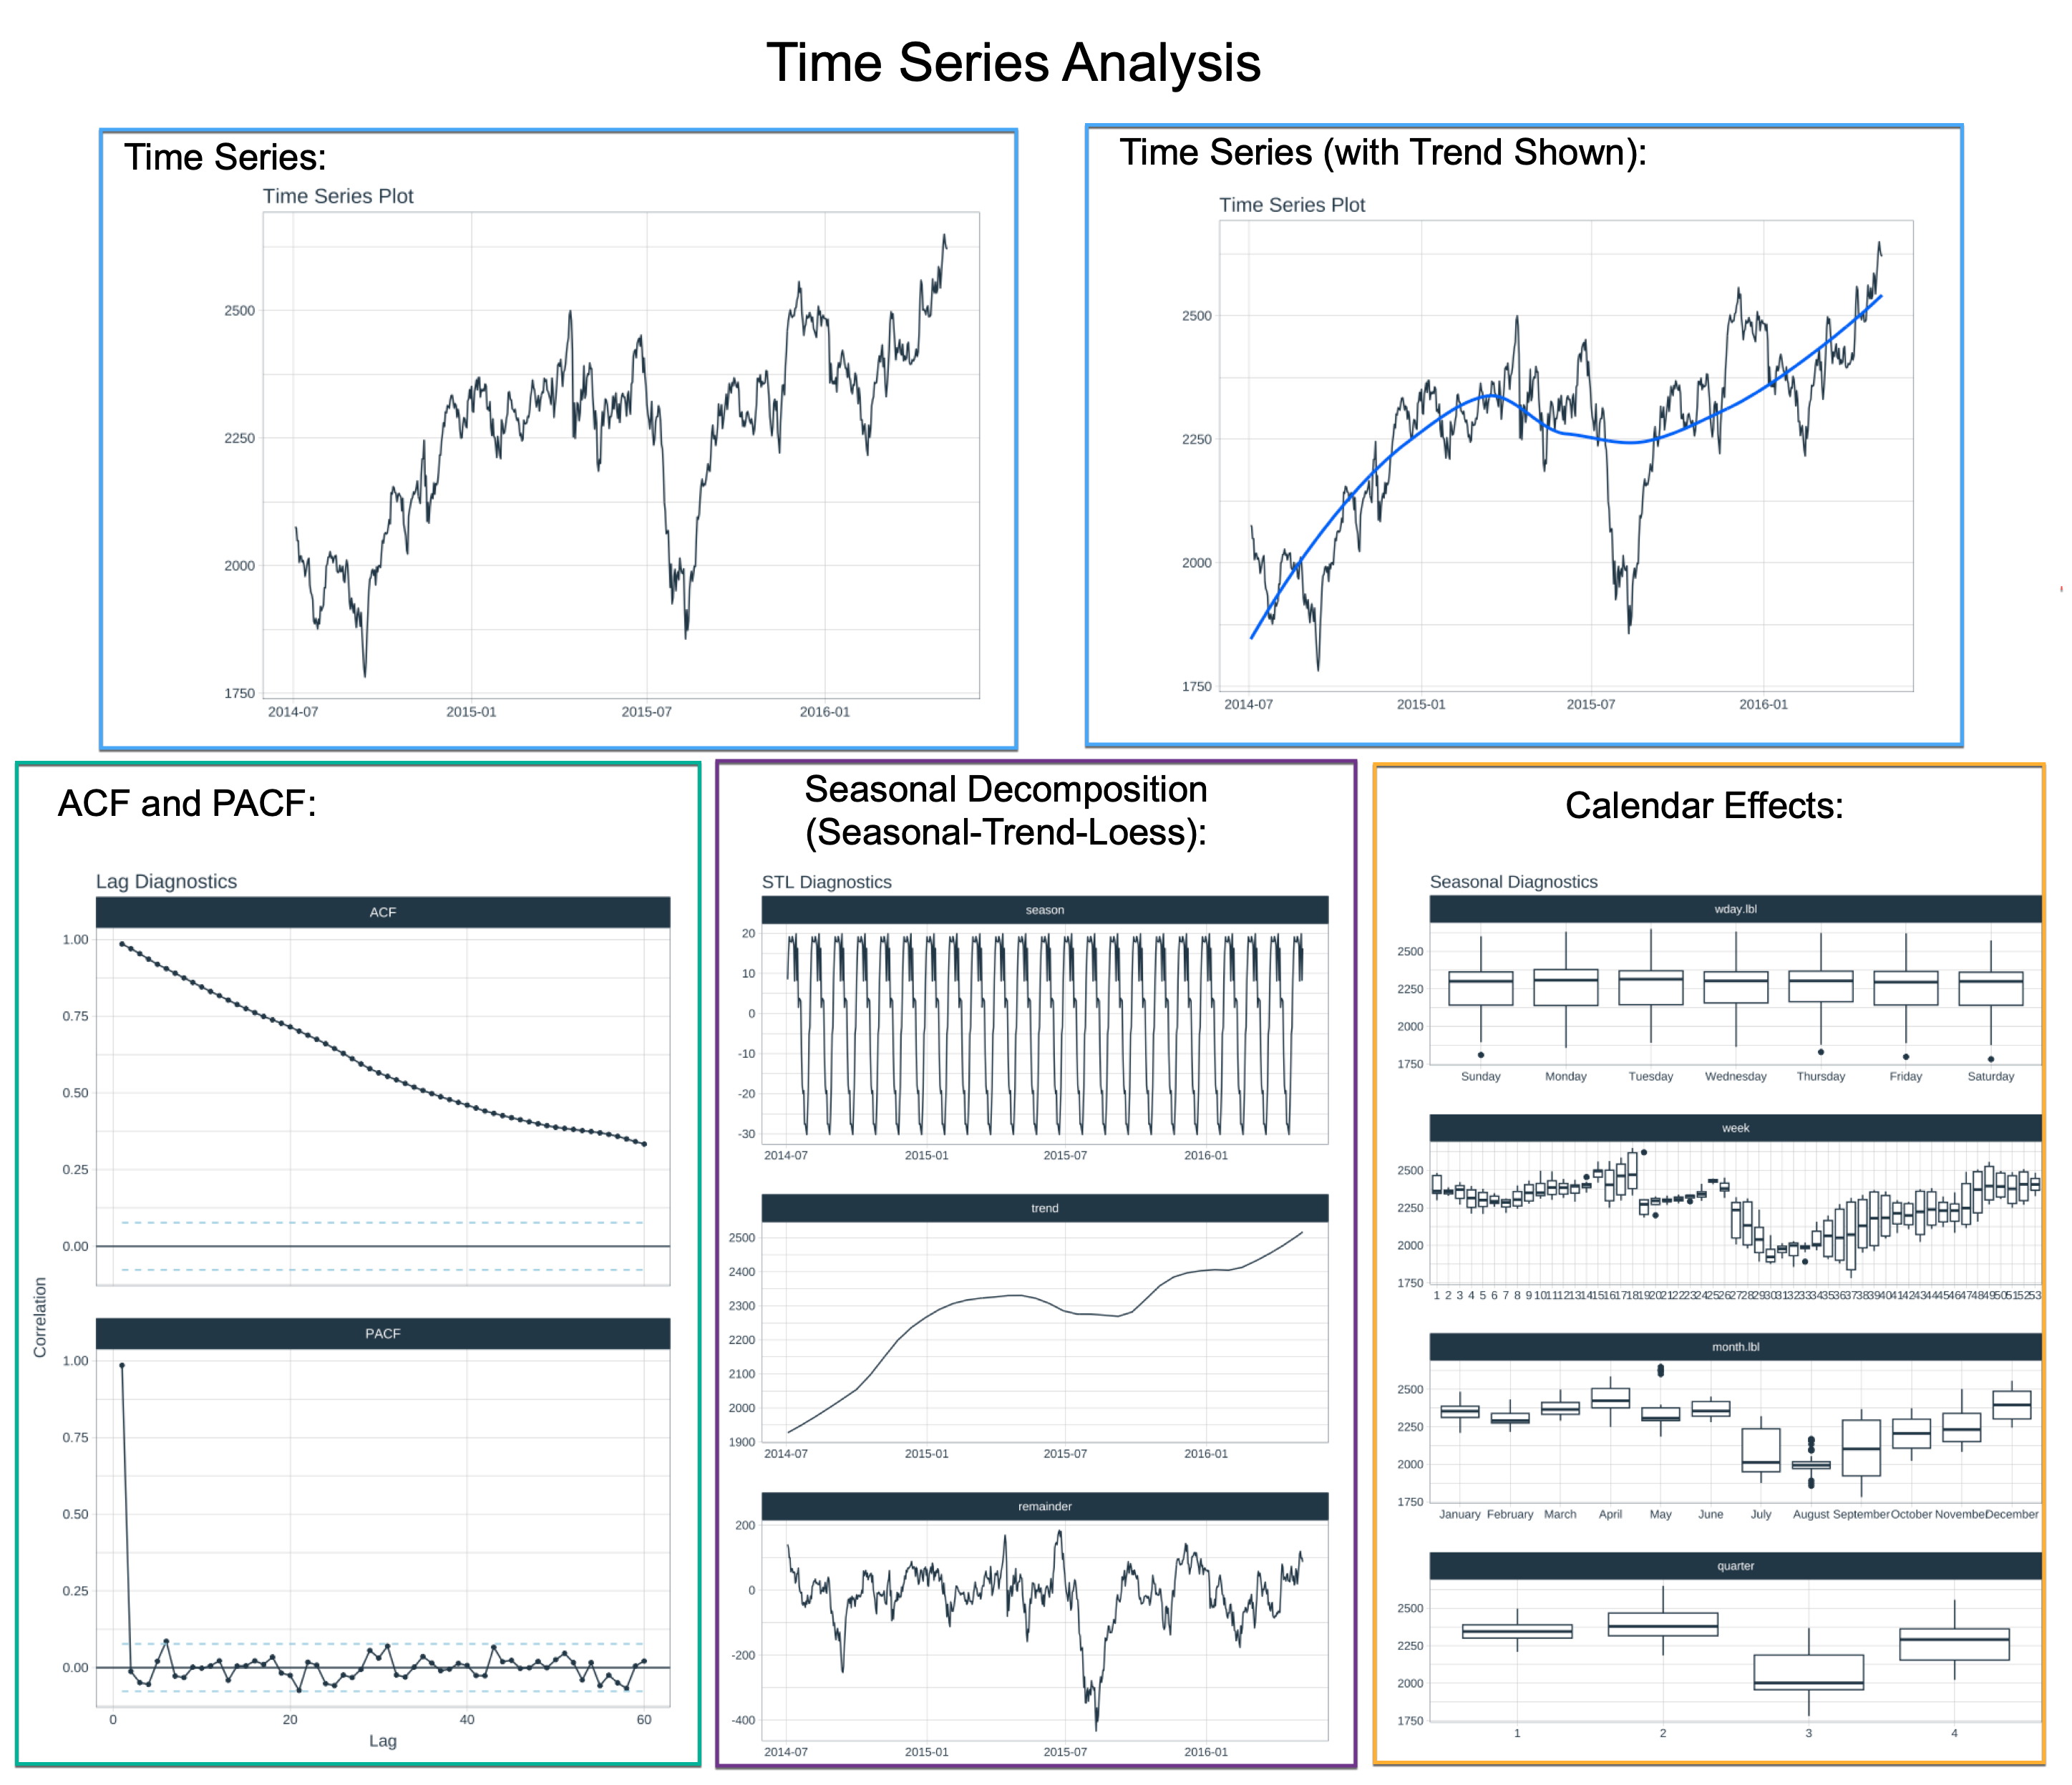
Hey guys, welcome back to my R-tips newsletter. Time series analysis has been critical in my career. But it took me 3 years to get comfortable. In today’s R-Tip, I’ll share 3 years of experience in time series in 3 minutes. Let’s go!
Table of Contents
Here’s what you’re learning today:
- What is Time Series Analysis? I’ll explain what time series analysis is and why it was important to me to learn it.
- The 5 Concepts that Helped Me the Most in My Career. I’ll share the 5 concepts that helped me the most in my career.
- How to Make the 5 Top Time Series Visualizations in 5 lines of R code. I’ll show you how to make the 5 top time series visualizations in 5 lines of R code.

Time Series Analysis (Top 5 Visualizations)
SPECIAL ANNOUNCEMENT: AI for Data Scientists Workshop on December 18th
Inside the workshop I’ll share how I built a SQL-Writing Business Intelligence Agent with Generative AI:
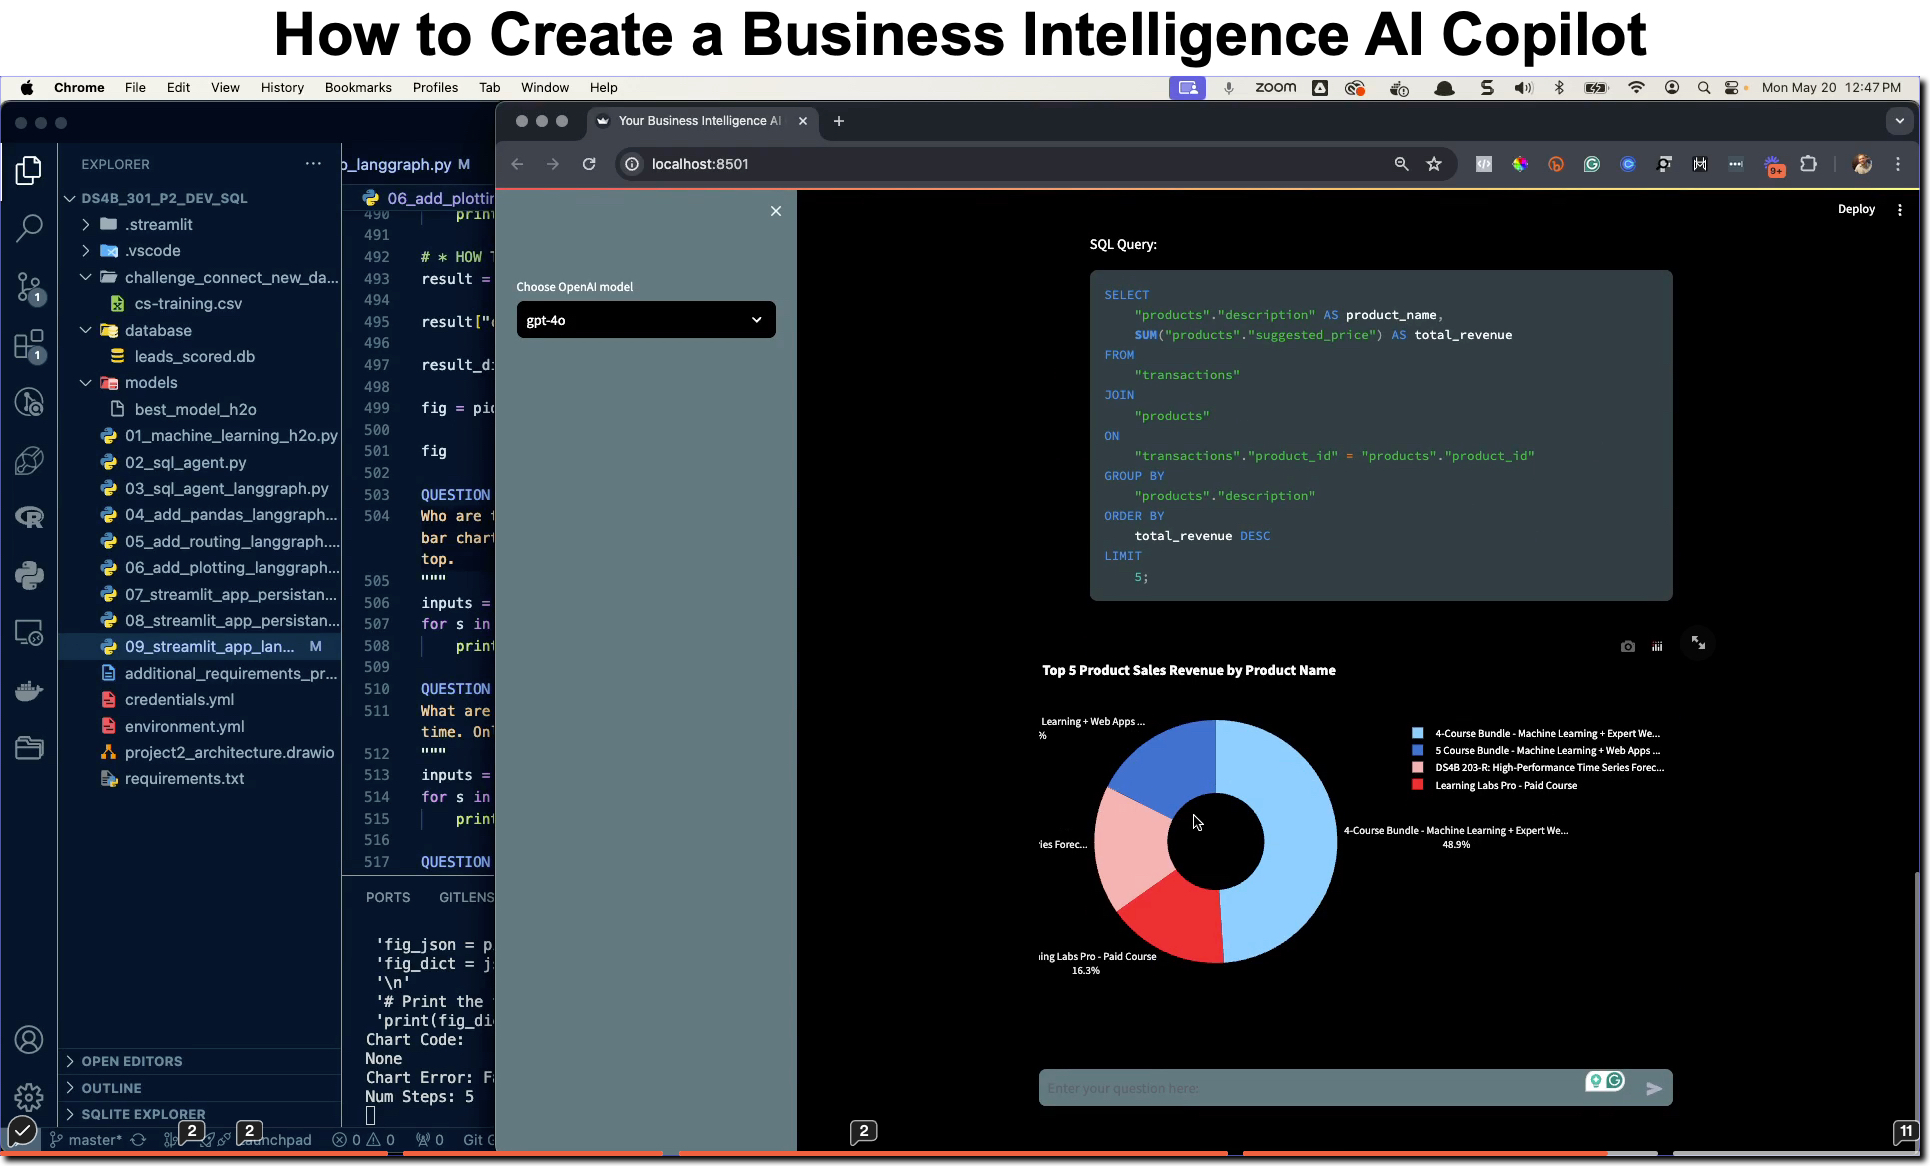
What: GenAI for Data Scientists
When: Wednesday December 18th, 2pm EST
How It Will Help You: Whether you are new to data science or are an expert, Generative AI is changing the game. There’s a ton of hype. But how can Generative AI actually help you become a better data scientist and help you stand out in your career? I’ll show you inside my free Generative AI for Data Scientists workshop.
Price: Does Free sound good?
How To Join: 👉 Register Here
R-Tips Weekly
This article is part of R-Tips Weekly, a weekly video tutorial that shows you step-by-step how to do common R coding tasks. Pretty cool, right?
Here are the links to get set up. 👇
My dirty little secret… How I 2x-ed my salary in 3 years using Time Series Analysis
It was 2015. I was working for a manufacturer that supplied products for Oil and Gas. The company was struggling. The price of oil had dropped from $100 to $30 leading to the worst performance in over 2 decades.
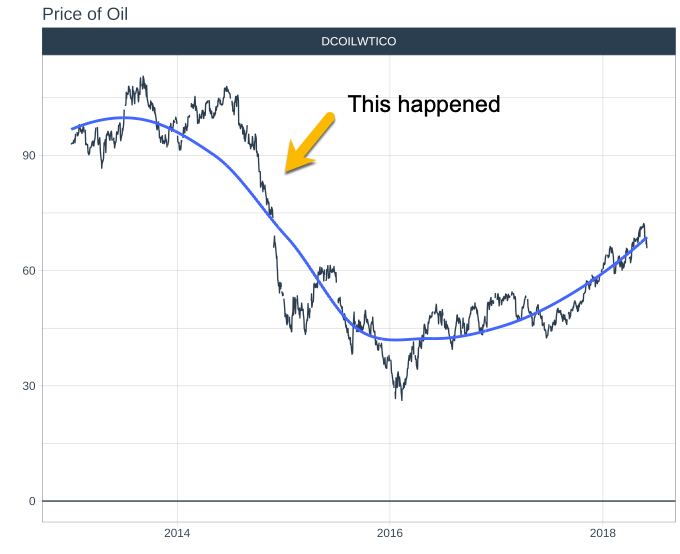
I was working on a project to forecast product sales when I stumbled upon something. I found that the sales for certain products were highly correlated with the 3-month lag of the price of oil.
With this information, I was able to forecast sales for the next 3 months with 95% accuracy. This was a game-changer for the company. We were able to forecast sales and adjust production to meet demand.
Impact on my career: This led to 3 promotions in 3 years. I went from a Manager of Sales to the Director of Sales and Engineering leading 60+ person sales team when I left in 2018. But I had a secret…
My dirty little secret: Behind the scenes I was using R and time series analysis to get ahead in my career. Specifically, I used autocorrelation and partial autocorrelation to find the signal. The same techniques that you’re learning today.
What is Time Series Analysis?
Time series analysis is a statistical technique that deals with time-ordered data points. It’s commonly used to analyze and interpret trends, patterns, and relationships within data that is recorded over time (e.g. with timestamps).
Uses in Business
Understanding and applying time series analysis concepts is critical for forecasting, detecting anomalies, and drawing insights on data that varies over time.
Time series data is everywhere. Anything with a timestamp is a time series. Product sales, website traffic, stock prices, and weather data are all examples of time series data. It is used in many industries including finance, retail, marketing, and manufacturing.
Time Series Analysis is important because it allows us to understand the past and predict the future. Time series analysis is used to understand the past and predict the future. It is used in many industries including finance, retail, marketing, and manufacturing.
The 5 Concepts that Helped Me the Most in My Career (and how to do them in R)

The 5 Concepts that helped me the most
R Code
Get The Code: You can follow along with the R code in the R-Tips Newsletter. All code is avaliable in R-Tip 075.
1. Visualizing Time Series Data
Visualizing time series is the start of all of my time series analysis. This is the first step in understanding the data.
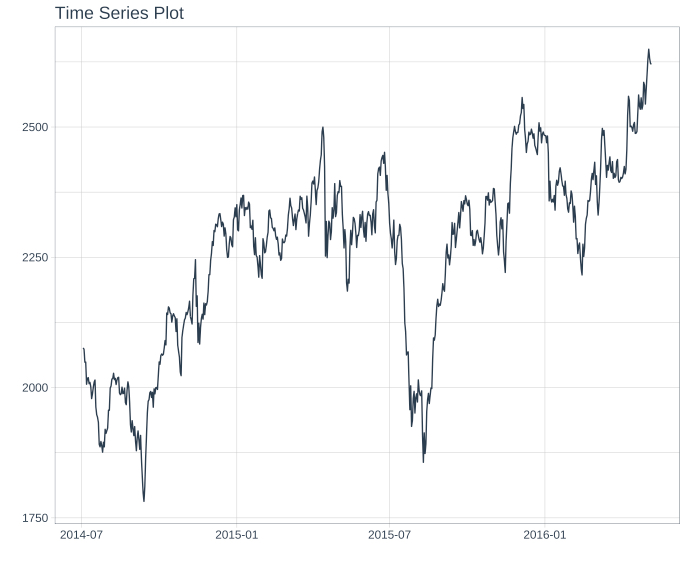
R code to make this plot:
The main functions come from timetk. Full disclosure- I’m the author of timetk. I created timetk to make time series analysis easier.
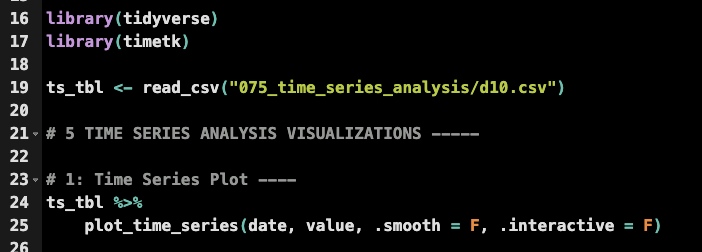
Get the Code (In the R-Tip 075 Folder)
Time Series is Noisy (Finding the Signal)
Often, time series data is noisy. We can use smoothing to find the signal. LOESS smoothing is a technique that uses local regression to smooth out the noise.
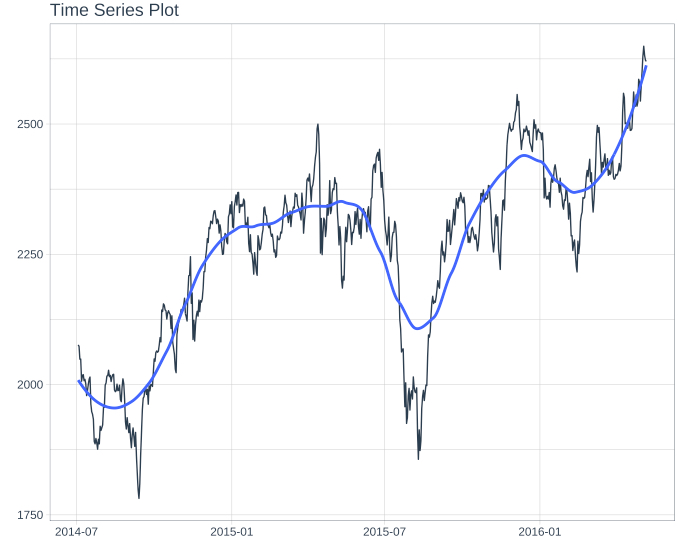
R code to make Visualization 2:
It’s the same function, but now we turn .smooth = TRUE. You can adjust the value of the smoother span to get different results.

Get the Code (In the R-Tip 075 Folder)
3. Autocorrelation and Partial Autocorrelation
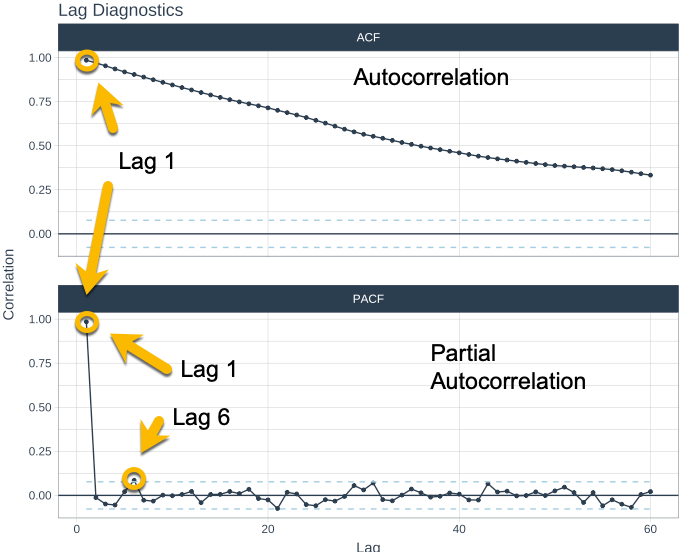
Autocorrelation: This refers to the correlation of a time series with its own past and future values. It measures the relationship (correlation) between a variable’s current value and its past values.
Partial Autocorrelation: Autocorrelation has a problem. Some of the correlation is confounded by earlier lags. Enter Partial Autocorrelation. This removes the correlation effect of earlier lags. We can see that Lag 1 and 6 are the most important for this time series.
R Code to make this plot:

Get the Code (In the R-Tip 075 Folder)
4. Seasonal Decomposition
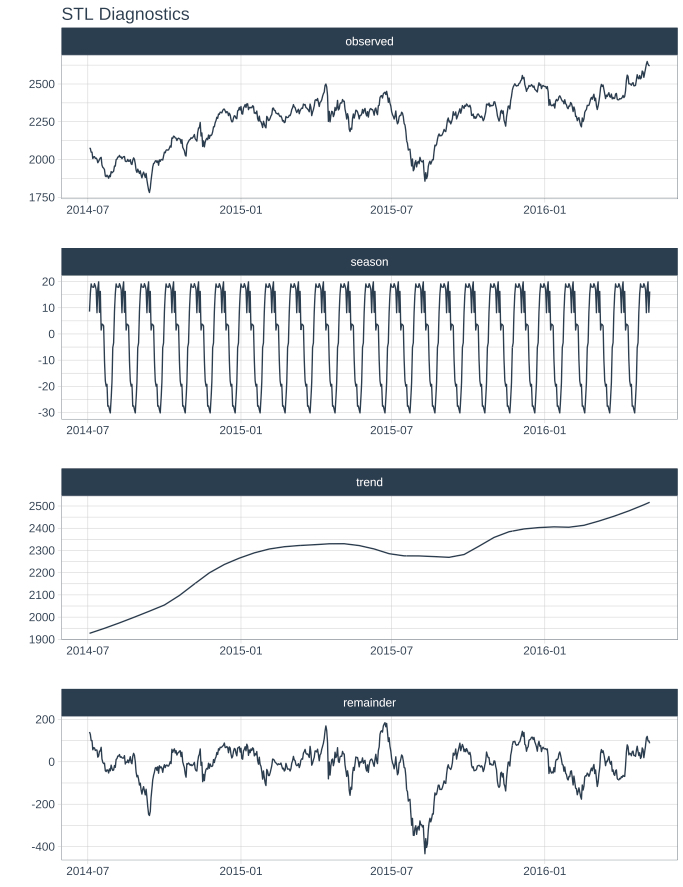
Seasonal decomposition decomposes a time series into three components: trend, seasonal, and residual (irregular). STL stands for Seasonal-Trend-Loess.
It uses a “LOESS” smoother to remove seasonal and trend effects. STL is flexible and can handle any type of seasonality, not just fixed seasonal effects.
The residuals can be analyzed for outliers since they have been de-trended and de-seasonalized.
R Code to make this plot:

Get the Code (In the R-Tip 075 Folder)
5. Calendar Effects
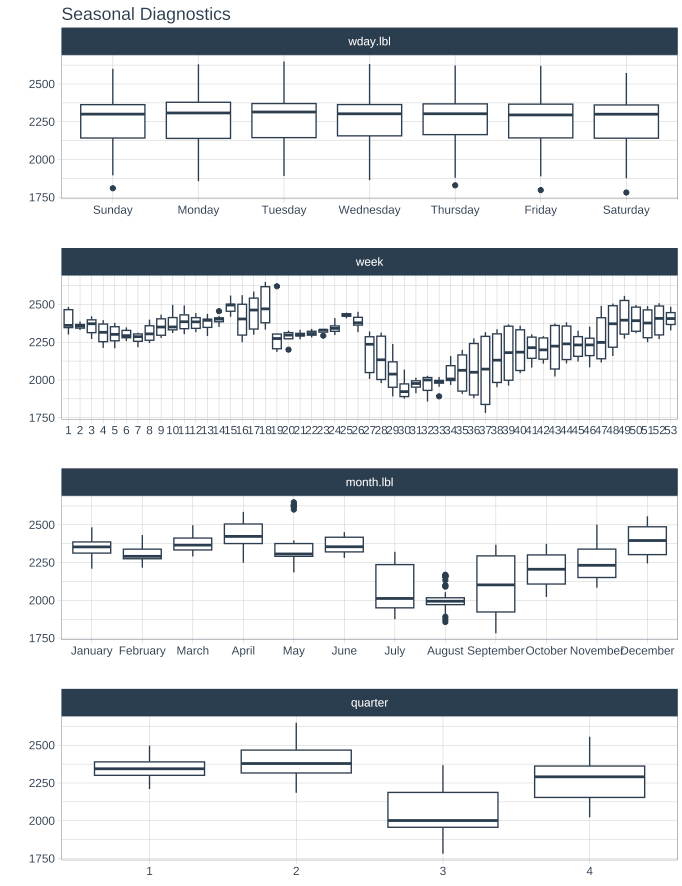
Calendar effects refer to variations in a time series that can be attributed to the calendar itself. This can include effects due to day of the week, month of the year, or holidays tied to the calendar.
R Code to make this plot:

Get the Code (In the R-Tip 075 Folder)
Conclusions:
You’ve learned the 5 concepts that helped me the most in my career. And the best part is that you can do all of this in 5 lines of R code.
Here’s another little secret, I teach these concepts plus others in just Module 1 of 18 in my High-Performance Time Series Course.
However, there is A LOT more to becoming an expert in time series for your company.
If you want to become a Time Series Expert for your company, then please read on…
Become the forecasting expert for your organization
High-Performance Time Series
Course
Time Series is Changing
Time series is changing. Businesses now need 10,000+ time series
forecasts every day. This is what I call a High-Performance Time
Series Forecasting System (HPTSF) - Accurate, Robust, and Scalable
Forecasting.
High-Performance Forecasting Systems will save companies by improving
accuracy and scalability. Imagine what will happen to your career if
you can provide your organization a “High-Performance Time Series
Forecasting System” (HPTSF System).
I teach how to build a HPTFS System in my High-Performance Time
Series Forecasting
Course.
You will learn:
- Time Series Machine Learning (cutting-edge) with
Modeltime - 30+
Models (Prophet, ARIMA, XGBoost, Random Forest, & many more)
- Deep Learning with
GluonTS (Competition Winners)
- Time Series Preprocessing, Noise Reduction, & Anomaly Detection
- Feature engineering using lagged variables & external regressors
- Hyperparameter Tuning
- Time series cross-validation
- Ensembling Multiple Machine Learning & Univariate Modeling
Techniques (Competition Winner)
- Scalable Forecasting - Forecast 1000+ time series in parallel
- and more.
Become the Time Series Expert for your organization.
Take
the High-Performance Time Series Forecasting Course