Introduction to A/B Testing in R (For Marketing Analytics)
Written by Matt Dancho
Hey guys, welcome back to my R-tips newsletter. In today’s R-Tip, I’m sharing how to do A/B Testing in R. Let’s go!
Table of Contents
Here’s what you’re learning today:
- What is A/B Testing (and how to pick the right Statistical Test)?: A/B Testing is a statistical method for comparing two groups to determine if there is a statistically significant difference between the two groups.
- Business Case: We’ll use a business case to demonstrate how to do A/B Testing in R by measuring the effect of Adspend on Hotel Bookings.
- R Code: We’ll walk step-by-step through how to perform A/B Testing in R.
Statistical Test Selection for A/B Testing!
SPECIAL ANNOUNCEMENT: AI for Data Scientists Workshop on December 18th
Inside the workshop I’ll share how I built a SQL-Writing Business Intelligence Agent with Generative AI:

What: GenAI for Data Scientists
When: Wednesday December 18th, 2pm EST
How It Will Help You: Whether you are new to data science or are an expert, Generative AI is changing the game. There’s a ton of hype. But how can Generative AI actually help you become a better data scientist and help you stand out in your career? I’ll show you inside my free Generative AI for Data Scientists workshop.
Price: Does Free sound good?
How To Join: 👉 Register Here
R-Tips Weekly
This article is part of R-Tips Weekly, a weekly video tutorial that shows you step-by-step how to do common R coding tasks. Pretty cool, right?
Here are the links to get set up. 👇
This Tutorial is Part of a 1-Hour Live Workshop on Causal Inference and A/B Testing
If you want to understanding A/B Testing, Geo Experimentation, Uplift Modeling, and Causal Inference at a deeper level, check out this free video. 👇
What is A/B Testing?
A/B Testing is a statistical method for comparing two groups to determine if there is a statistically significant difference between the two groups.
How is A/B Testing used in Marketing Analytics?
A/B Testing is used commonly in Marketing Analytics to determine if a marketing campaign is effective:
- For example, a company may want to know if a marketing campaign is effective at driving sales.
- To do this, they will run an A/B Test where they compare the sales of a group that was exposed to the marketing campaign (the treatment group) to the sales of a group that was not exposed to the marketing campaign (the control group).
- If there is a statistically significant difference between the two groups and a positive average treatment effect (ATE), then the company can conclude that the marketing campaign is effective at driving sales.
- And we can estimate the Lift (the increase in sales) that the marketing campaign drove.
How to pick the right Statistical Test?
There are many different types of statistical tests that can be used for A/B Testing. The type of statistical test that you use depends on the type of data that you have.
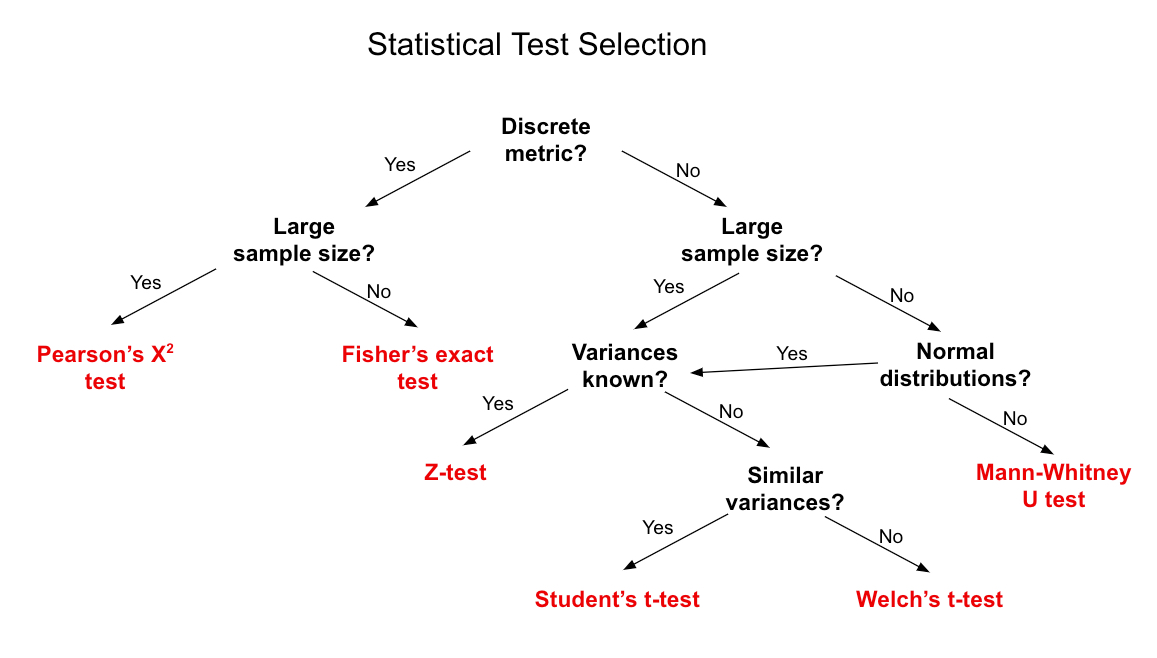
The following diagram shows the different types of statistical tests that can be used for A/B Testing and the selection process.
Statistical Test Selection for A/B Testing!
For our business case, we’ll rely on a very common test: The 2 sample T-Test, which is used to compare the means of two groups.
For other types of A/B Testing, you may need to use a different type of statistical test depending on the metric you are interested in (e.g. conversion metrics, counts of page views, etc). The table above can be used as a guide to help you select the right statistical test for your A/B Testing needs.
How to create an experiment?
To create an experiment, you need to have two groups of data: a treatment group and a control group.
- The treatment group is the group that is exposed to the marketing campaign.
- The control group is the group that is not exposed to the marketing campaign.
Now that we know what A/B Testing is and how it is used in Marketing Analytics, let’s look at an example of how to do A/B Testing in R.
Business Case: Hotel Bookings and Return on Adspend
In this example, you are part of the Data Science team working for an upscale hotel chain.

Your Mission:
Your team has been tasked with developing an online experiment to use Google Ads to drive hotel bookings (the action of reserving a room at the hotel). We will use A/B Testing to determine if a marketing campaign is effective at driving hotel bookings.
R Tutorial: A/B Testing in R
Super Important: We’ll start by trying to answer these business questions that are relevant to our Hotel Bookings business case:
- Does Adspend increase bookings?
- By how much? Was there a Return on Adspend (ROAS)?
These questions drive our experiment setup and analysis (more on this in a minute).
Get The Code: You can follow along with the R code in the R-Tips Newsletter. All code is avaliable in R-Tip 073.
Step 1: Load the Libraries and Data
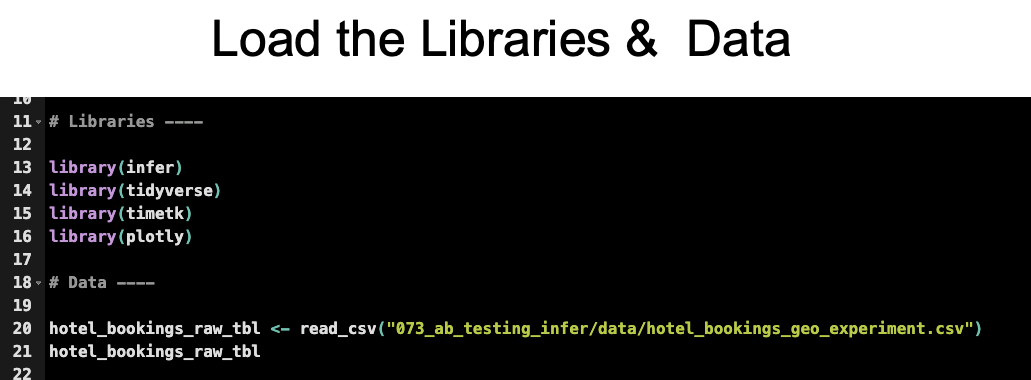
Get the Code (In the R-Tip 073 Folder)
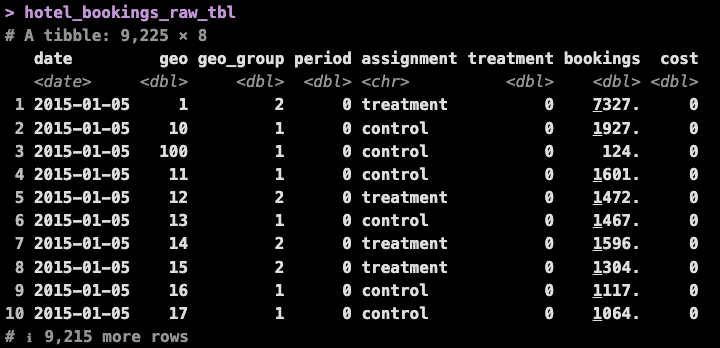
Experiment Setup (Data Description):
When you load the data, it looks like this:
Get the Data (In the R-Tip 073 Folder)
The data contains the following columns:
- period = 0: Pre/Post Experiment, 1: During Experiment
- assigment = “control” part of the control group, “treatment” part of the treatment group
- treatment = 0: No Adspend, 1: Adspend
- geo: Segmentation was performed by geography (this is common in marketing experiments to track pre and post experiment performance)
- bookings: Target feature that we want to measure the effect of Adspend on
- cost: Adspend (the amount of money spent on the marketing campaign during the experiment period = 1)
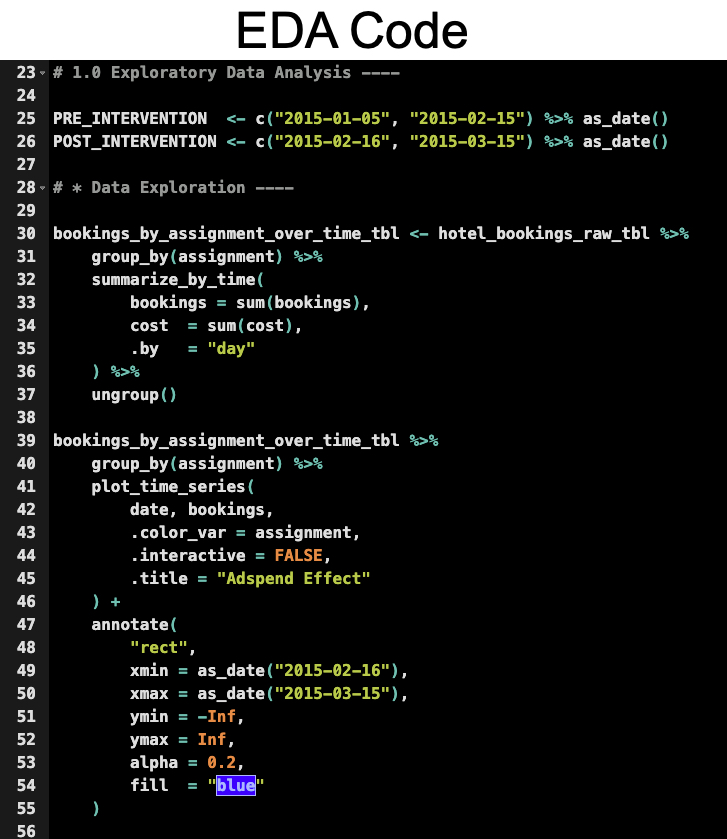
Step 2: Visualize the Data
Next, we will visualize the aggregate bookings by period for the control and treatment group to see if we can spot any visual effect of the adspend.
- The Pre-Intervention Period (Period = 0) is from 2015-01-05 to 2015-02-15
- The Post Intervention Period (Period = 1) is from 2015-02-16 to 2015-03-15 (This is when the experiment was run)
Data Visualization Code
Run this code to visualize the experiment:
Get the Code (In the R-Tip 073 Folder)
A/B Testing: Analyzing the Experiment Visually
The output is the following plot:
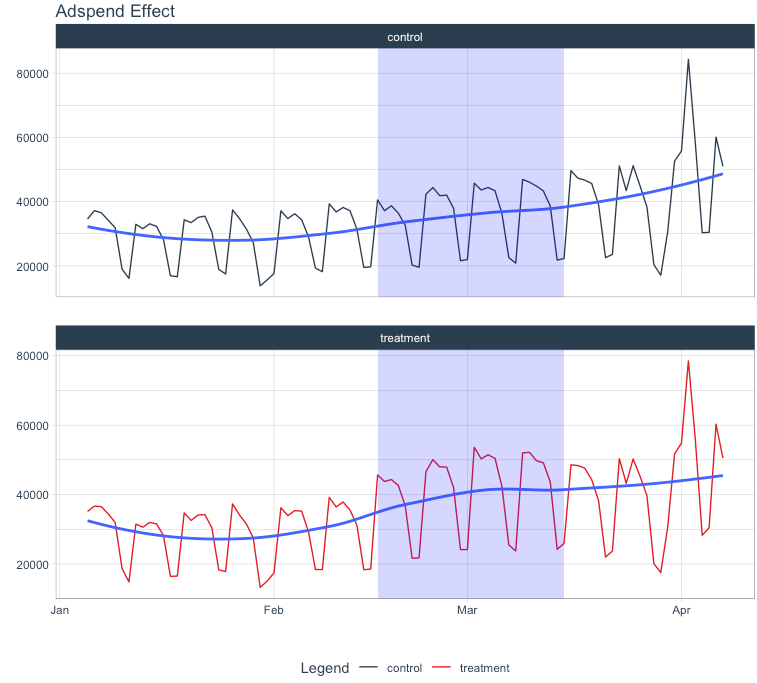
We can see that it looks like there’s a slight bump in bookings during the experiment period for the treatment group (the group that was exposed to the marketing campaign). But:
- It’s hard to tell if this is a statistically significant effect or just random noise.
- It’s hard to tell if there was a return on adspend.
To answer these questions, we’ll need to run a statistical test.
Step 3: Run the Statistical Test
Next, we’ll run the statistical test to determine if there is a statistically significant difference between the control and treatment group.
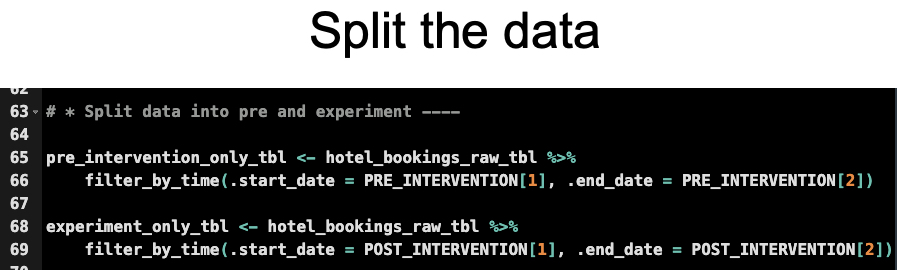
Split the data into pre and experiment periods
We’ll just need the experiment period (period = 1) for the statistical test. So, we’ll split the data into pre and experiment periods. Run this code:
Get the Code (In the R-Tip 073 Folder)
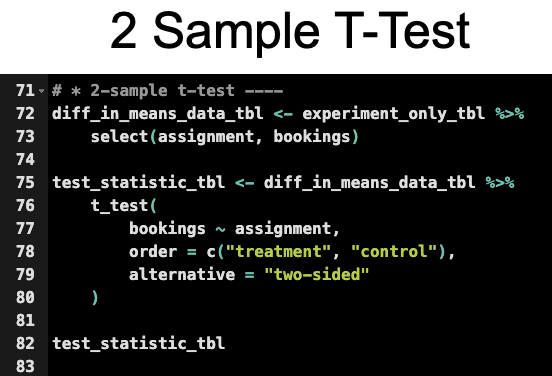
A/B Testing: Run the Statistical Test
Run this code to run the statistical test:
Get the Code (In the R-Tip 073 Folder)
A/B Testing: 2 Sample T-Test Results
The output is the following:
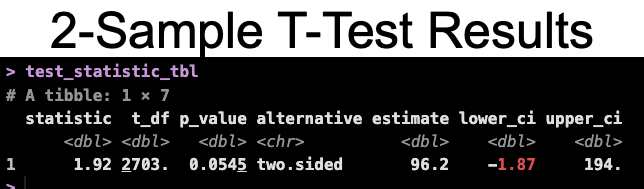
We can see that the:
-
estimated average treatment effect (ATE) is 96.2: This means that on average each of the geo-segments saw an increase of $96.20 per booking-day during the experiment period (the period when the marketing campaign was run). This is good news.
-
p-value is 0.0545: Generally there is a 0.05 used as the cutoff. But this is a business decision. In this case, we see that the lower CI (confidence interval) around the ATE is -$1.87 and the upper CI is $194.00. So that gives me confidence that the ATE is likely positive.
What could we be missing?
Sometimes there are other factors that can affect the results of an experiment. In this case, we may be missing the effect of seasonality.
For a more advanced tutorial on Uplift Modeling, See Part 2 of this video where I discuss how to use Meta (Facebook) GeoLift package on this problem.
Return on Adspend (ROAS)
We have answered the first question- Is there an effect? Yes, there is a statistically significant effect. At a 0.10 level, we can say that there is a statistically significant effect. The Average Treatement Effect is $96.20.
But, we still need to answer the second question: Was there a return on adspend (ROAS)?
To answer this question, we need to calculate the ROAS.
A/B Testing: Calculate the ROAS
Run this code to calculate the ROAS:
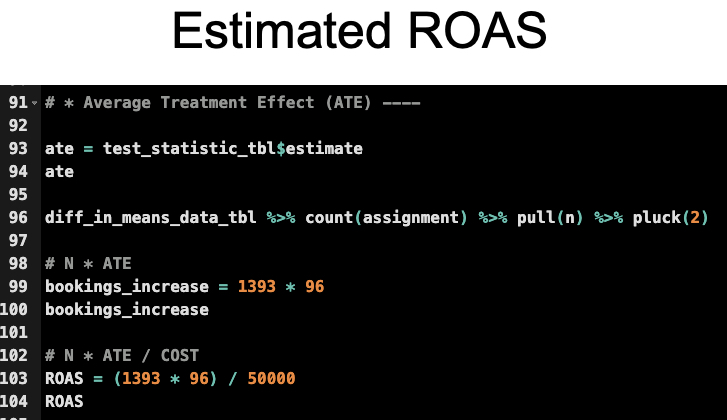
Get the Code (In the R-Tip 073 Folder)
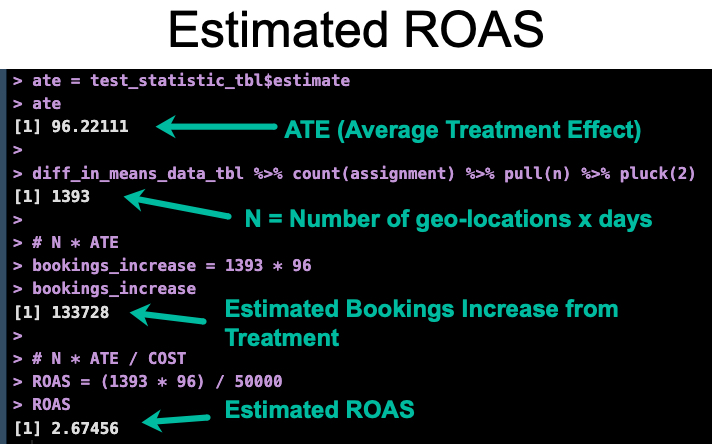
A/B Testing: ROAS Results
The output is the following:
Get the Code (In the R-Tip 073 Folder)
We can see that the Estimated ROAS is 2.67. This means that for every dollar spent on the marketing campaign, we get $2.67 back in bookings.
Conclusions:
We have answered the two questions that we set out to answer:
- Does Adspend increase bookings? Yes, there is a statistically significant effect. At a 0.10 level, we can say that there is a statistically significant effect. The Average Treatement Effect is $96.20.
- By how much? Was there a Return on Adspend (ROAS)? Yes, there was a return on adspend. The Estimated ROAS is 2.67. This means that for every dollar spent on the marketing campaign, we get $2.67 back in bookings.
However, there is A LOT more to becoming a Data Scientist for Business than just A/B Testing.
If you are struggling to become a Data Scientist for Business, then please read on…
Need to advance your business data science skills?
I’ve helped 6,107+ students learn data science for business from an elite business consultant’s perspective.
I’ve worked with Fortune 500 companies like S&P Global, Apple, MRM McCann, and more.
And I built a training program that gets my students life-changing data science careers (don’t believe me? see my testimonials here):
6-Figure Data Science Job at CVS Health ($125K)
Senior VP Of Analytics At JP Morgan ($200K)
50%+ Raises & Promotions ($150K)
Lead Data Scientist at Northwestern Mutual ($175K)
2X-ed Salary (From $60K to $120K)
2 Competing ML Job Offers ($150K)
Promotion to Lead Data Scientist ($175K)
Data Scientist Job at Verizon ($125K+)
Data Scientist Job at CitiBank ($100K + Bonus)
Whenever you are ready, here’s the system they are taking:
Here’s the system that has gotten aspiring data scientists, career transitioners, and life long learners data science jobs and promotions…

Join My 5-Course R-Track Program Now!
(And Become The Data Scientist You Were Meant To Be...)
P.S. - Samantha landed her NEW Data Science R Developer job at CVS Health (Fortune 500). This could be you.
