modelDown: Automate Explainable AI (Machine Learning) in R
Written by Matt Dancho
Machine learning is great… until you have to explain it. Stakeholders are normally non-technical, C-suites that ultimately want to know what the model does for the business. And how it helps increase revenue or decrease costs. A new R package, modelDown can help. And, I want to teach you how to extract that precious business value that companies crave.
In this R-tip, I’m going to show you how to unlock massive business value with modelDown in under 5-minutes:
- Learn how to make machine learning models with
tidymodels
- Unlock the cheat-code to making ANY machine learning model explainable
- BONUS: Learn how to read the Automated Explainable AI Report that you create (so you can explain the ML model to ANYONE!)
SPECIAL ANNOUNCEMENT: AI for Data Scientists Workshop on December 18th
Inside the workshop I’ll share how I built a SQL-Writing Business Intelligence Agent with Generative AI:

What: GenAI for Data Scientists
When: Wednesday December 18th, 2pm EST
How It Will Help You: Whether you are new to data science or are an expert, Generative AI is changing the game. There’s a ton of hype. But how can Generative AI actually help you become a better data scientist and help you stand out in your career? I’ll show you inside my free Generative AI for Data Scientists workshop.
Price: Does Free sound good?
How To Join: 👉 Register Here
R-Tips Weekly
This article is part of R-Tips Weekly, a weekly video tutorial that shows you step-by-step how to do common R coding tasks.
Here are the links to get set up. 👇
Video Tutorial
I have a companion video tutorial that shows even more secrets (plus mistakes to avoid).
What you make in this R-Tip
By the end of this tutorial, you’ll make a full explainable AI report that helps you explain business insights to executives, managers, non-technical business people, and even your parents (“Hey Dad, this is why customers are churning!”). OK, maybe not your parents, but definitely C-suite executives.
Uncover business insights by automating explainable AI
Thank You Developers.
Before we move on, please recognize that modelDown was developed by Przemyslaw Biecek, Magda Tatarynowicz, Kamil Romaszko, and Mateusz Urbanski. Thank you for everything you do!
Also, the full documentation for modelDown can be accessed here.
modelDown Tutorial
Let’s dive into using modelDown so we can automate explainable AI.
Important: All of the data and code shown can be accessed through our Business Science R-Tips Project.
Warning: This is an advanced tutorial that will depend on knowledge of tidymodels. And, it may be uncomfortable if you are a complete beginner. BUT, I’ll explain how you can learn R, tidymodels, and data science for business from scratch at the end of this tutorial.
Plus I have a surprise at the end (for everyone)!
💡 Step 1: Load the Libraries and Data
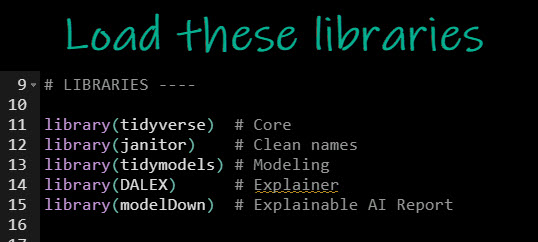
First, run this code to load the R libraries:
Load tidyverse , janitor, tidymodels, DALEX and modelDown. I’ll explain the importance of each of these R packages as we use them.
Get the code.
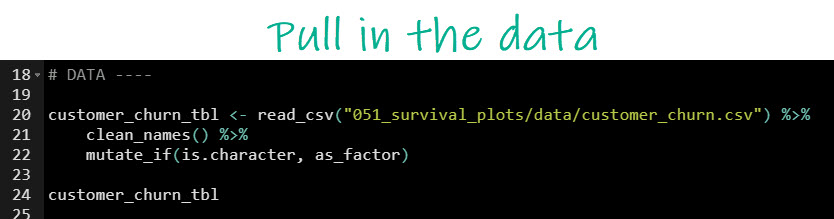
Next, run this code to pull in the data.
We’ll read in the Customer Churn data set that was used in the previous R-Tip on Survival Analysis.
Get the Data.
Our data looks like this.
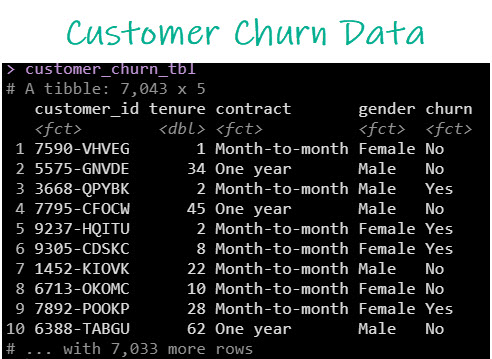
The customer churn dataset
We want to understand how customer churn data (Yes/No) depends on other factors like how long they have been a customer and what type of subscription plan they have (monthly, one-year, two-year).
💡 Step 2: Make a tidymodel
Next, it’s time to make a tidymodel. This can be a bit challenging for beginners (and even experienced R users, so at the end of this tutorial I’ll give you some more help).
If you are less experienced, I recommend to just go with it (but then check out the guidance at the end of the training). I’ll explain a lot about tidymodels through the process too.
Recipes: Feature Engineering and Preprocessing
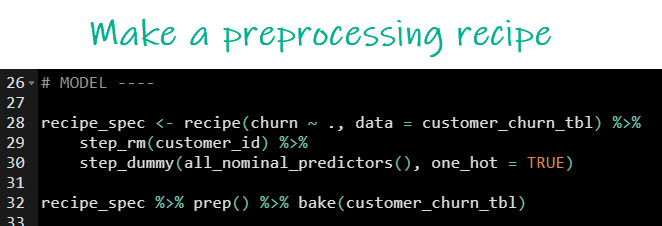
We’ll start by getting our data into a format that the models can handle. Run this code to remove unnecessary columns “customer_id” and to one-hot encode any categorical predictors (e.g. “contract” and “gender”).
Get the code.
The preprocessing recipe is just a template (often called a pipeline) that takes incoming data and processes it into the “right” format for our models to learn from it.
Here’s the preprocessing effect.
Before preprocessing we have predictors like “contract” containing factors (categories) and unnecessary columns like “customer_id” that won’t help us predict.
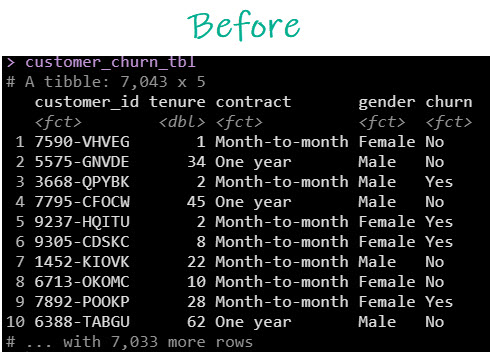
Before Preprocessing
And after preprocessing, our data changes into a format where predictors have been one-hot encoded and unnecessary columns have been removed. This format is much better for machine learning algorithms.
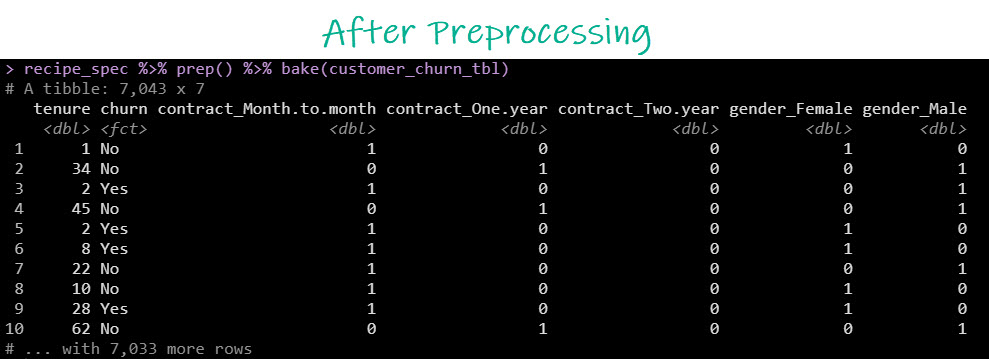
After Preprocessing
Machine Learning with Tidymodels
Next, let’s create a Random Forest model (Machine Learning). Random Forest models are usually accurate but suffer from being “Black Box”, a term that simply means not easy to explain.
Run this code.
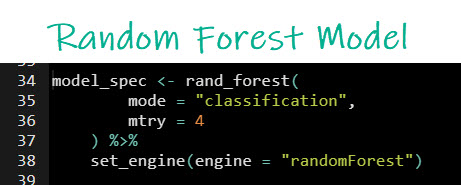
Get the code.
We now have a model specification. A common beginner mistake is thinking a model specification is a trained model. The model specification is NOT a trained model. Rather, it’s a template to create a model.
We’ll train the model next.
Train the Model
We have the two ingredients to train a model: A preprocessing recipe specification and a model specification. Next, we combine them and train them on the unprocessed dataset.
Key Concept: The Tidymodels Workflow. Combining the model, recipe, and training is called creating a “tidymodels workflow”. The tidymodels workflow is the object that can then be saved, loaded, and used to make predictions.
Important: I’m skipping some key steps like cross-validation for the sake of simplifying this tutorial. But, if you need to learn these key steps, then I will give you some free advice at the end of this tutorial.
Run this code to train the model.
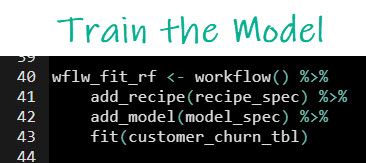
Get the code.
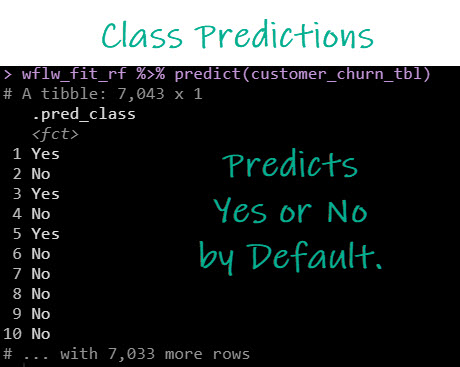
We can test the fitted model by making some predictions. Run this code.
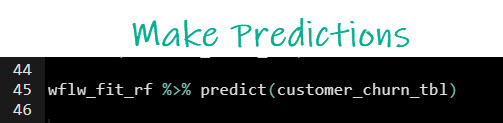
Here’s the result. A bunch of Yes/No’s. This is what we call “Class Predictions”. The algorithm is actually assigning “class” or category to the churn prediction.
Avoid THIS big mistake (the class probability trick)
Problem: the Explainable AI algorithm can’t use Class Predictions. It needs “Class Probabilities”, or actual numeric values from 0 to 1 that indicate the algorithms estimate of being a Yes.
THIS was a big mistake that cost me about an hour of headache when making this tutorial for you. So hopefully showing you the “Class Probability Trick” helps save you some time.
Run this code to get class probabilities.
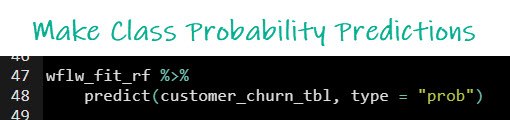
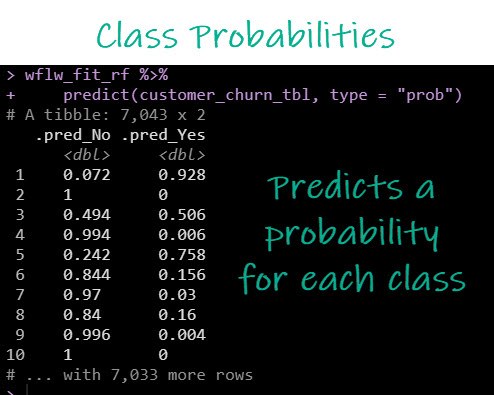
Solution: the Explainable AI algorithm can use the Class Probabilities. We now have values from 0-1 for Churn=Yes.
Here’s the result. Instead of Yes/Nos we get the algorithm’s probability of churn being a yes or a no.
OK, now that we have a way to get class probabilities, now we can make our “Black-Box” model explainable. Let’s see how.
💡 Step 3: Apply Explainable AI
With a model in hand that predicts, we are now ready to explain the model. There’s a trick you need to learn.
The cheat-code for explainable AI
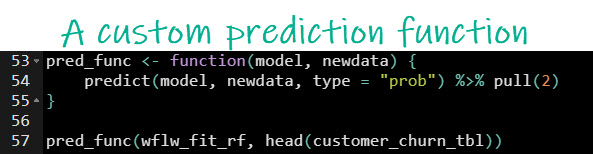
Here’s a quick hack to make your models explainable. We will use the DALEX package, but we need to make a custom prediction function, first.
A “custom prediction function” is just a simple function that takes a model and data and retrieves the class probability predictions in the format that the DALEX package needs.
Run this code to make a custom explainer function.
Get the code.
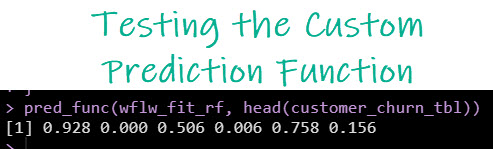
We can test our custom prediction function using our trained tidymodels workflow. By running on the head (first 6 rows of our dataset), I can truncate to the first 6 predictions. Looks like it’s working.
Explain ANY black-box model with DALEX
With the cheat code in hand (aka our custom prediction function), I can put all of the pieces together to make an explainer with an amazing R package called DALEX.
What is a DALEX explainer? Think of it like the precursor to understanding your Black-Box model. A “DALEX Explainer” is just an object that connects the model, data, prediction function, to a series of algorithms designed to interpret the model and develop explanations.
Run this code to make a DALEX Explainer.
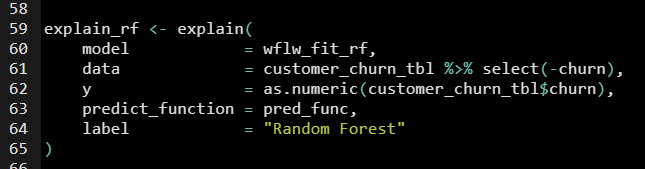
Get the code.
BIG Mistake: Don’t forget to check your explainer
Here’s how to check your explainer was set up correctly. Look at the DALEX explainer output.
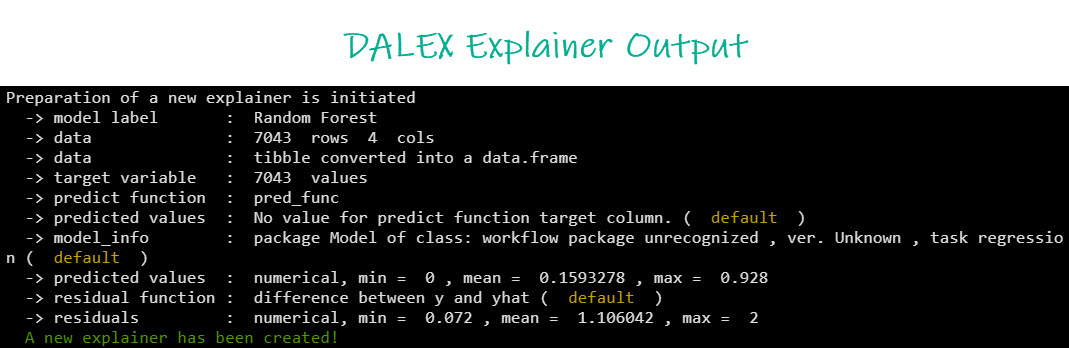
I can see from the output that the explainer has been “initialized” and that several calculations have completed including making predicted values and residuals.
Important: If the explainer is not set up correctly, you’ll get warnings in this stage. When creating this tutorial (before fixing my prediction function), I had a bunch of warnings indicating my residuals weren’t calculated. I just had to go back and change my custom prediction function to set up class probabilities (shown in Step 2 above).
Create the Automated modelDown Website
Once you create a DALEX explainer, the beauty is that the ecosystem of DrWhy Explainable AI packages can all use DALEX explainers. Here’s a snapshot of the DrWhy DALEXverse.
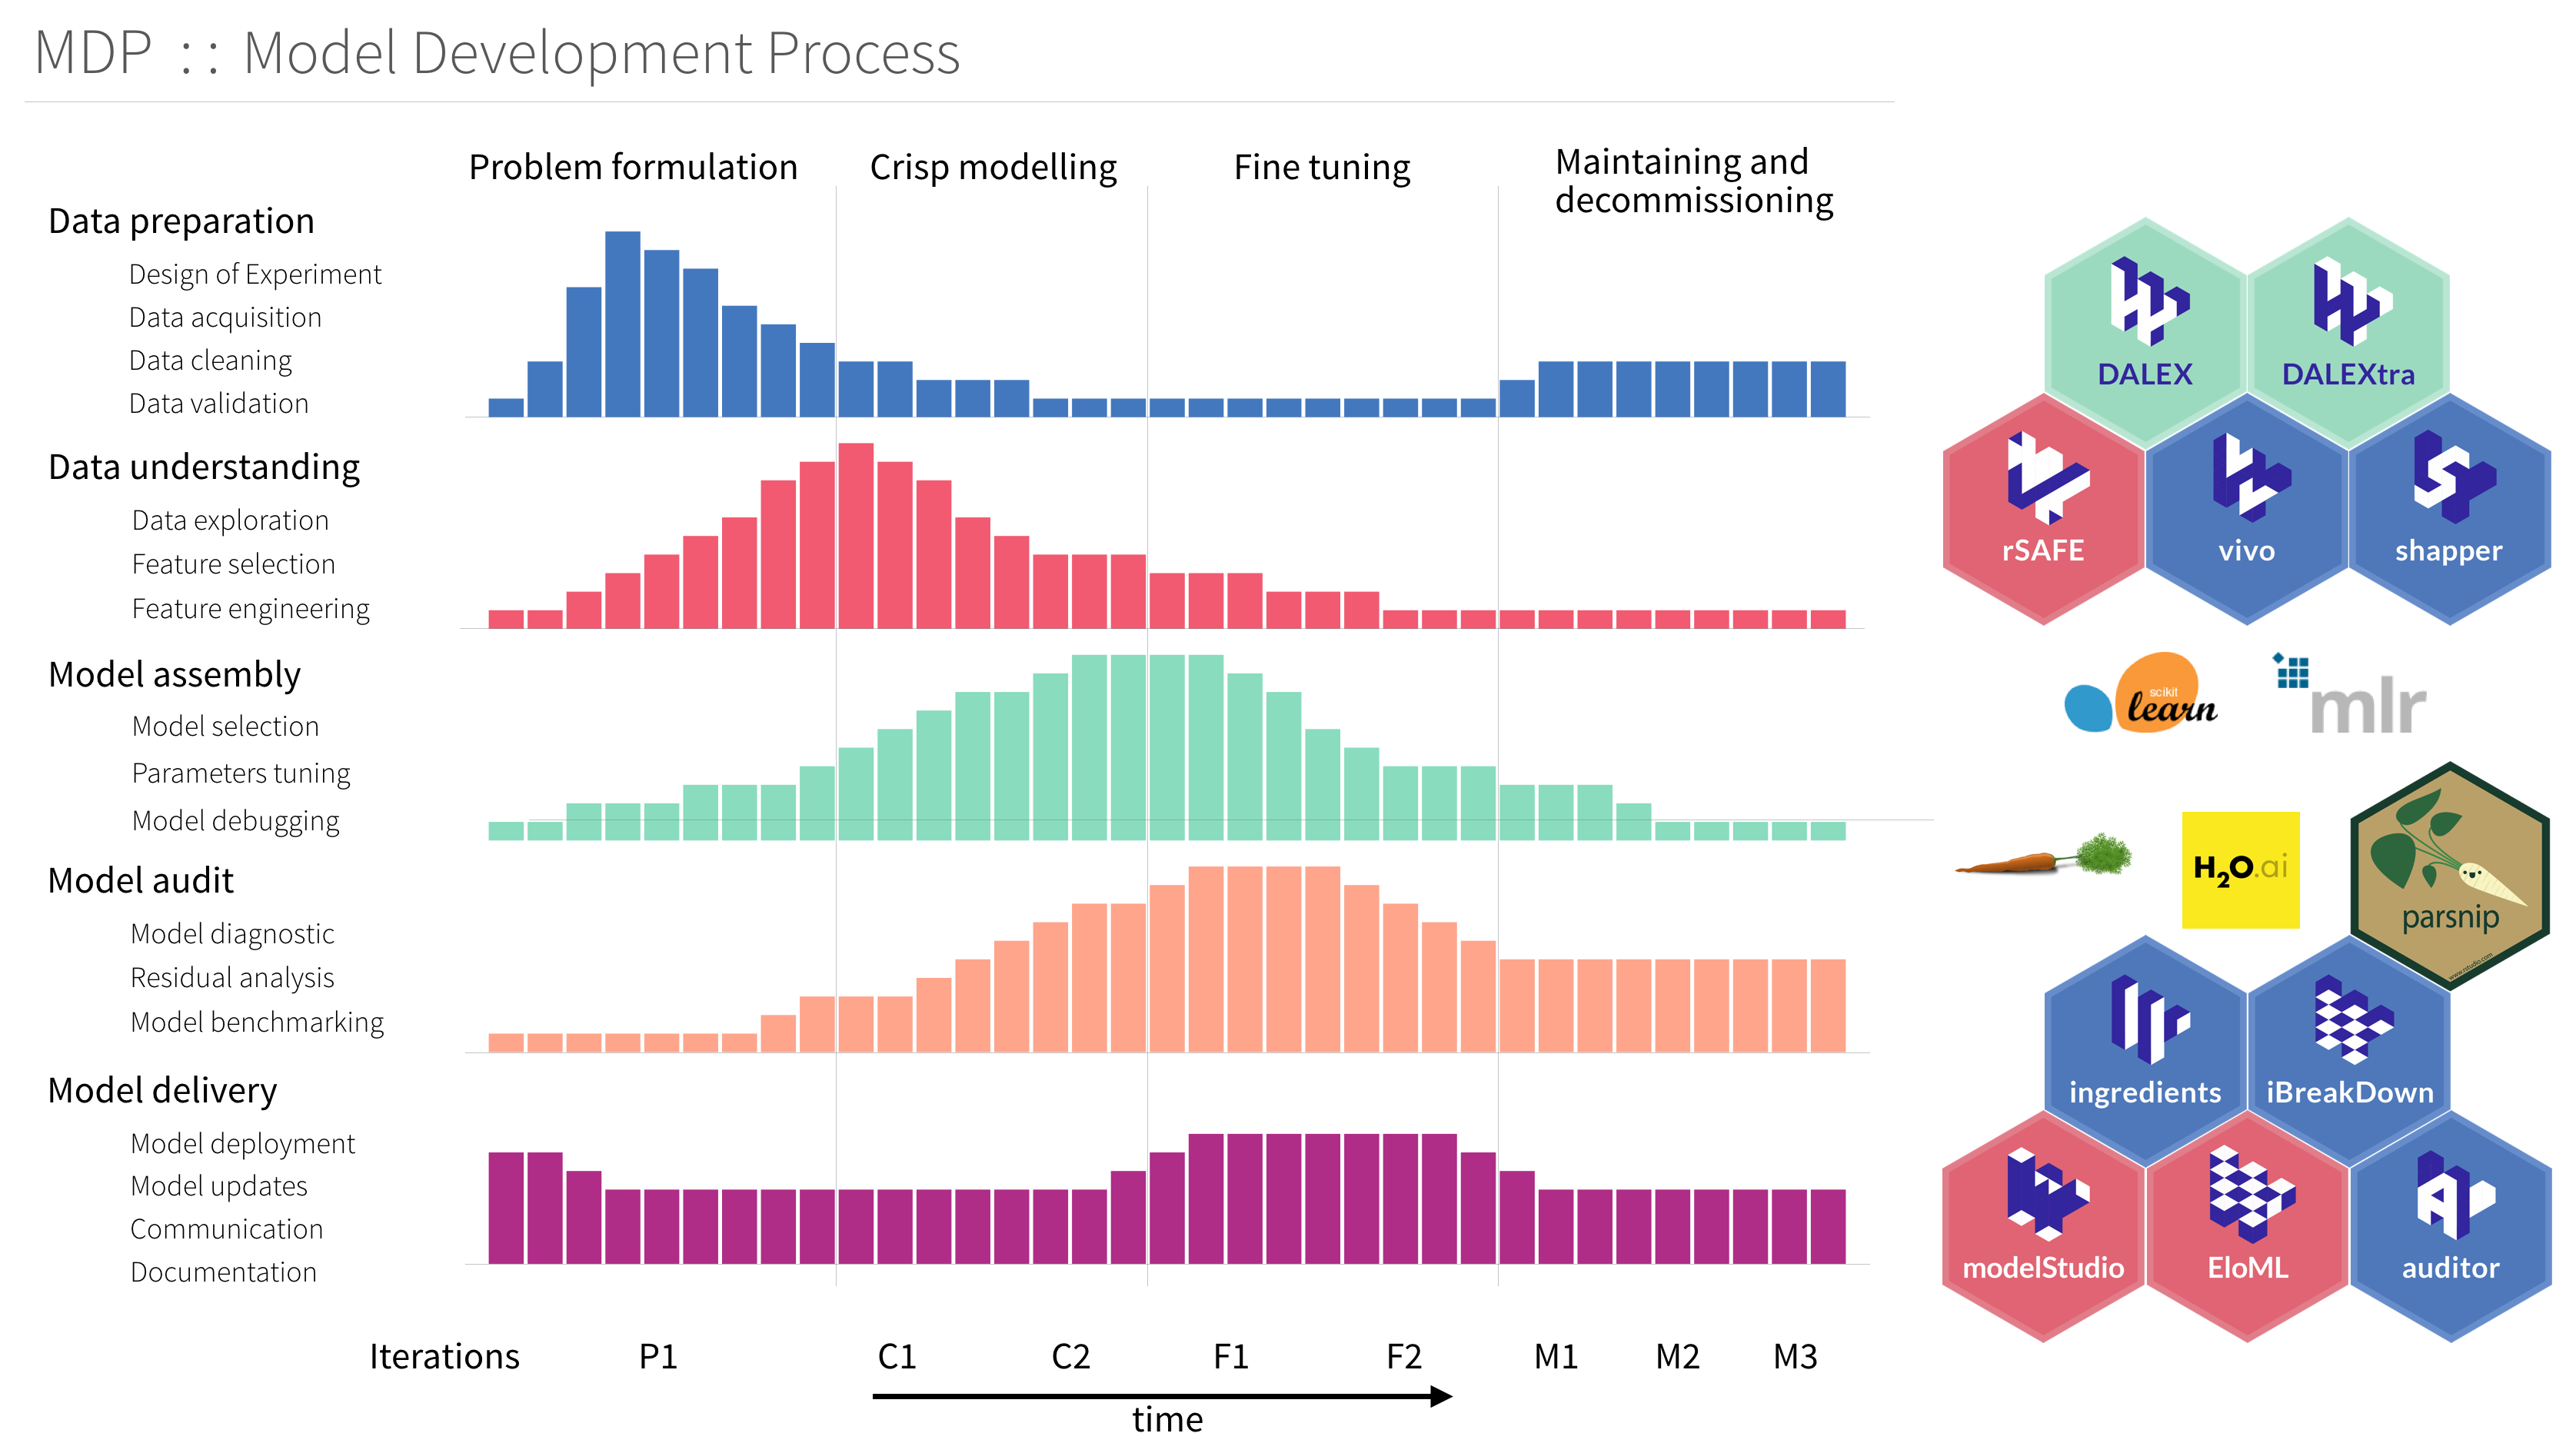
The DALEXverse
Run this code to create the automated modelDown website.
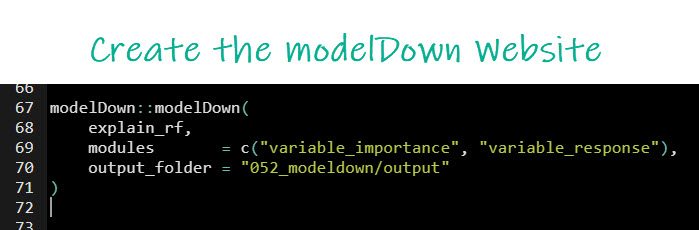
Get the code.
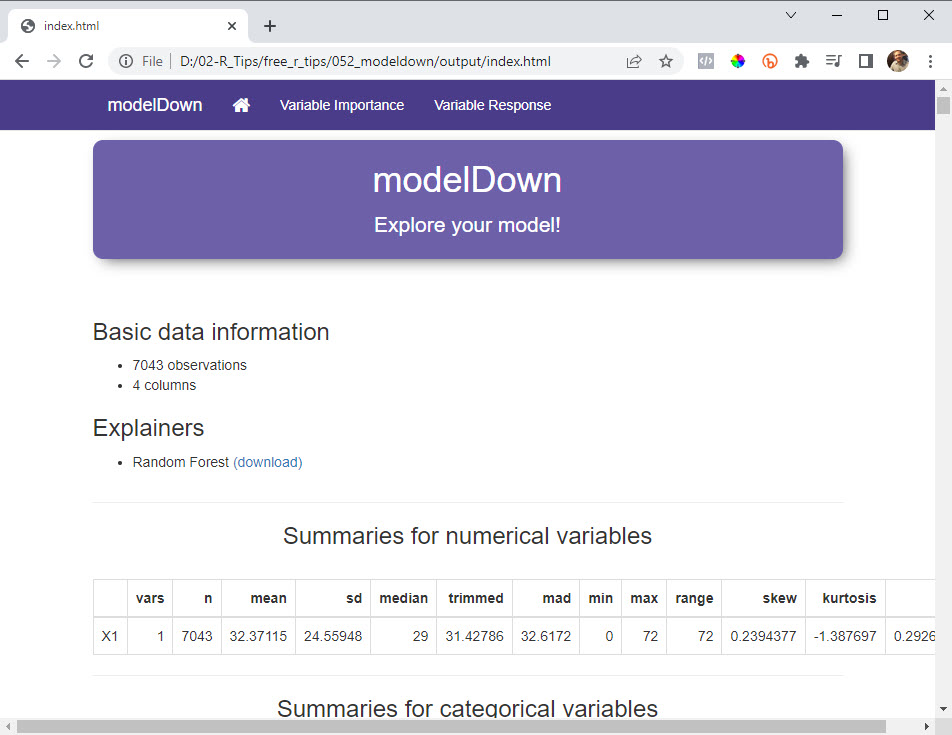
This creates a folder containing a deployable website with the automated explainable model report.
The modelDown Explainable AI Website
💡 BONUS: Understand the Explainable AI Visualizations!
Here’s the next problem you’re going to face. The Model Down website is great! BUT, you need to know how to interpret the findings (AND uncover business insights).
I want to help. Here’s how to interpret and find business insights.
Step 1: The Variable (Feature) Importance Plot
First, head to the “Variable Importance” Tab. You will find a plot called “Feature Importance”. This is how we know which features to invest time into.
Important: I ALWAYS use the Feature Importance Plot first. This tells me which features I need to focus my time and attention on.
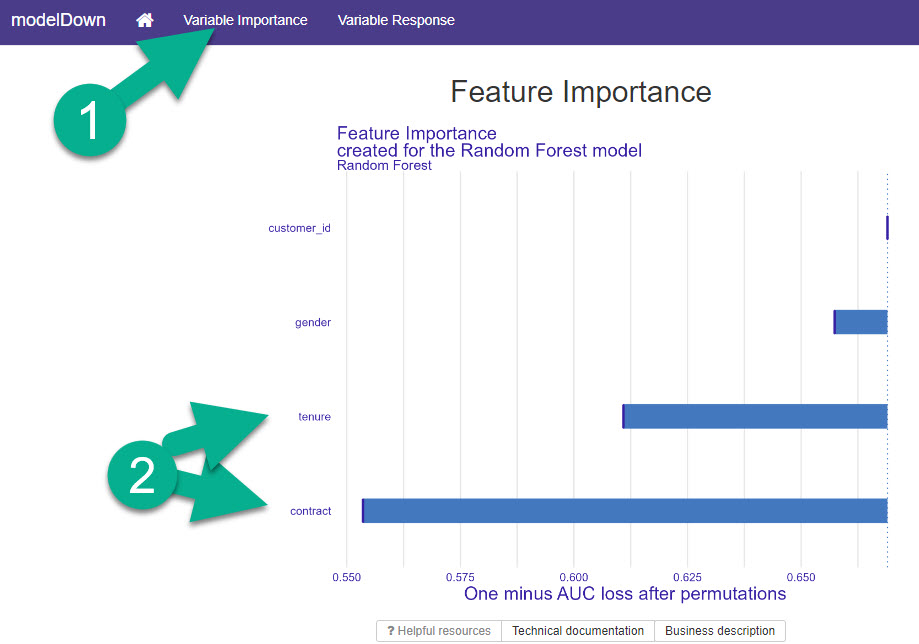
Variable (Feature Importance)
The feature importance plot is quite simply a visualization that identifies the top features in your modelDown report. I can see that “contract” and “tenure” are my top 2 features.
Step 2: The Variable Response Plots
Now that we know WHICH features are important, I head over to the “Variable Response” tab. This is where I gain my Business Insights.
Warning: If you skip Step 1, you’ll waste time investigating bad features. So make sure you do Step 1 first.
Business Insight #1: Contract Type
From Step 1, I saw that “contract” was the most important. On the Variable Response Tab, I select “contract”, which leads me to my first Business Insight.
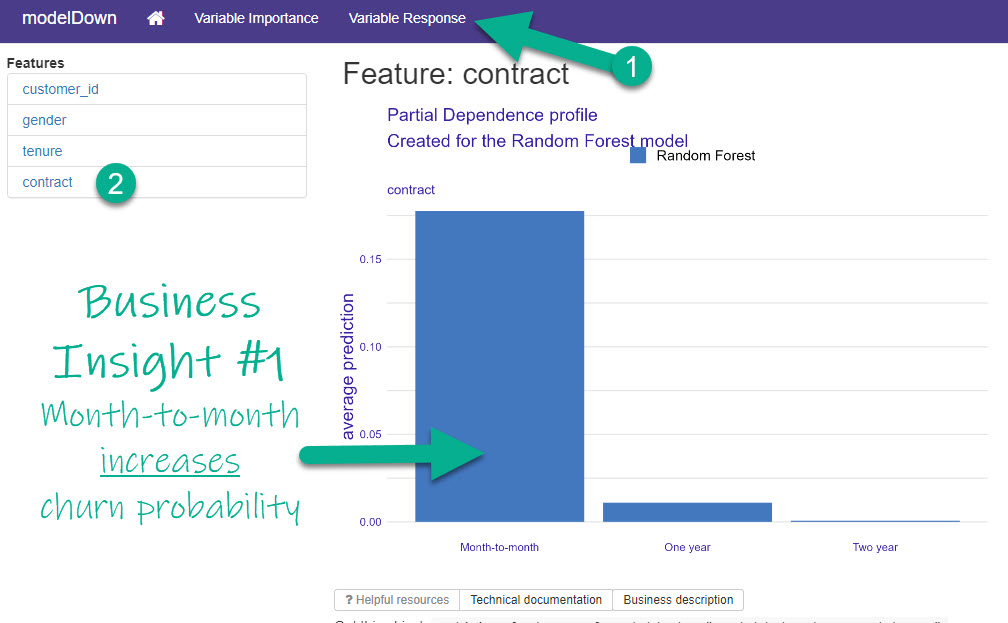
Inspecting the Top Feature (Most Important)
I can quickly see that Month-to-Month contracts have increased churn probability according to my Random Forest Model.
Business Insight #1: To reduce churn, we could try giving customers incentivized offers to upgrade to longer-term contracts like one-year or two-year.
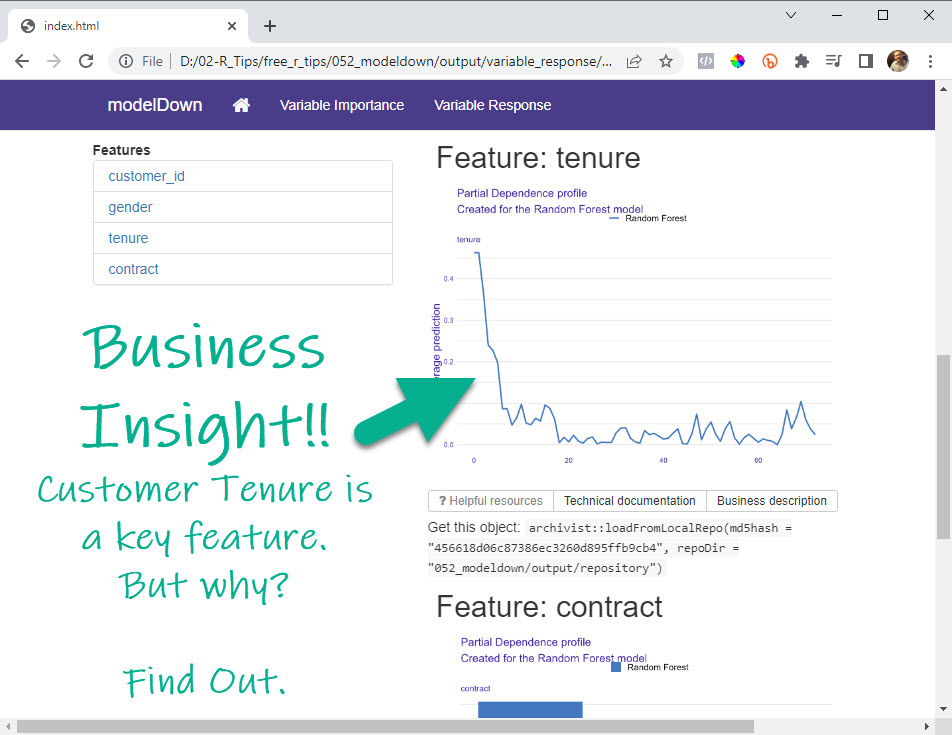
Business Insight #2: Tenure
In Step 1 above, I also saw that “tenure” was an important feature. On the Variable Response Tab, I select “tenure”, and this leads me to my second Business Insight.
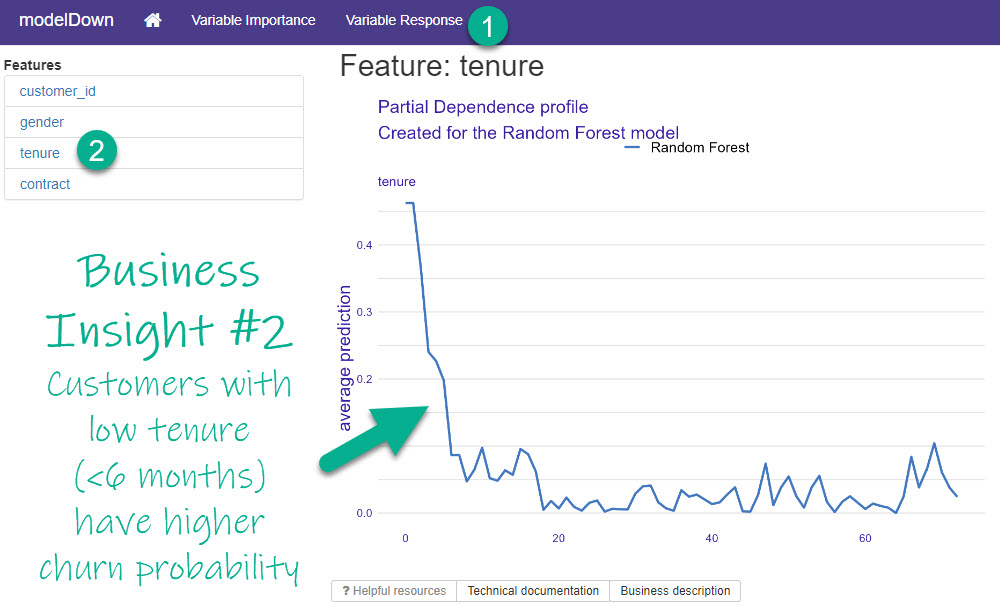
Inspecting the 2nd Most Important Feature
I can see that when tenure is low (less than 6-months), that customers have a much higher churn probability according to my Random Forest Model.
Business Insight #2: To reduce churn, we could try rewarding customer loyalty to stay beyond 6-months (Example promotion: “Try for 6-months and the 7th is on us!”).
💡 Conclusions
You learned how to use the modelDown library to not only automate an Explainable AI website report but you also learned how to use it to create 2 business insights. Great work! But, there’s a lot more to becoming a Business Scientist.
If you’d like to become a Business Scientist (and have an awesome career, improve your quality of life, enjoy your job, and all the fun that comes along), then I can help with that.
Need to advance your business data science skills?
I’ve helped 6,107+ students learn data science for business from an elite business consultant’s perspective.
I’ve worked with Fortune 500 companies like S&P Global, Apple, MRM McCann, and more.
And I built a training program that gets my students life-changing data science careers (don’t believe me? see my testimonials here):
6-Figure Data Science Job at CVS Health ($125K)
Senior VP Of Analytics At JP Morgan ($200K)
50%+ Raises & Promotions ($150K)
Lead Data Scientist at Northwestern Mutual ($175K)
2X-ed Salary (From $60K to $120K)
2 Competing ML Job Offers ($150K)
Promotion to Lead Data Scientist ($175K)
Data Scientist Job at Verizon ($125K+)
Data Scientist Job at CitiBank ($100K + Bonus)
Whenever you are ready, here’s the system they are taking:
Here’s the system that has gotten aspiring data scientists, career transitioners, and life long learners data science jobs and promotions…

Join My 5-Course R-Track Program Now!
(And Become The Data Scientist You Were Meant To Be...)
P.S. - Samantha landed her NEW Data Science R Developer job at CVS Health (Fortune 500). This could be you.
