A new R package for Business Analytics... radiant
Written by Matt Dancho
I’m super impressed by the radiant R package. With no prior experience with radiant, I was able to complete a short business analytics report in under 10-minutes.
SPECIAL ANNOUNCEMENT: AI for Data Scientists Workshop on December 18th
Inside the workshop I’ll share how I built a SQL-Writing Business Intelligence Agent with Generative AI:

What: GenAI for Data Scientists
When: Wednesday December 18th, 2pm EST
How It Will Help You: Whether you are new to data science or are an expert, Generative AI is changing the game. There’s a ton of hype. But how can Generative AI actually help you become a better data scientist and help you stand out in your career? I’ll show you inside my free Generative AI for Data Scientists workshop.
Price: Does Free sound good?
How To Join: 👉 Register Here
R-Tips Weekly
This article is part of R-Tips Weekly, a weekly video tutorial that shows you step-by-step how to do common R coding tasks.
Here are the links to get set up. 👇
Video Tutorial
See how in 10-minutes I made a quick business analytics report with radiant.
What you make in this R-Tip
By the end of this tutorial, you’ll use Radiant to create a reproducible Business Analytics Report and save it as HTML.
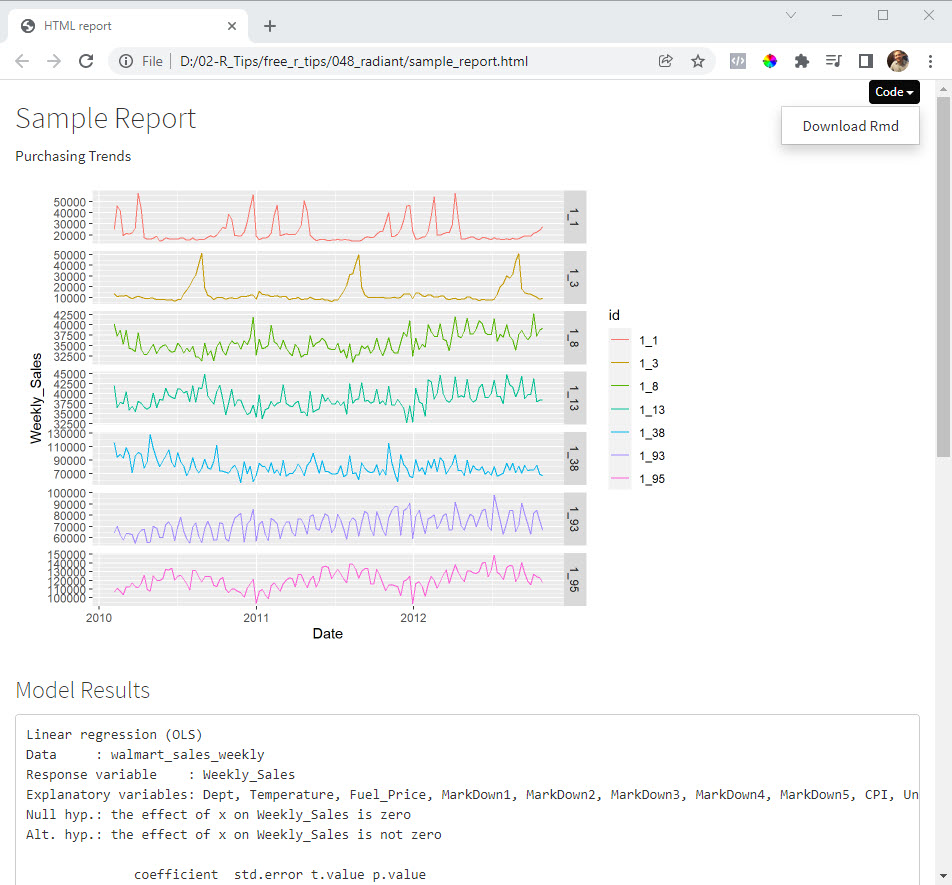
Reproducible Business Analytics Report (made with radiant)
Thank You Developers
Before we go any further, I want to say thanks to the open source developers of Radiant. The programmer that graciously developed radiant and has given it to us free of charge is Vincent Nijs.
Radiant Setup
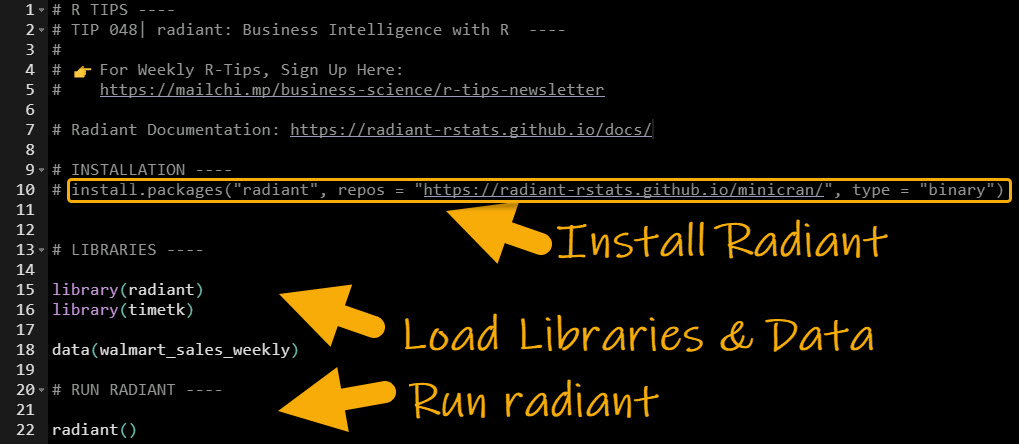
Follow these instructions to set up the radiant package and tutorial.
- Install Radiant
- Load the libraries and data
- Run
radiant() (there’s also an Add-In if you use Rstudio)
Radiant’s Shiny UI
This opens up the Radiant Shiny User Interface, a Shiny App that runs locally in a new Google Chrome Window.
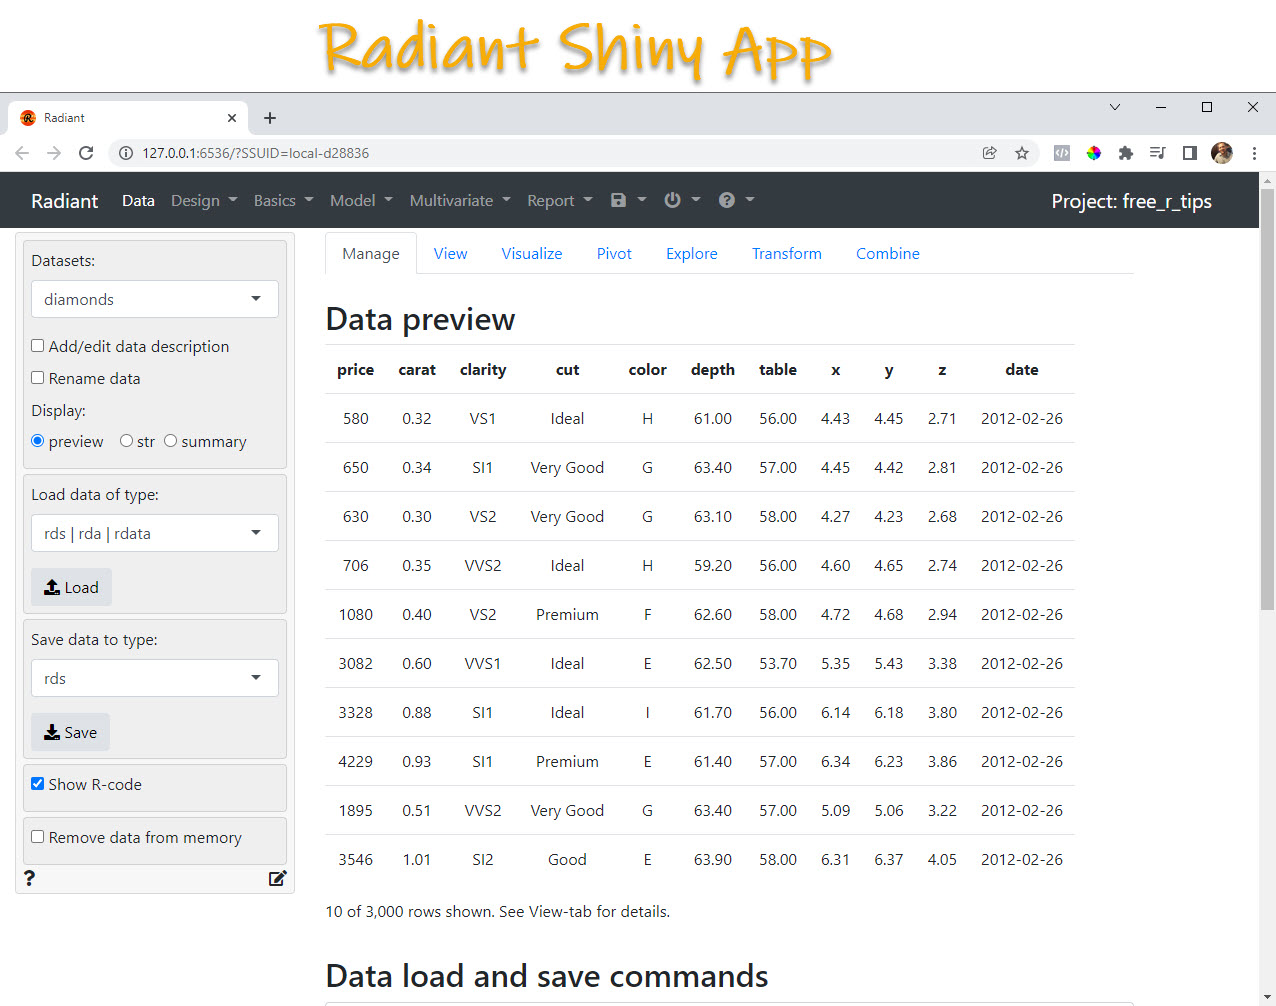
Step 1 - Working with Data
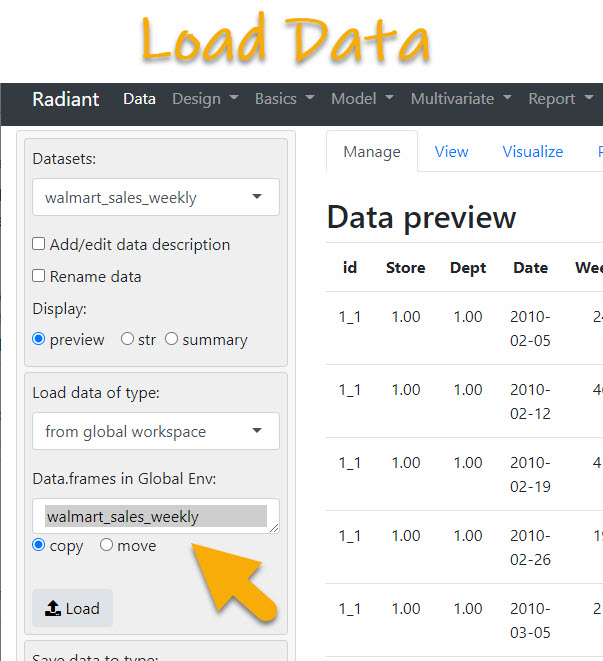
Next, lets load our data. I added data into the Rstudio Global Environment previously when I ran data(walmart_sales_weekly).
One of the options is to load data from the Global Environment, so let’s do this.
Step 2 - Visualize
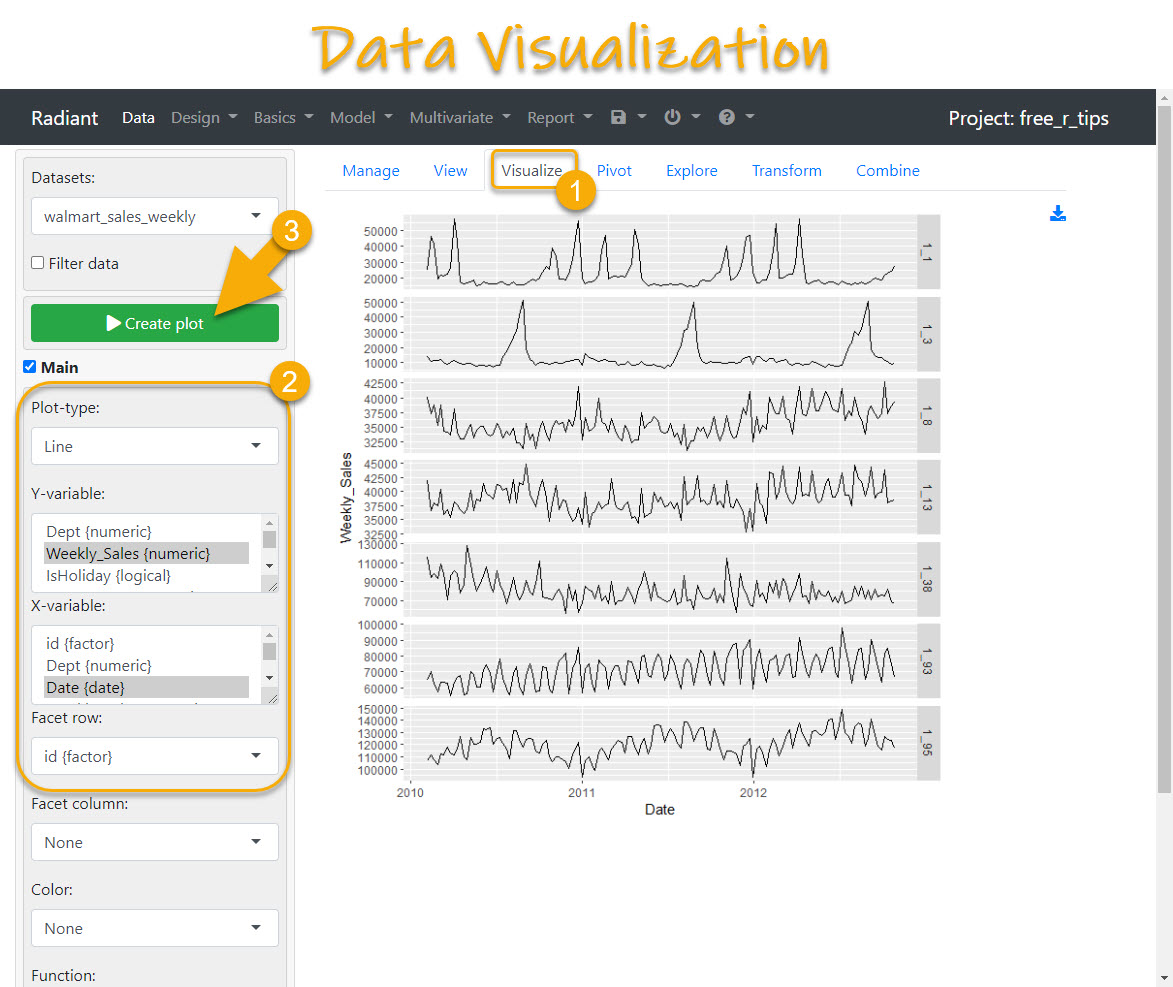
We can make a quick plot to investigate the sales data over time by Sales ID (store - department identifier). This highlights the differing sales trends by Store-Department.
- Head over the Visualize Section within the Data Tab
- Select Line Plot, and Y-Axis will be Weekly Sales, X-Axis is Date, and Facet Row is ID
- Click Create Plot to make the visualization
Step 3 - Starting the Report
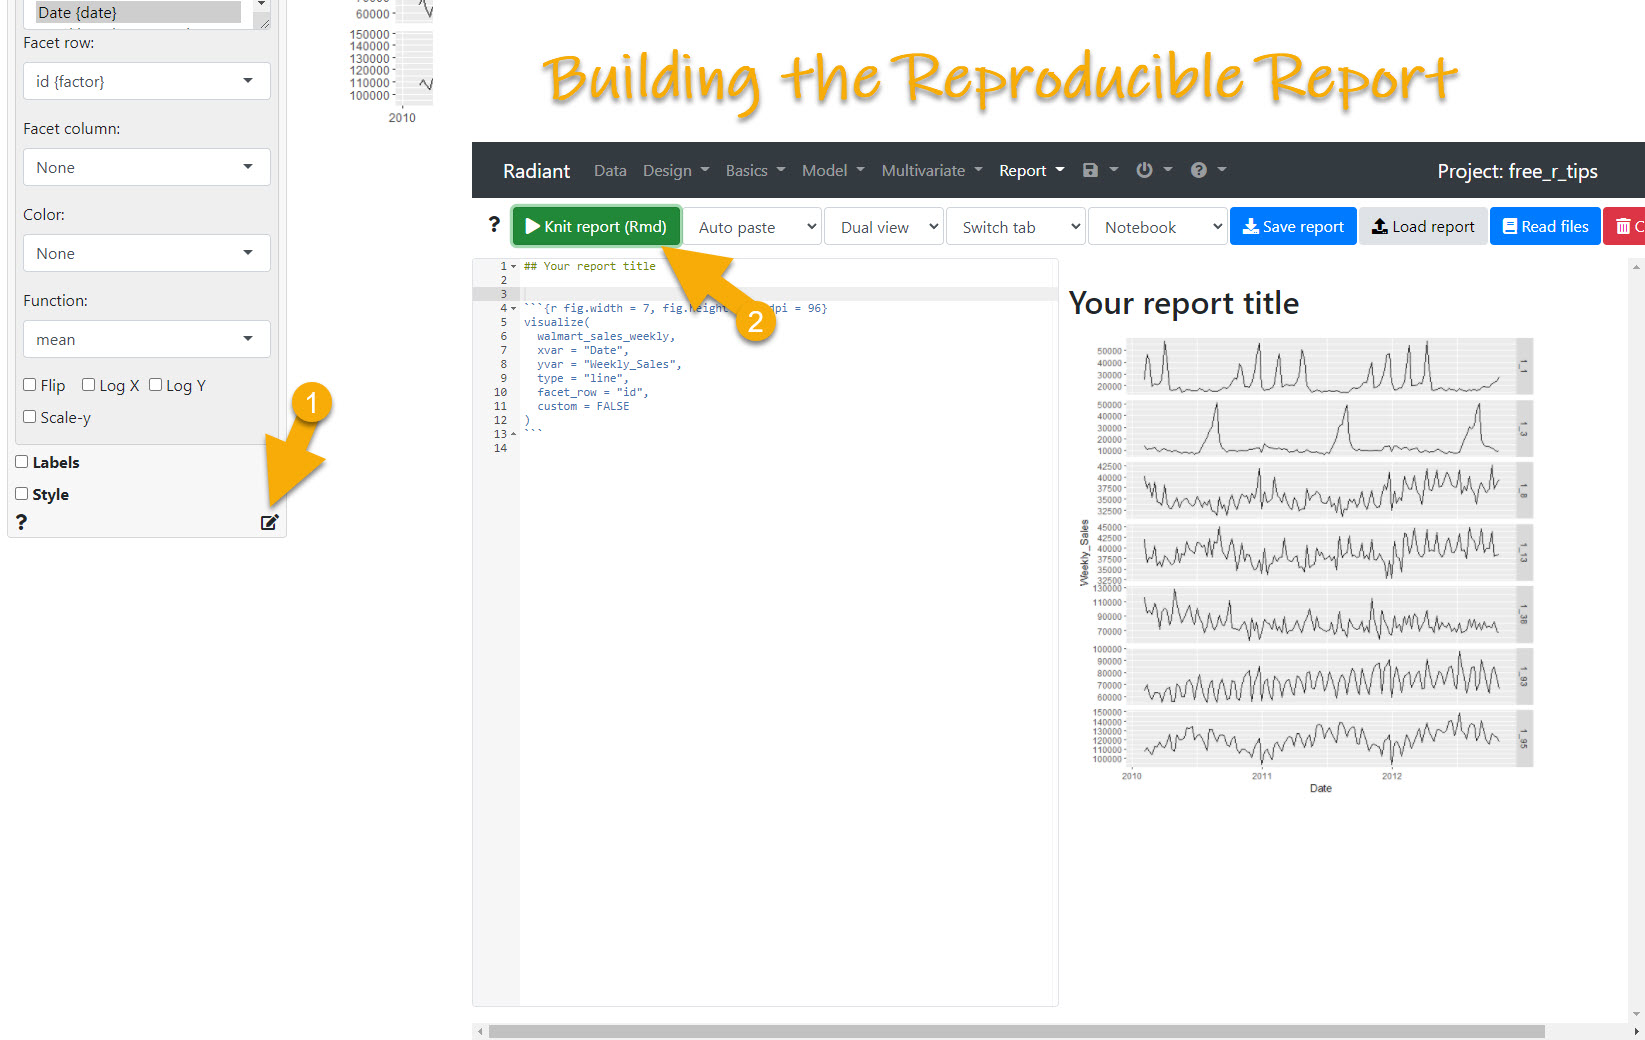
At this point we can begin building our report.
- On the Visualize Section, scroll down and click the little report icon
- This send you to the Report Tab where you can Knit report
Bada-Bing… Bada Boom! We have the beginnings of a Business Analytics Report.
Step 4 - Modeling (Creating a Price Model)
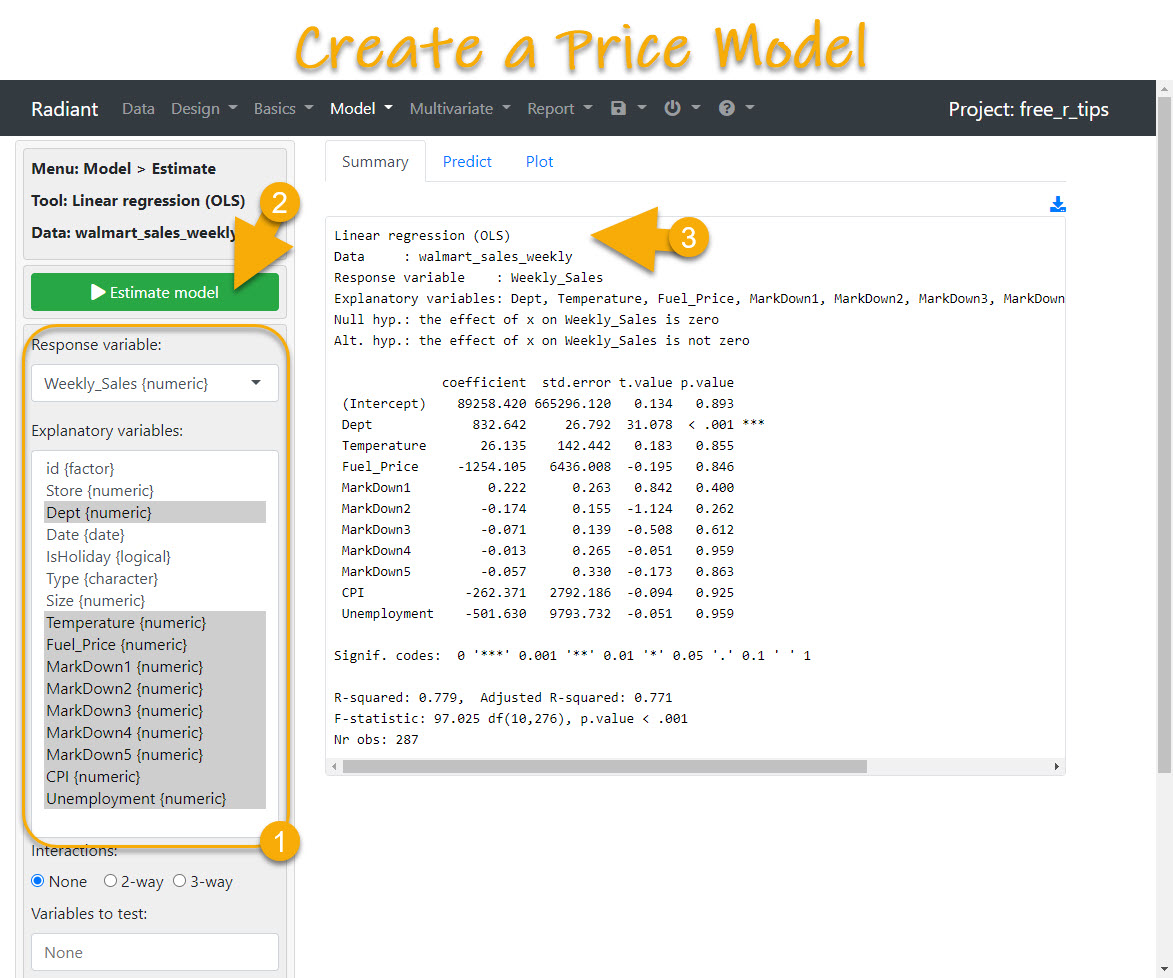
The next step in our workflow is to model the weekly sales data. My goal is to create a Pricing Model that looks for dependencies between the weekly sales volume by department and factors like markups, fuel price, temperature (weather), etc. We can easily do this in radiant.
Head over to the Model Tab and select Linear Regression (OLS).
- First select Weekly Sales as the response variable and select the explanatory variables shown.
- Then click Estimate Model to make a linear regression model
- Review the OLS Linear regression summary results. This is our very basic pricing model.
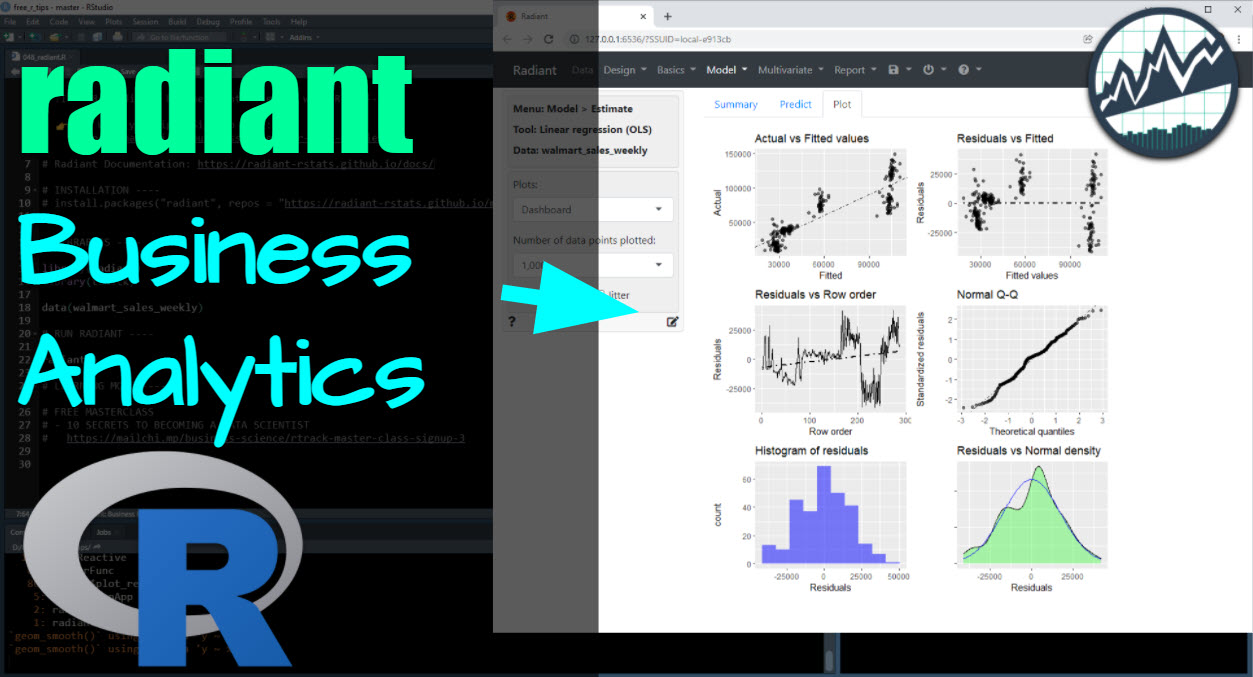
Bonus - Residual & Coefficient Plots
As a bonus for making it this far, I’m showing you how you can quickly make some awesome visuals for your Business Analytics Report.
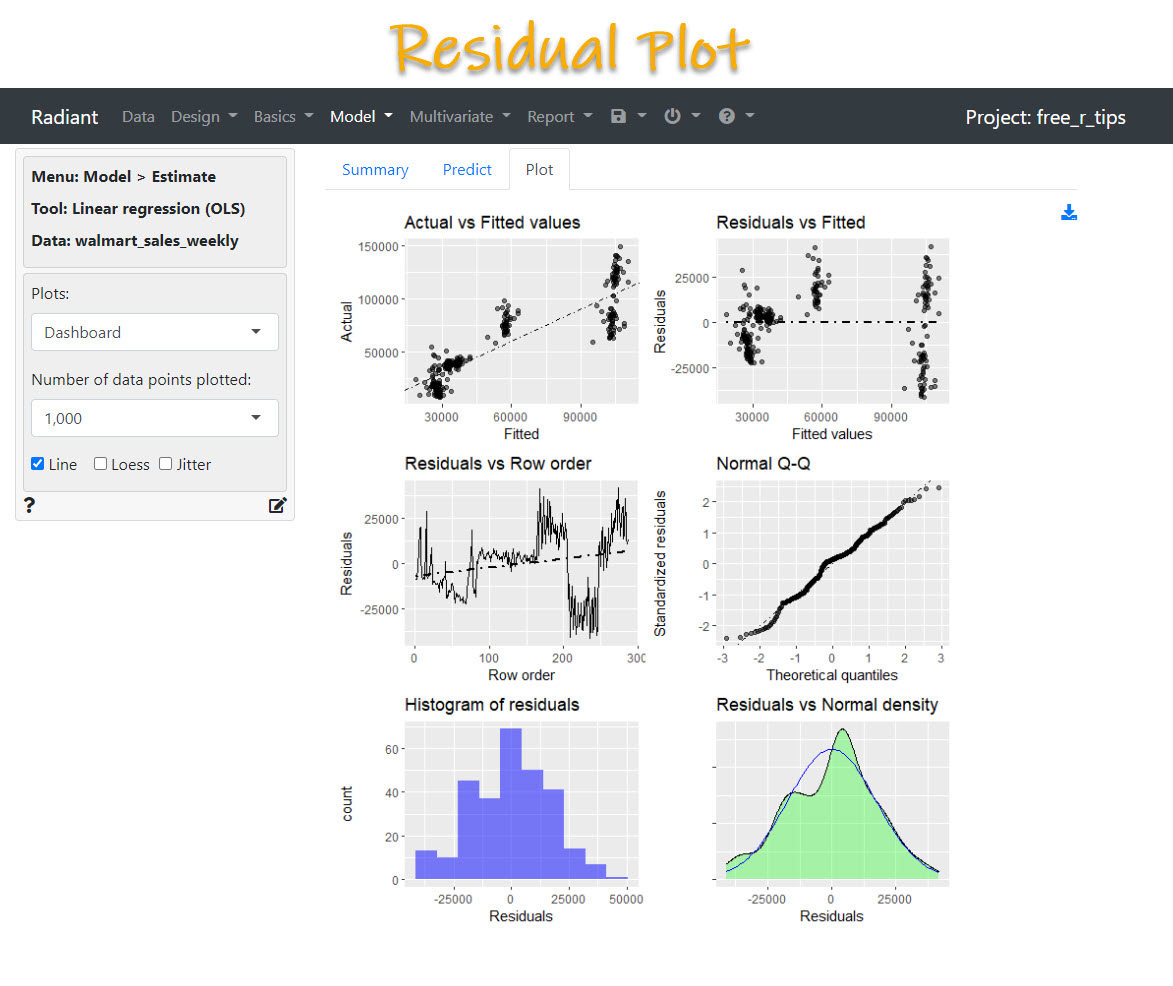
Residuals Plot
This plot helps us see how well the model is performing. It’s worth mentioning that we are seeing a lot of clusters, which means a non-linear model may be a better model.
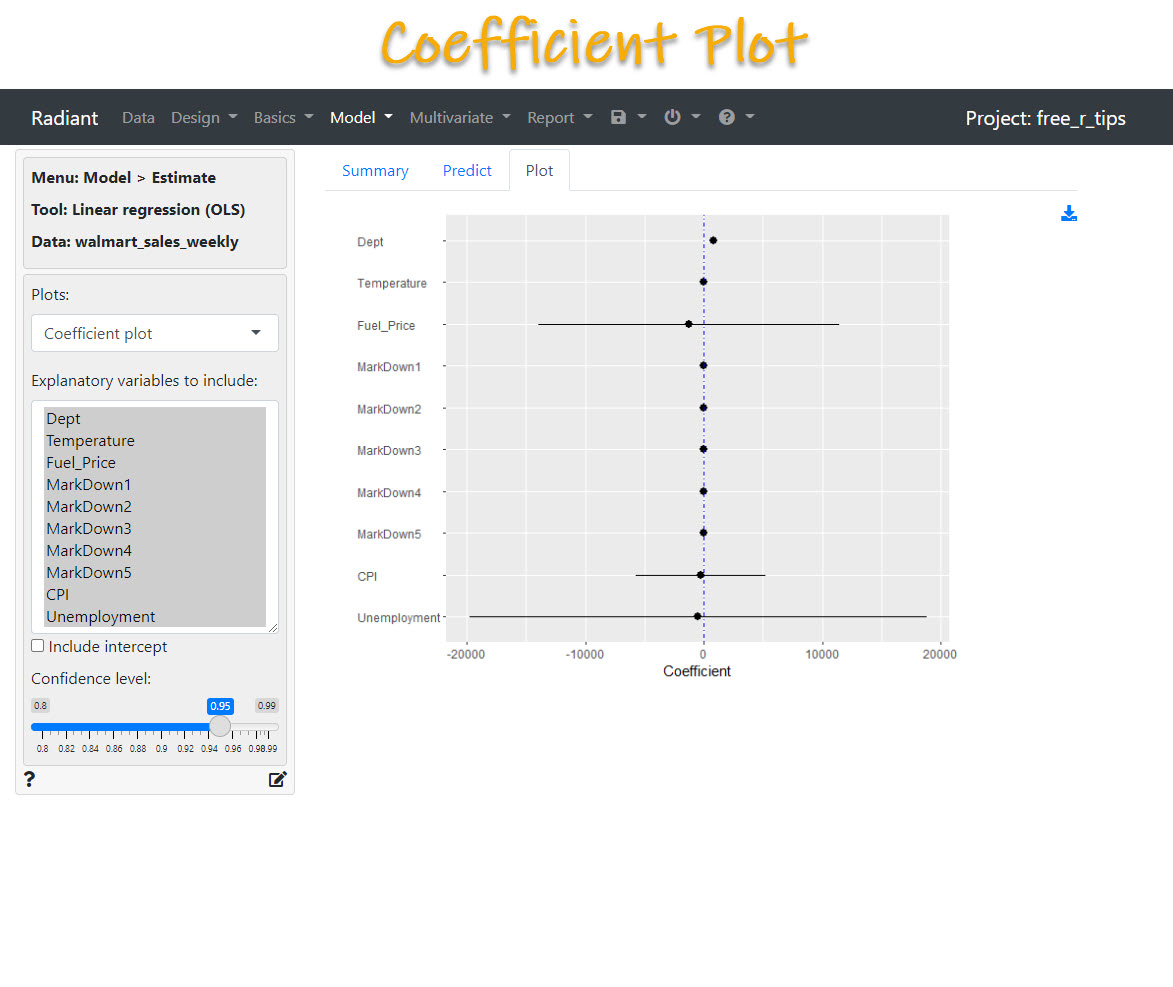
Coefficient Plot
This plot helps us see the effect of a 1-unit change to the modeled price. It appears that the model is very sensitive to Fuel Price. Keep in mind that the units are important for comparison.
- A change in $1 of fuel price is a lot.
- A change in 1-degree Fahrenheit for Temperature is not that much.
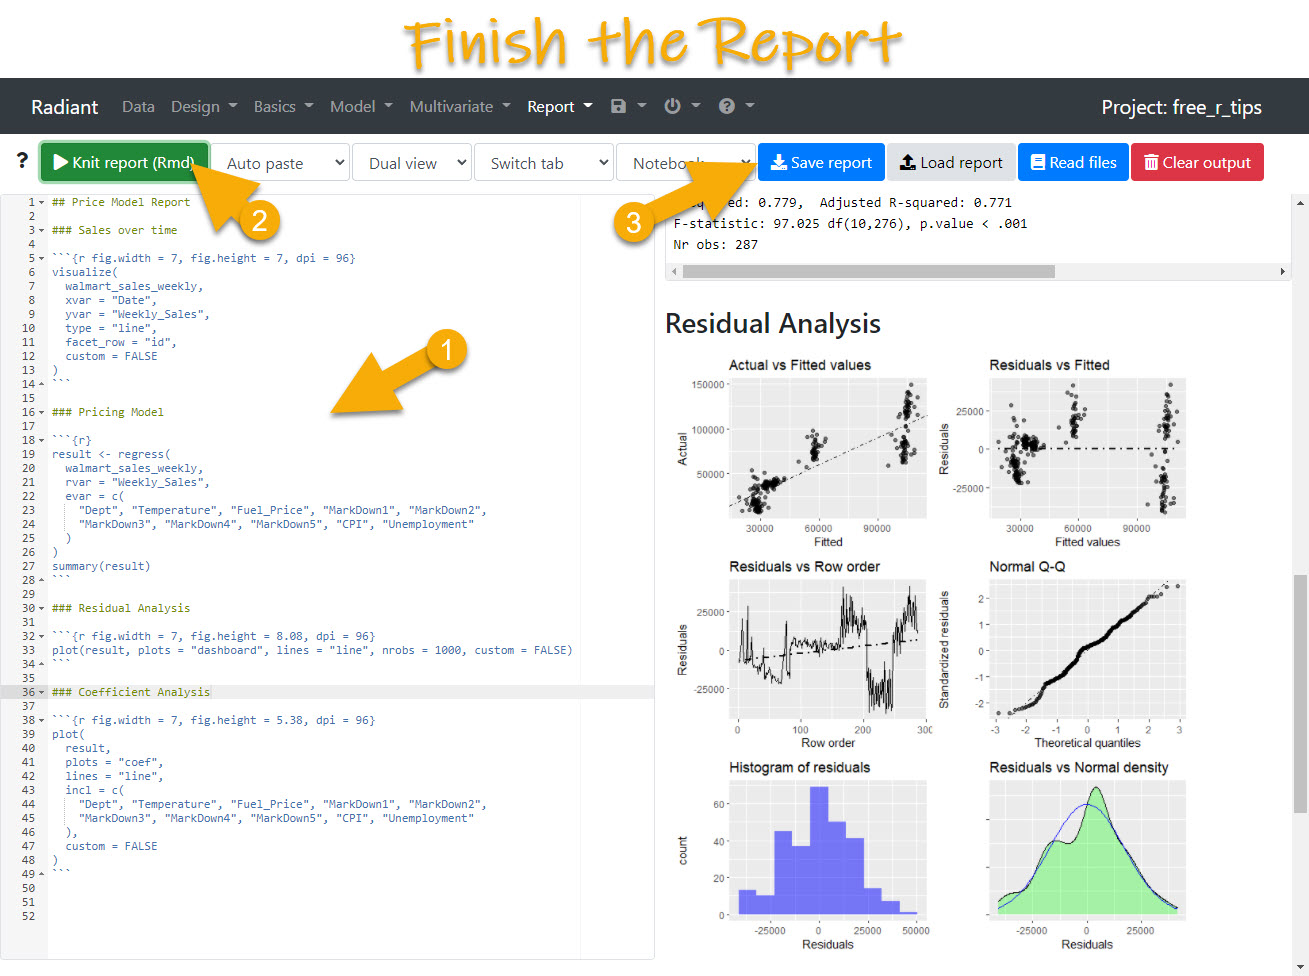
Step 5 - Finish the Report
Once we are happy, we can finish our report. Just hit the “Report Button” to send the results from the Modeling Tab to the Report Tab.
On the reporting tab:
- Add a title and sections to your report
- Move the code chunks to follow the order
- Hit Save Report (I saved as HTML in the Youtube Video)
The report is saved as an HTML document (assuming you switched from Notebook to HTML like I did in the video.)
Conclusions
You just created a report using radiant. But there’s a lot more to data science.
If you’d like to become a data scientist (and have an awesome career, improve your quality of life, enjoy your job, and all the fun that comes along), then I can help with that.
Need to advance your business data science skills?
I’ve helped 6,107+ students learn data science for business from an elite business consultant’s perspective.
I’ve worked with Fortune 500 companies like S&P Global, Apple, MRM McCann, and more.
And I built a training program that gets my students life-changing data science careers (don’t believe me? see my testimonials here):
6-Figure Data Science Job at CVS Health ($125K)
Senior VP Of Analytics At JP Morgan ($200K)
50%+ Raises & Promotions ($150K)
Lead Data Scientist at Northwestern Mutual ($175K)
2X-ed Salary (From $60K to $120K)
2 Competing ML Job Offers ($150K)
Promotion to Lead Data Scientist ($175K)
Data Scientist Job at Verizon ($125K+)
Data Scientist Job at CitiBank ($100K + Bonus)
Whenever you are ready, here’s the system they are taking:
Here’s the system that has gotten aspiring data scientists, career transitioners, and life long learners data science jobs and promotions…

Join My 5-Course R-Track Program Now!
(And Become The Data Scientist You Were Meant To Be...)
P.S. - Samantha landed her NEW Data Science R Developer job at CVS Health (Fortune 500). This could be you.
