How To Become A Financial Data Scientist (Or A Data Scientist In Any Domain)
Written by Matt Dancho
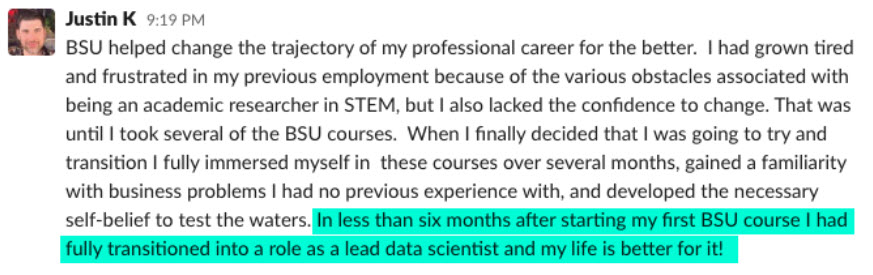
It was December of 2020. Justin was a working in academia at the University of Southern Mississippi doing sports analysis. But he was longing for more.
By June of 2021 (exactly 6 months later), Justin told me that he had just got his dream job - Lead Data Scientist at Northwestern Mutual (one of the biggest insurance firms in the US).
I was ecstatic for him. I knew he was destined for great things. But I also wanted to know more.
How did Justin do it?
So I set out to answer exactly this question. I dove into researching his path and the paths of other data scientists that transitioned in a short period of time. In this article, you will learn what I found out:
- The 80/20 rule (how it helps you provide business value)
- Why becoming a unicorn is slowing you down
- The big mistake you’re making (I made this too)
- The 3 things organizations value (and how to deliver each with data science)
- Case Study: A real world example of how to provide value to a business
- What skills you need to learn (to create value)
- How to earn a $125,000 salary (in under 6-months)
First, let’s talk about the 80/20 rule.
1. The 80/20 rule for business value
As I began researching what separated the those that were becoming data scientists from those that weren’t, I quickly found out a big difference.
The ones that were NOT making it were trying to learn everything. And trying to become masters.
But the ones that WERE making it were doing something different. Something unique.
They were learning by applying the 80/20 Rule.
More specifically they were doing a 2-step process that delivered unheard of results:
- They figured out what creates value for the business.
- Then they applied the 80/20 Rule to create value as fast as possible.
Do you see the difference?
The ones that WERE becoming data scientists understood that speed is critical.
Why is speed critical? (The plateau effect)
I dove a little deeper to understand why speed was critical. Here’s what I discovered.

The ones that were NOT making it were never actually applying anything.
Progress was slow because they had no focus. And they plateaued.
The plateau-effect was costing these unsuspecting data scientists their dreams.
Even worse, their dreams were dying a slow, agonizing death until they simply QUIT.
And these slow learners don’t realize the HUGE financial cost.
The huge financial cost
I wrote about this financial cost in the 3 paths to learning data science here. Just to recap, there are 3 types of data science learning paths:
- Those that have no plan. These are hobbyists. They usually quit. This costs them $8,000,000 over a 35 year career when factoring in a measly 3-percent annual raise.
- Those that have a crappy plan. They will take 5-years. But will eventually learn data science. They will also lose out financially because it took them sooo long to learn data science. 5-years at $125,000 per year when factoring in a low 3-percent raise = loss of $664,000. Ouch!
- Those that have an exceptional plan. They are likely to be successful and can complete the transition in under 6-months.
You see there’s a natural phenomenon that happens when learning ANY new or complex task like learning to code, learning guitar, speaking a foreign language, etc.
We learn by first mastering a small subset of the most frequently used tools.
We then build on those over time.
Learning data science was simply no different.
So let’s dive into how we can become a data scientist with the 80/20 Rule. And focus on generating business value at the same time.
How to become a data scientist
I’m a big fan of context and case studies.
So in uncovering how to become a data scientist, I analyzed a specific domain: Finance. One that I’m very familiar with.
But don’t worry - if you are not a financial person, the process for creating business value is the same for other domains.
Let me explain.
For financial people
If you are a financial professional (or any other professional) seeking to learn data science, then this is what you’ve been waiting for.
The opportunity to understand what organizations in Finance value from the data science practice.
If you understand what they value, you then know what skills to learn to streamline your path from where you are now to being a productive member of a Financial organization (or any organization).
My Talk "How To Become A Financial Data Scientist" - YouTube
For non-financial people
What I’m covering here is focused on finance (because I needed a specific example to drive this point home).
BUT, the same strategies I cover can be applied broadly to ANY domain, as wide-ranging as Marketing, Research & Development, Medicine, and more.
If you are reading this, and don’t have knowledge on Portfolio Theory and Risk Management, then just replace those terms with “Bubble Gum” (or any silly object) and keep moving on.

The strategies for learning what organizations value are most important. Not the BUZZ WORDS or domain jargon.
What I will show you is how you can take domain knowledge and extend it to value-creating activities for the business using data science tools.
But, first, the cold hard reality…
2. Why becoming a unicorn is slowing you down.
Most financial (or non-financial) people that want to break into Data Science make a major a mistake that costs them a career in data science. It starts with their first step.
They see the “Modern Data Scientist” infographic, and immediately feel overwhelmed. Worse, they begin down the path of learning everything. Learning everything is unproductive.
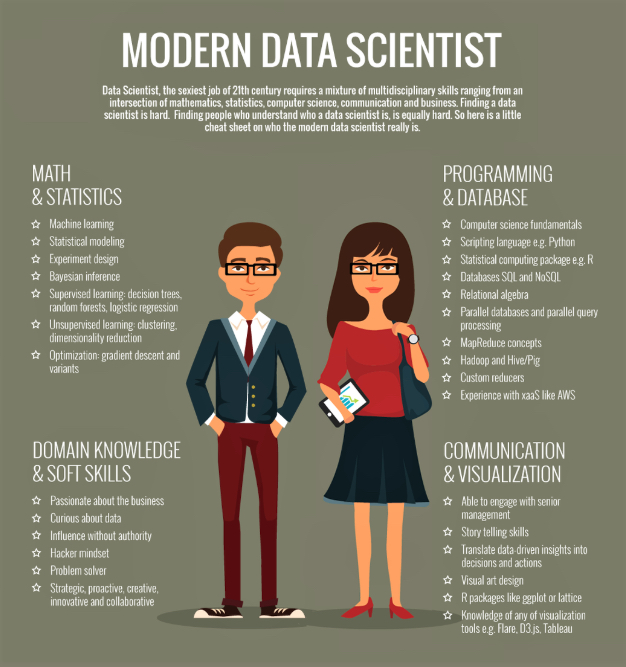
"Modern Data Scientist Infographic" - Everything That Is Wrong With A Learning Strategy
There is no strategy to this graphic. No foundation, no purpose, no intent. Just a smattering of skills that supposedly create a data scientist.
Worse, students starting out believe that this is the ultimate goal - A Unicorn Data Scientist. (What’s that? A unicorn is mythical creature that doesn’t actually exist, but the idea spreads and people believe that they can find it, or worse… become it.)
I’m here to tell you that (fortunately) this myth is not a reality.
Here’s how learning data science really happens.
We All Start At The Same Spot - Zero
When we start out learning data science, we are the most vulnerable to making missteps.
I personally remember feeling overwhelmed and directionless. It’s at this moment that we are easily influenced to take the path of learning everything (and anything).
Learning everything is a costly strategy issue, but an easy one to make. With so many people saying different things, yet none of the “experts” are stepping up to give you mentorship.
It’s scary - being alone on this journey.
Add to it that every misstep costs us time, and it’s easy to see why many data scientists struggle (and many don’t succeed).
Time is our enemy.
The longer we take on this journey, the more competitive it gets and the more likely we are to fail.
Use time wisely. Be efficient. Be effective.
We Grow By Building Skills That Add Value
One thing I learned along my own journey was how to sell my value.
It was an incredibly important lesson that I learned through my experience consulting. Every initial client engagement was a sales pitch. I had to sell myself.
How did I do it?
When I’d begin any consulting engagement, I’d never go in saying I know something. Rather, I’d ask how I can help and listen for opportunity.
As soon as the client began talking, I’d uncover their problems. The more they talked, the more that problems stacked up. And, sure enough I could solve a lot of them.
This showed them value. I exposed problems they didn’t even know they had, and I offered the solution. ME!
I was their bridge to value: Solving the problems they now realized they had. None of this was based on my skills. Sure, skills were needed.
BUT, skills alone don’t sell. It’s solutions, results, and value that sells.
3. The big mistake you’re making
Quite simply skills don’t sell. So why are you marketing them?
We need to change our beliefs.
Here’s your mistake.
Most of us feel that to get a job in data science, you need to learn data science inside and out. Machine Learning, Deep Learning, Neural Networks, Graph Theory - the list goes on.
And then you market this smattering of skills.
Don’t market skills. Market results.
When we adopt a new mindset, one of value over skills, we begin seeking skills that add value incrementally to the larger goal. This is a step in the right direction, one that many data scientists miss.
Remember the “Modern Data Scientist” infographic? Don’t learn all of these skills.
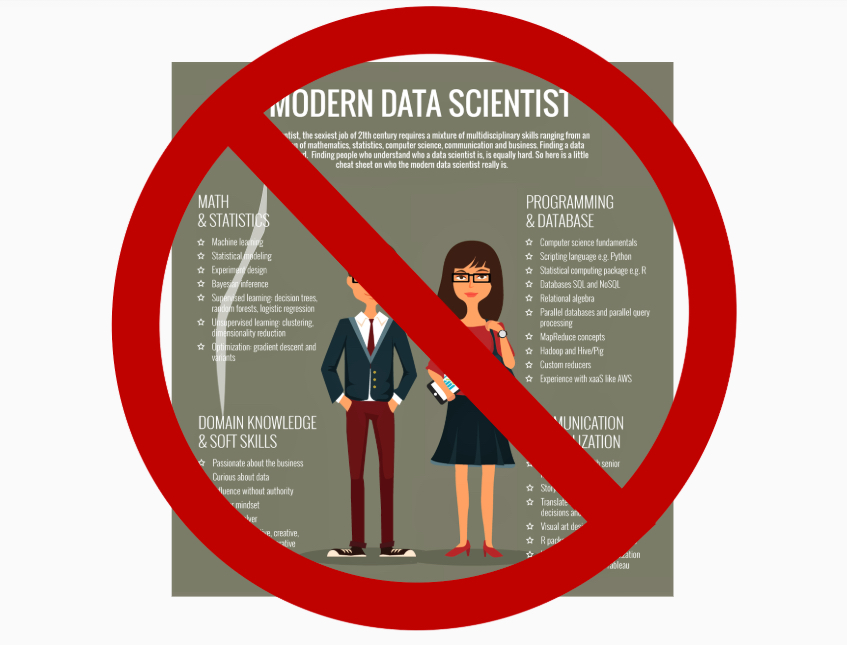
Bad Strategy: Learn Skills That Every Data Scientist "Should" Have
The importance of creating value
Rather than learning everything. A better strategy is learning how to create value by incrementally adding skills to your toolkit. Focus on addressing what financial organizations want. Then learn tools that will deliver it.
Good Strategy: Learn How To Create Value
The next logical questions is…
What do organizations value?
4. The 3 things organizations value.
To be effective in a Financial Organization (or any company), you need to generate value for the business. You do this by:
- Reducing Cost
- Increasing Revenue
- Maximizing Profit
Solving problems that address KPI’s (Key Performance Indicators) is a great place to start. Anything to do with customers, quality, service, performance, and so forth.
How do you (the Data Scientist) generate value?
It’s Simple. By taking applications into production.
What is an application?
Every day we make decisions based on intuition. Decisions in the absence of data are WRONG more often than not.
When we use data to improve decision-making, value is generated for the organization by reducing costs, increasing revenue, and/or maximizing profit.
The application is the THING that non-data scientists (normal people) can use to help them make better decisions.
What is production?
We know that applications can help improve decision making. But applications are worthless, unless people can use them. Production is the process for giving people access to your applications.
Production generates MASSIVE VALUE. In fact, applications that embed data science can save organizations $15,000,000 per year or more!
Don’t believe me? Here’s an expert application that I built that can easily result in multi-million-dollar-per-year savings.
5. Case Study (Finance): Assisting an asset manager’s tactical investment allocation
The only way to make a difference is by understanding the people you seek to help.
Let’s walk through a short example of this.
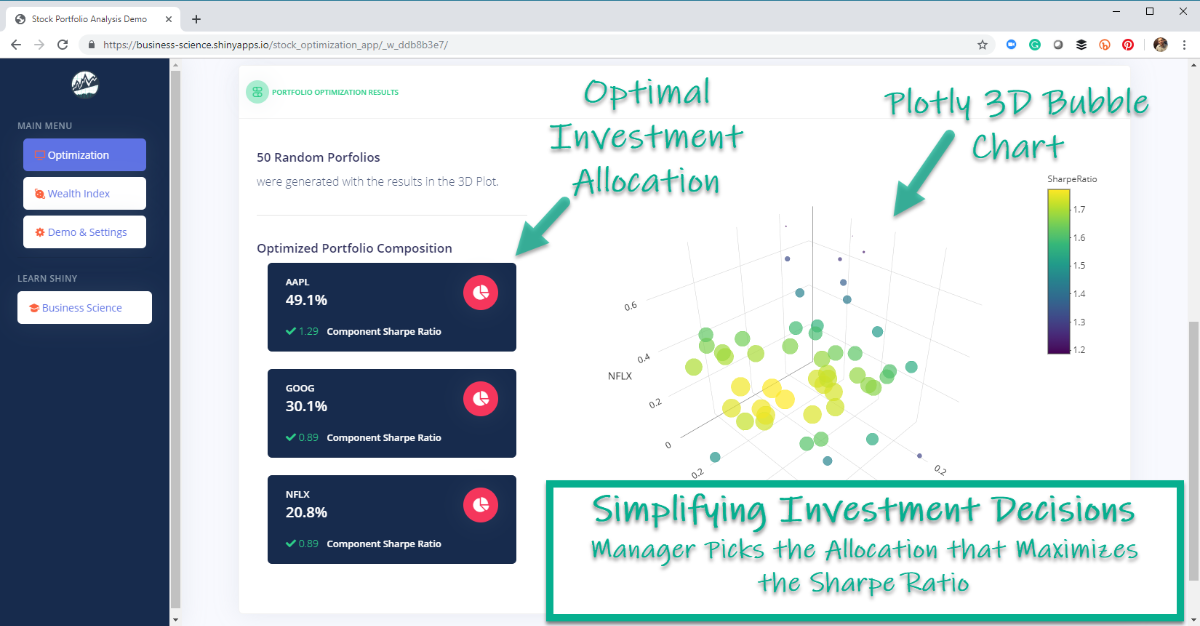
This is the Stock Portfolio Optimization Application (DEMO HERE) that I demonstrated at the R/Finance 2019 Conference.
Stock Optimization Application - YouTube Video
App Demo Here
Problem Statement
Asset Managers select stocks based on their knowledge of the company, market, and intuition of what the future holds. However, allocating an investment among the basket is a time-consuming problem that is costly if the Asset Manager over-weights a risky stock. A bad bet can result in lost Clients, costing the the organization millions in fees that would have otherwise been collected.
Solution Statement
We can use data-driven analysis to optimize the allocation of investments among the basket of stocks. Modern portfolio theory (Capital Asset Pricing Model) suggests that using the Sharpe Ratio (a metric of reward-to-risk) can reduce the riskiness of a portfolio while preserving returns.
The Application
This application allows the Asset Manager to focus on his or her job of picking stocks, while the investment allocation decision becomes automated using modern portfolio theory.
We automate the portfolio allocation process by randomly calculating portfolios, calculating the Sharpe Ratio, and returning the tactical allocation strategy of the best portfolio.
The web application available for demo here and described in the YouTube video generates value.
The application helps an Asset Manager make better investment decisions that will consistently improve financial performance and thus retain clients.
Tactical Asset Allocation - Portfolio Weights Optimized Using Sharpe Ratio - App Improves Decisions
6. What skills you need to learn to do this.
The road to go from where you are now to a data scientist in a Financial Organization can be accomplished in weeks, not years. But, you need to have a plan to strategically learn the right skills.
This where I can help. I’ve been there. I’m willing to step up. I’m willing to guide. But, make no mistake, it will take serious commitment on your part.
Here’s what I recommend that you learn and why. It’s called the Data Science Workflow.
The Data Science Workflow
Building applications like the Stock Portfolio Optimization App is what we call Production.
This is the end stage of your efforts. But what you don’t see is the hard work that you (the data scientist) put in beforehand.
That hard work is actually a process called the Data Science Workflow, and it looks something like this.
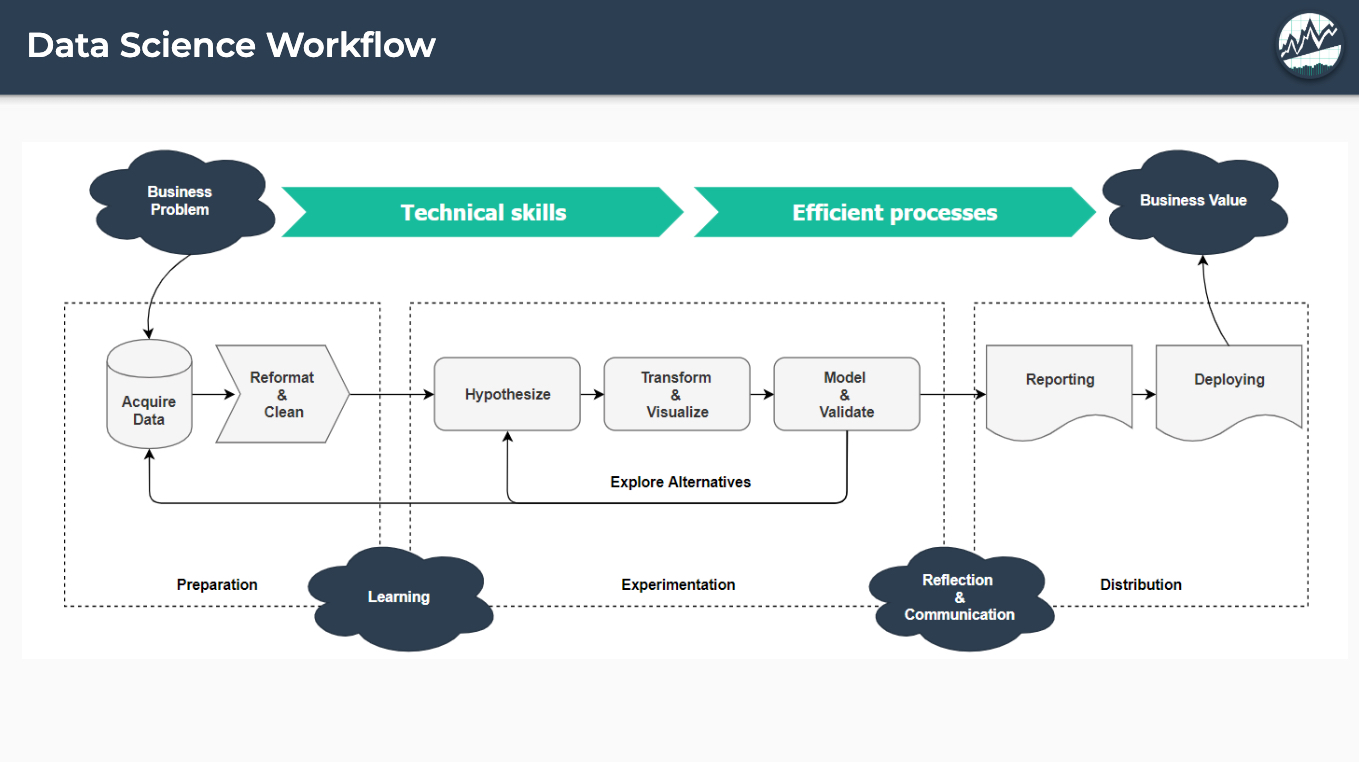
The Data Science Workflow
The “Data Science Workflow” is the series of tasks required to go from business problem to business value. It’s a time consuming process that requires:
- Business Problem Understanding: Working with process stakeholders (e.g. Asset Managers) to understand their unique business challenges
- Communication of Business Value: ROI analysis of any solutions, communication with executive leadership to convey the value
In the middle is a complex series of actions that involve Data Science Tools (everything involved in going from machine learning to reporting and deploying applications).
Here is the same graphic with a set of tools that can be used as part of the “Data Science Workflow”. The tools integrate throughout the problem solving and solution building process. This is how we add value to the organization.
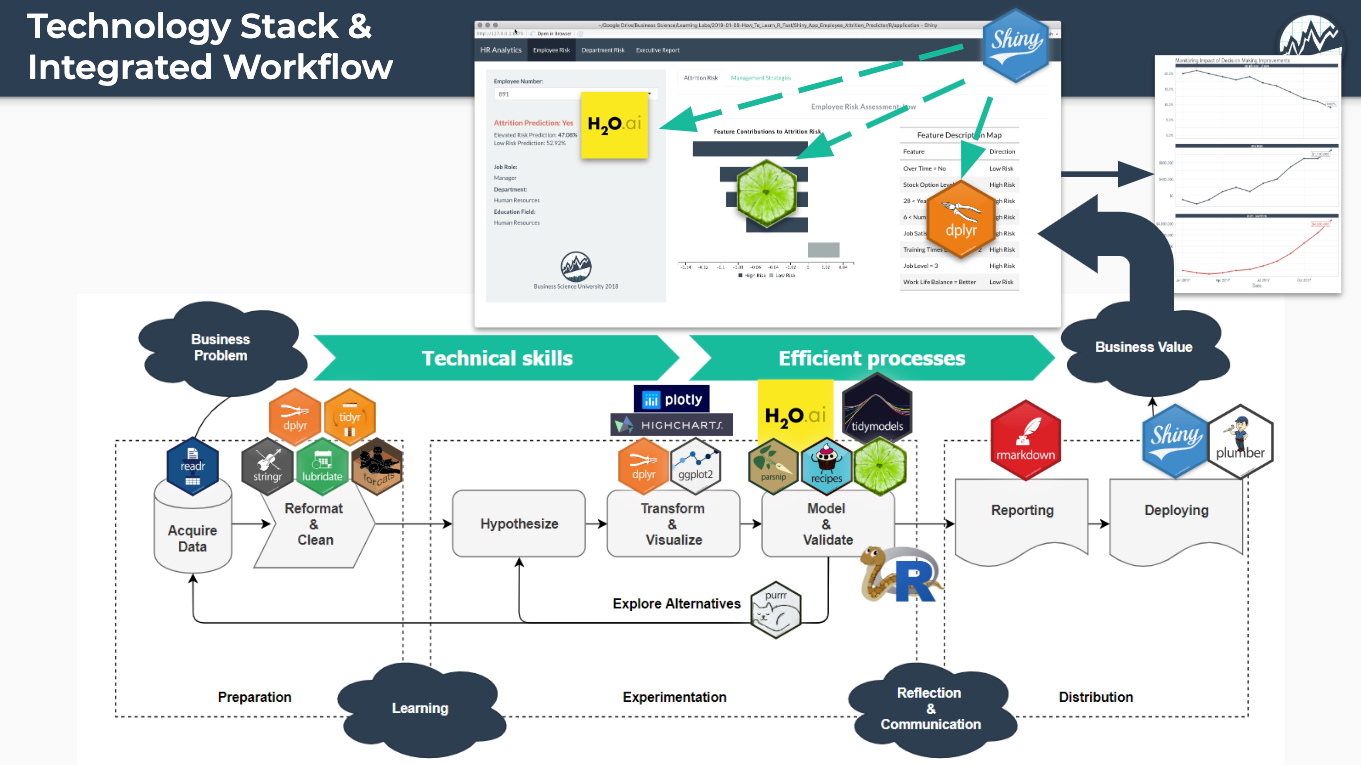
The Data Science Workflow - With Tools Exposed
Value comes from using a specific set of tools that incrementally add value along the “Data Science Workflow”.
This allows us start with a business problem and end with a web application that delivers massive business value that is tracked with reports and measured for ROI (Return on Investment).
Let’s break this down.
Focusing on this specific set of tools cuts the time to learn data science dramatically. This is the 80/20 Rule in Full Effect!
…that incrementally add value…
The tools combine into an integrated approach to solving problems. Therefore, we can’t just read a book on each tool independently. We need to learn the tools together to harness their power.
…that end with a web application that delivers massive business value…
The Application is the Value-Generator. Without it, the data science team adds little value to the organization.
…and we can measure this with Return On Investment (ROI).
Any business improvement should be tracked, reported on, and measured for return on investment. Changes in KPI’s converted to financial value.
7. How to earn a $125,000 salary in 6-months
With everything we’ve covered in this post, you now know what businesses value and what you need to deliver (an application) so they get massive value.
But you have no plan that incorporates the 80/20 philosophy.
In fact it will still take you a minimum of 5 years to learn. (I know because this is how long it took me. Ugh.)
But what if you could do it 6-months?
How amazing would it be to have a 6-figure career that you love?
And in the process earn $125,000 per year or more until you retire and have the financial freedom to do the things you enjoy.
Do you remember Justin?
Justin was student that in less than 6-months transitioned from academia to the Lead Data Scientist of Northwestern Mutual (Top 10 Insurance Firm).
Here’s what Justin did.
Justin is my student.
He learned data science in my R-Track Program.
And in 6-months from starting my program, Justin landed his Lead Data Scientist position making 6-figures in the process (not to mention having an awesome career he loves).
And to date I’ve helped over 3,000 students become world-class data scientists at companies including Apple, Microsoft, S&P Global, and more.
I’d like to help you.
If you are ready to learn. I am ready to teach.
Here’s how.
Join the 5-Course R-Track Today