Customer Segmentation and RFM Analysis with K-Means Clustering - Part 2
Written by David Curry

I. Business Objective
An E-Commerce business wants to keep customers active in purchasing. The business would like to understand customer purchasing behavior to prioritize marketing by customer groups and send relevant promotions to existing customers.
Segmenting customers will allow the E-Commerce business to create personalized marketing for each individual group.
-
Marketing outreach can be prioritized for each group of customers based on the recency of their last purchase.
-
Customer promotions can be personalized based on how often customers purchases and the average amount spend.
Customer segmentation is the process of grouping customers by specific likeness (demographics, interests, behavior, etc).
Creating customer segmentation enables a business to target specific groups of customers and personalize marketing for each group.
R Programming Language
The RFM analysis was performed using the `R` statistical programming language. We teach data analysis and machine learning with `R` at Business Science University.
Business Analysis with R
We offer a beginner 7-week program that teaches you the fundamentals of Data Science with 2 key business projects:
- Customer Segmentation (Unsupervised Learning) - Use K-Means Clustering & UMAP to segment customers
- Product Price Algorithm (Machine Learning) - Use Linear Regression, GLM (Elastic Net), Decision Trees, Random Forest, XGBoost, and Support Vector Machines to develop a pricing model based on product characteristics
Data Science for Business with R
We offer an advanced 10-Week program that teaches Automatic Machine Learning with H2O solving an end-to-end Churn problem for an organization. The student learns advanced data manipulation, preprocessing with recipes, classification, ROC/AUC, Precision vs Recall, Gain/Lift, local interpretable model explanation (LIME), and how to optimize a classification model for return-on-investment.
II. Summary
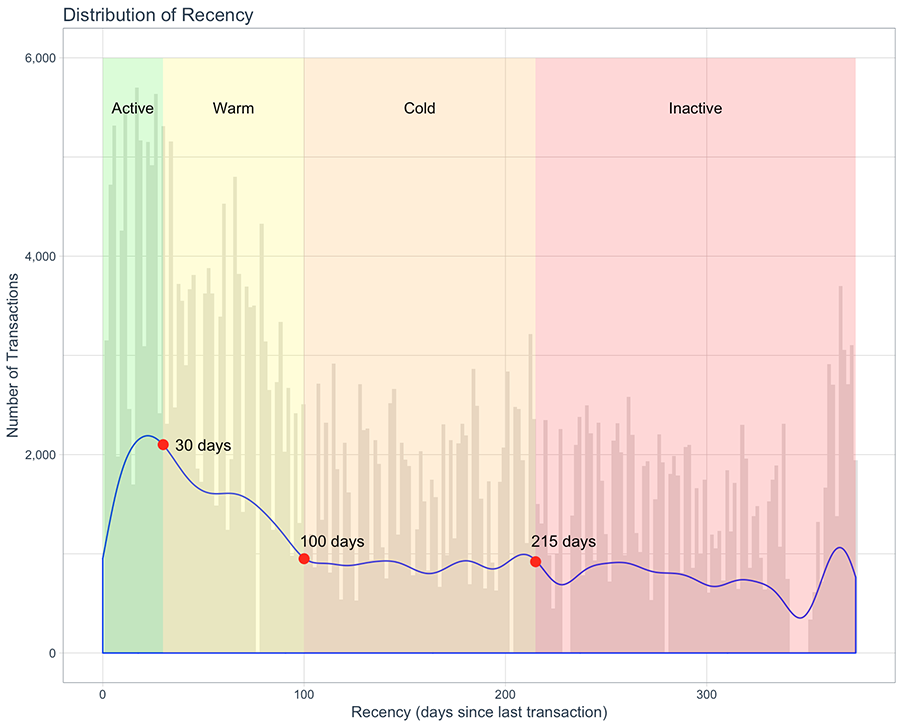
In Part 1 of this article series, I took 1 year of customer transactions from an E-Commerce store and segmented (grouped) customers by how recent they purchased (Recency). The process of segmenting by Recency was done by analyzing and selecting cut-off points where customer orders were in decline.
See plot below — red dots represent a cut-off point between segments (for example, if a customer purchased within the last 30 days they are in the Active segment):
In this article, I will continue the customer segmentation using Frequency and Monetary Value (Amount). The Frequency/Amount segmentation will create a sub-segment for each segment we already have (Active, Warm, Cold, Inactive). Creating sub-segments will group similar customers by how frequent they purchase and the average amount spent.
The Frequency/Amount segment is what will be used to send relevant promotions, based on how often a group of customers purchase and the average amount spent.
III. Business Outcome
I am placing the analysis results at the beginning of the article for those who are not interested in the technical details.
Segmenting customers by recency, frequency, and monetary value gives the E-Commerce business a way to prioritize customer outreach (based on recency) and personalized promotions (based on the average amount spent and how often customers purchase).
Based on the segmentation results, the E-Commerce business should create 5 campaigns for each of the following Frequency/Amount segments:
- Orange segment = 15+ purchases – under $200
- Olive segment = 1 purchase – over $1,500
- Green segment = 2 purchases – under $1,500
- Blue segment = 3-15 purchases – under $250
- Purple segment = 2-3 purchases – under $500
The E-Commerce business should also prioritize segment outreach based on the Recency segments:
- Active
- Warm
- Cold
- Inactive
Each campaign should have promotions that are aligned with the spending amount of the segment. How often you send the campaigns will depend on the group’s frequency. For example, The Olive Segment makes 1 expensive purchase per year, whereas the orange Segment makes many small purchases per year. Therefore, promotions will be very different between these two segments.
Use the Active, Warm, Cold, and Inactive groups to prioritize customer outreach. For example, If there is a customer who makes 1 expensive purchase per year (Olive Segment) and they are inactive, they should have a high priority to target for promotions.
Using RFM Segmentation:
- product promotions will be matched to the average spend amount of customers.
- product promotions will be sent based on how often the segment purchases (you don’t want to constantly send promotions to customers who are only likely to make 1-2 purchases a year).
- promotions can be prioritized by recency, targeting cold or inactive customers who may be likely to make more purchases.
Technical Summary
IV. Frequency/Amount Segmentation with K-Means Clustering
K-Means clustering is an unsupervised machine learning algorithm used to partition data into a set of groups. It classifies objects (customers) in multiple clusters (segments) so that customers within the same segment are as similar as possible, and customers from different segments are as dissimilar as possible.
1. K-Means to create Frequency/Amount segment
K-means clustering is a very simple and fast algorithm and can efficiently deal with very large data sets.
Below I will use K-Means clustering to segment customers by how often they purchase and the average amount spent annually.
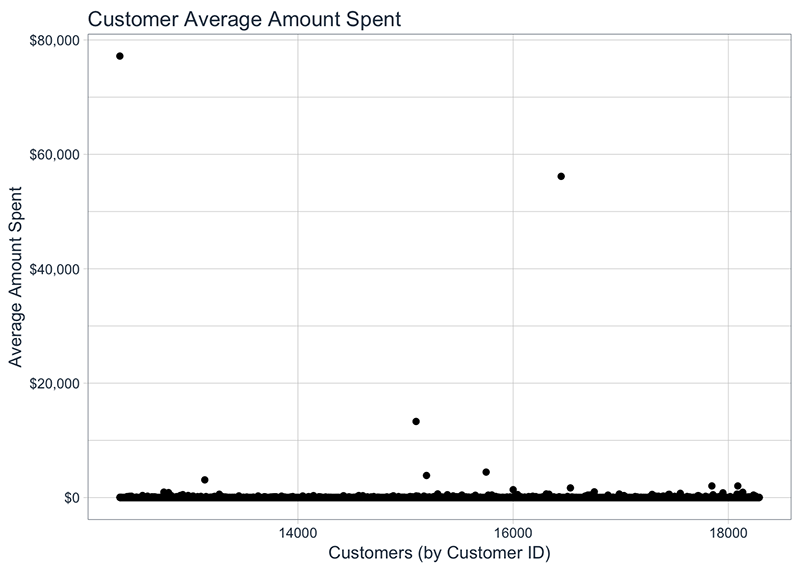
1A. Checking for outliers
There are three customers that are outliers, with an average spend amount over $10,000. My goal is to capture the majority of customers in similar groups. I will remove the outliers because the K-Means algorithm will likely create a segment with only 1 or two customers.
1B. Run K-Means Cluster
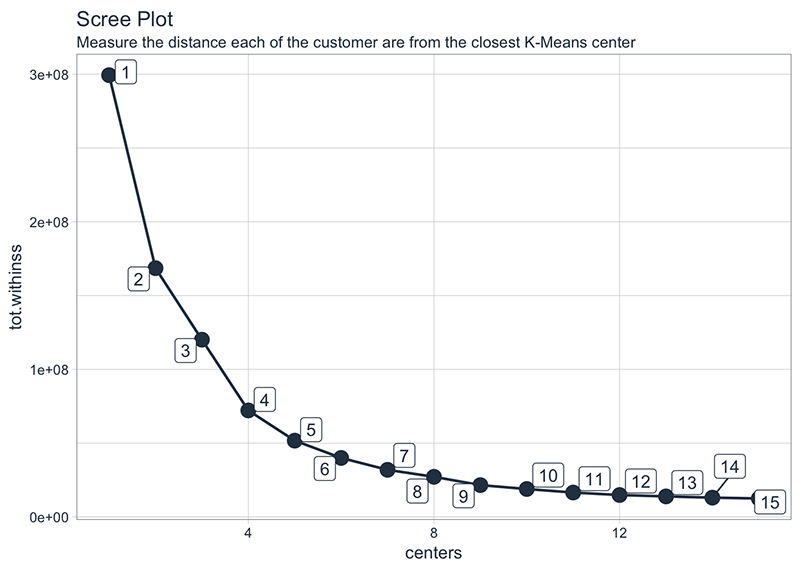
After running the K-Means cluster algorithm, the objective is to determine the optimal number of clusters (segments). I will run the K-Means algorithm with 1 to 15 clusters, then plot the outcome to determine the optimal number of clusters.
1C. Determine Optimal Clusters – Elbow Method
The following steps are used to determine the optimal number of clusters:
- For each number of clusters, calculate the total within-cluster sum of square (wss).
- Plot the curve of wss according to the number of clusters.
- Locate the bend (elbow) in the plot, this is generally considered the appropriate number of clusters.
The plot below shows each K-Means from 1 to 15 clusters. The midpoint of the bend (elbow) is around 4 – 5 clusters. The ideal cluster is chosen by identifying where the difference from point-to-point become less extreme.
1D. Visualize Clusters
Next, I will compare the result of the K-Means with 4 clusters versus 5 clusters.
How to read the plot:
- The x-axis is how frequent a customer purchases
- The y-axis is the average amount spent in a year
- The dots, triangles, and squares represent customers
- The shaded areas represent the cluster (segment)
- The objective is to pick a number of clusters that uniquely identifies each group.
Looking at the K-Means with 4 Clusters plot, the clusters can be defined as follows:
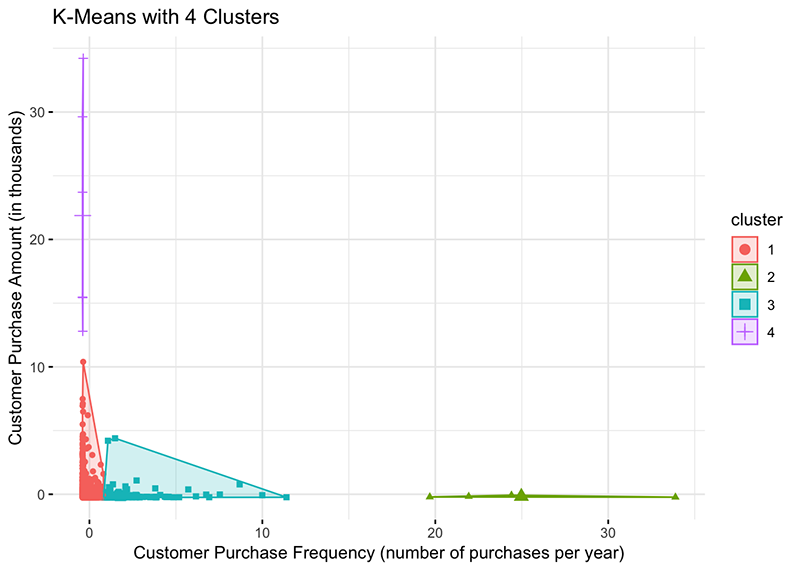
- Orange cluster: Customers who make 1-2 purchases and under $1,500 per year.
- Green cluster: Customers who make over 15 purchases and under $200 per year.
- Blue cluster: Customers who make 2-15 purchases and under to $500 per year.
- Purple cluster: Customers who make 1 purchase and over $1,500 per year.
Looking at the K-Means with 5 Clusters plot, the clusters can be defined as follows:
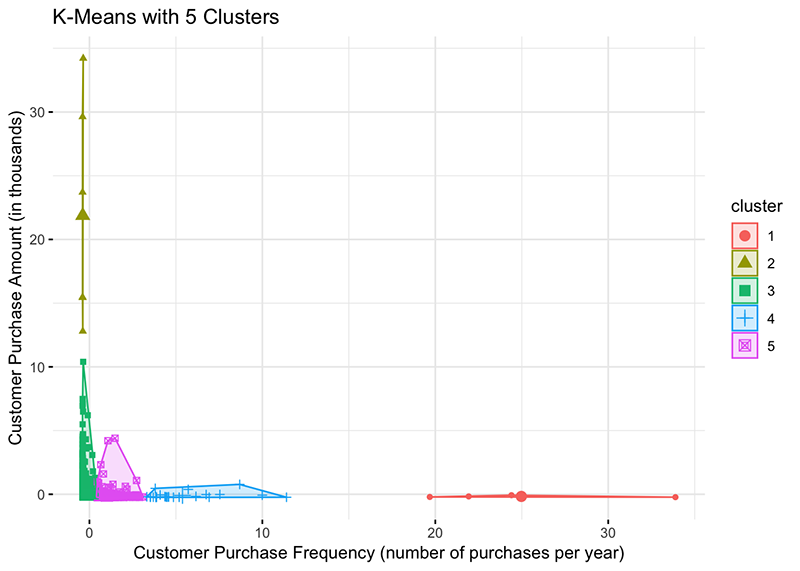
- Orange cluster: Customers who make over 15 purchases and under $200 pr year.
- Olive cluster: Customers who make 1 purchase and over $1,500 per year.
- Green cluster: Customers who make 1-2 purchases and under $1,500 per year.
- Blue cluster: Customers who make 3-15 purchases and under $250 per year.
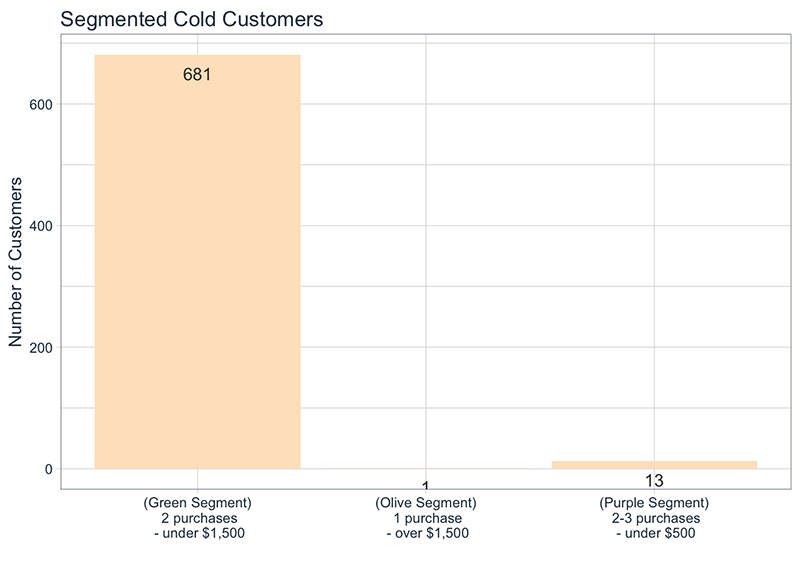
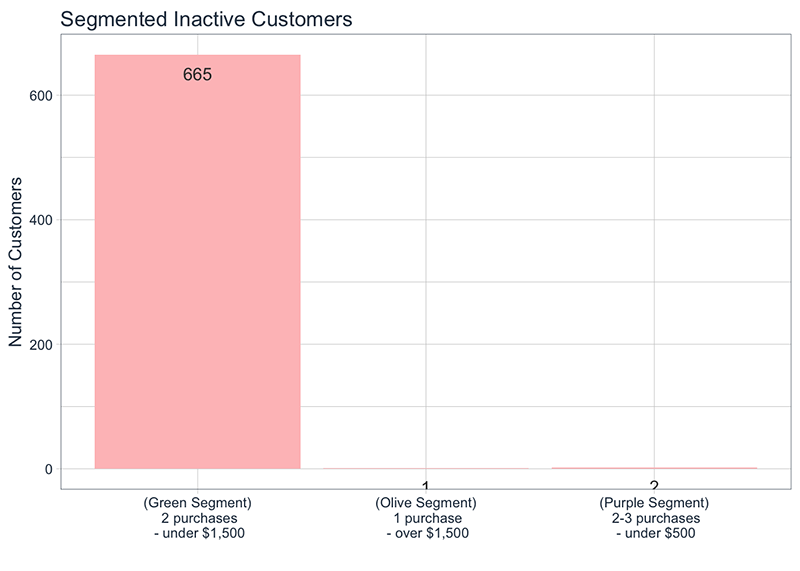
- Purple cluster: Customers who make 2-3 purchases and under $500 per year.
K-Means Cluster Result
The difference between cluster 4 and cluster 5 is segmenting the customers who make 2 – 15 purchases under $500.
Having details about how often a customer will purchase is beneficial for marketing promotions. If a customer only purchases twice per year and has made two purchases, we want to send timely offers so we don’t annoy the customer. However, a customer who purchases 10 times per year and has made 6 purchases may receive offers more often.
I will select K-Means with 5 clusters as the algorithm of choice. Each cluster will be defined as follows:
- Orange = 15+ purchases – under $200
- Olive = 1 purchase – over $1,500
- Green = 2 purchases – under $1,500
- Blue = 3-15 purchases – under $250
- Purple = 2-3 purchases – under $500
2. Apply Frequency/Amount Segments to the Recency Segments
As a recap, the RFM segmentation had two phases. The first phase was to segment by Recency, creating four segments: Active, Warm, Cold and Inactive customers. The second phase was to segment by Frequency and Amount, creating 4 segments.
With the 4 segments for Frequency/Amount, I will split the customers for each Recency segment into sub-segments.
The following visualizations show customers from each Recency segment, with groups for the Frequency/Amount segments:
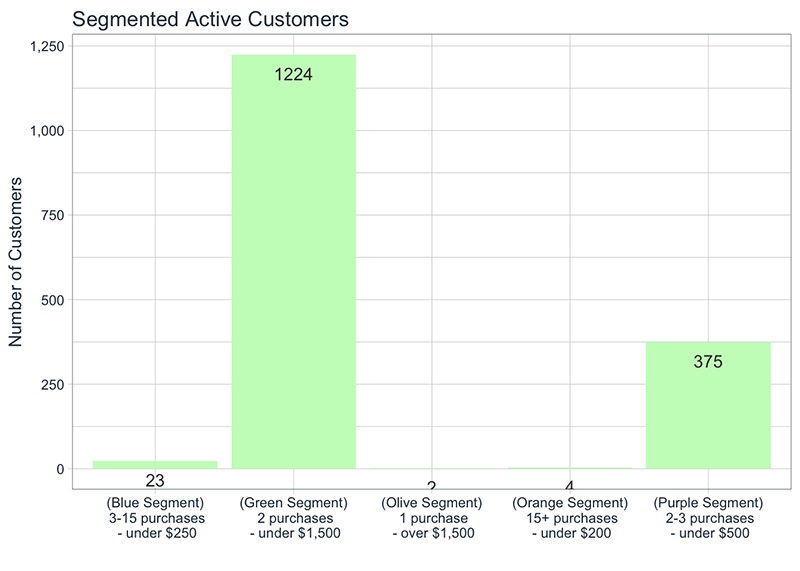
2A. Recency Segment with Frequency/Amount Segments
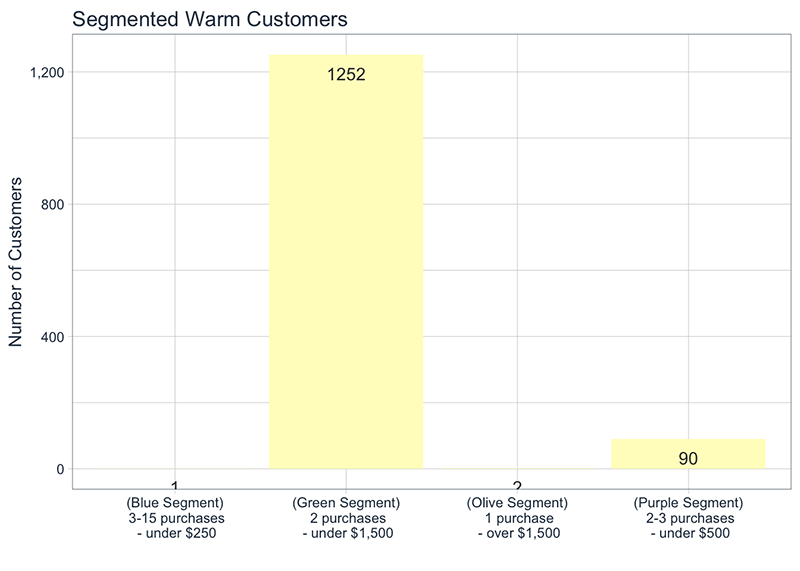
2B. Warm segment with K-Means Frequency/Amount segment
2C. Cold segment with K-Means Frequency/Amount segment
2D. Inactive segment with K-Means Frequency/Amount segment
V. Using RFM Segmentation in Marketing
Segmenting customers by recency, frequency, and monetary value gives the E-Commerce business a way to prioritize customer outreach (based on recency) and personalized promotions (based on the average amount spent and how often customers purchase).
Create 5 campaigns for each of the Frequency/Amount segments:
- Orange segment = 15+ purchases – under $200
- Olive segment = 1 purchase – over $1,500
- Green segment = 2 purchases – under $1,500
- Blue segment = 3-15 purchases – under $250
- Purple segment = 2-3 purchases – under $500
Prioritize segment outreach based on Recency segments:
- Active
- Warm
- Cold
- Inactive
Each campaign should have promotions that are aligned with the spending amount of the group. How often you send the campaigns will depend on the group’s frequency. For example, The Olive Segment makes 1 expensive purchase per year, whereas the orange Segment makes many small purchases per year. Therefore, promotions will be very different between these two segments.
Use the Active, Warm, Cold, and Inactive groups to prioritize customer outreach. For example, If there is a customer who makes 1 expensive purchase per year (Olive Segment) and they are inactive, they should have a high priority to target for promotions.
Using RFM Segmentation:
- product promotions will be matched to the average spend amount of customers.
- product promotions will be sent based on how often the segment purchases (you don’t want to constantly send promotions to customers who are only likely to make 1-2 purchases a year).
- promotions can be prioritized by recency, targeting cold or inactive users who may be likely to make more purchases.
Handling Outliers
I removed 3 outliers who made purchases between $10,000 and $80,000 annually. These customers should be analyzed individually to determine their purchasing habits and how best to market additional offers.
This concludes the two-part RFM segmentation with K-Means Clustering.
Author: David Curry
Founder, Sure Optimize – SEO and Marketing Analytics