Targeted Marketing with Customer Segmentation and RFM Analysis - Part 1
Written by David Curry

Introduction
An eCommerce business wants to target customers that are likely to become inactive. In this article, I will use a grouping technique called customer segmentation, and group customers by their purchase activity.
Customer segmentation is the process of grouping customers by specific likeness (demographics, interests, behavior, etc). Creating customer segmentation enables a business to target specific groups of customers and personalize marketing for each group.
There are many reasons a business may want to segment customers, such as:
- Create and communicate targeted marketing messages that will resonate with specific groups of customers.
- Select the best communication channel for a segment (such as email or social media posts).
- Identify ways to improve products or new product or service opportunities.
- Establish better customer relationships.
- Test pricing options.
- Focus on the most profitable (high-value) customers.
- Improve customer service.
- Upsell and cross-sell other products and services.
This topic will be a two-part series:
-
Part 1: This article will focus on customer segmentation using Recency for the purpose of keeping customers active in purchasing.
-
Part 2: The next article in the series will focus on customer segmentation Frequency and Monetary Value to personalize marketing by segment and value.
Business Objective
Business challenge and Goal: An eCommerce business wants to identify customers before they become inactive. Knowing which customers are moving from active to inactive will help the eCommerce business create targeted marketing to keep customers active with incentives.
Solution: In this article series, I will segment customers based on their Recency, Frequency, and Monetary Value (RFM) to identify how active or inactive they are. RFM analysis is a technique used to identify how recently a customer has purchased (recency), how often a customer purchases (frequency), and how much money a customer spends (monetary value).
Calculating RFM will provide two things:
(1) provide a foundation to segment customers based on their purchase activity and
(2) identify high-value customers.
About the Data
The Data Set comes from the UCI Machine Learning Repository “Online Retail” Data set. You can download the Excel File with transaction data here.
Transaction data is needed in order to compute RFM and create the customer segmentations. The required fields are a unique customer ID for each transaction, the total transaction amount, and the date of purchase.
The data used in this article is from an eCommerce store with transactions spanning one year.
About the Analysis
This analysis includes a Recency, Frequency, Monetary (RFM) analysis, with the focus of this article (Part 1 in the series) on the Recency analysis.
R Programming Language
The RFM analysis was performed using the R statistical programming language. We teach data analysis and machine learning with R at Business Science University.
Business Analysis with R
We offer a beginner 7-week program that teaches you the fundamentals of Data Science with 2 key business projects:
- Customer Segmentation (Unsupervised Learning) - Use K-Means Clustering & UMAP to segment customers
- Product Price Algorithm (Machine Learning) - Use Linear Regression, GLM (Elastic Net), Decision Trees, Random Forest, XGBoost, and Support Vector Machines to develop a pricing model based on product characteristics
Data Science for Business with R
We offer an advanced 10-Week program that teaches Automatic Machine Learning with H2O solving an end-to-end Churn problem for an organization. The student learns advanced data manipulation, preprocessing with recipes, classification, ROC/AUC, Precision vs Recall, Gain/Lift, local interpretable model explanation (LIME), and how to optimize a classification model for return-on-investment.
Data Analysis
The raw data has close to 550,000 transactions with over 4,000 customers.
After inspecting the data, some transactions have been removed:
- A portion of transaction data are missing customer ID. Customer ID is required for this segmentation – these transactions will be removed from the data set.
- 2% of transactions are item returns. For this demonstration, transaction returns are removed, but the initial transaction will remain in the data set to maintain Recency and Frequency for all customers.
After removing missing value and return transactions there are close to 400,000 transactions remaining.
Customer Segmentation
The segmentation goal is to group customers by how recent they made a purchase. The following segments will be used to group customers: Active, Warm, Cold, Inactive.
A common starting point for this type of segmentation is to group customers for transactions for a given year. Segmenting by year will account for seasonal purchase spikes and drops.
Defining a time range for each segment will depend on the Recency of customer transactions. For a large eCommerce business such as this, the Active and Warm segments should have short time ranges to correctly identify customers before they become Cold and Inactive.
Assign Segment Time Range using Recency
Reminder: The business goal is to create targeted marketing and contact customers before they move to a lower segment. Therefore, the time range for Active, Warm, Cold, and Inactive segments should be selected to best capture customers’ purchase behavior.
This time range selection will be a starting point, but keep in mind that segmentation time ranges should change over time based on gathering more transaction data, marketing campaign performance, and business goal changes.
Below is a plot of the distribution of Recency for all customers:
Recency of transactions in the past year
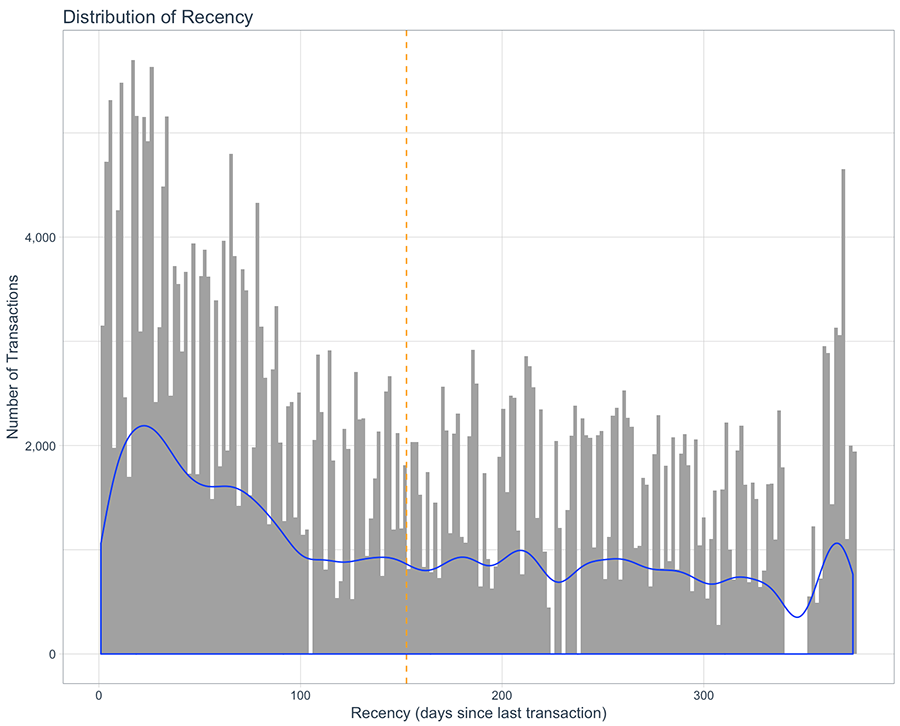
This plot visualizes the number of days since the last purchase for all transactions.
- The orange line represents the average number of days since last purchase (153 Days).
- The blue line represents the density of transactions over time. Think of it as how Recency is “trending”.
This is a starting point for selecting time ranges for each segment. Looking at the “trend” line, I’m going to start with the following segment time rages:
Segmentation using Recency
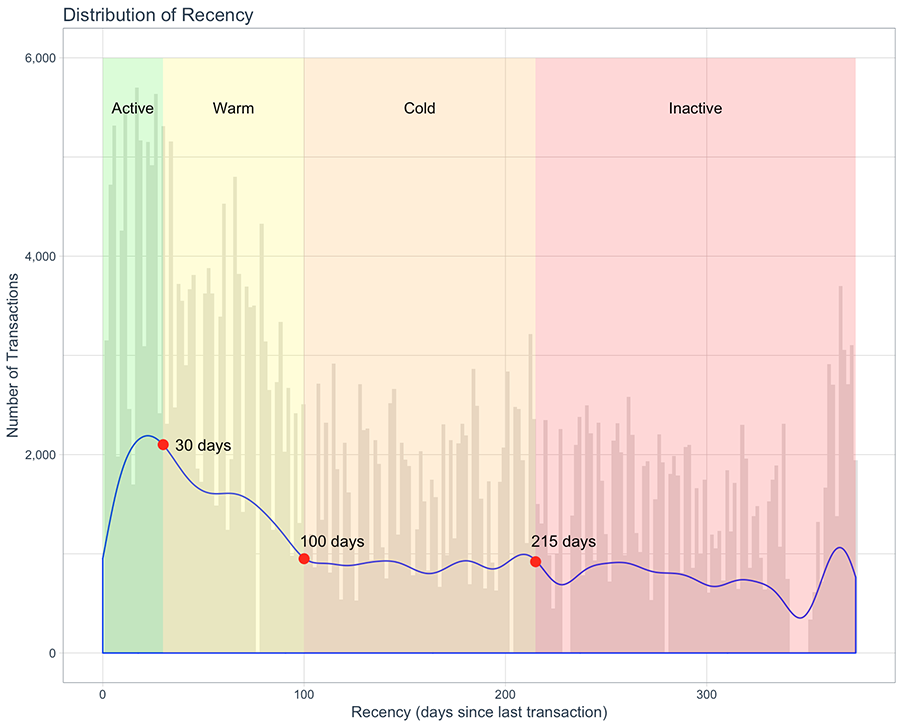
This is the same plot as before, with the addition of an overlay of colors that represent each segment. The red dots are a demarcation of the number of days since the last purchase before a customer moves to the next segment. The demarcation points were selected with the goal of capturing customers within a group before the density trends downward (blue line starts to go down).
Each segment is defined as the following:
- Active = Recency (days since last purchase) is equal to or less than 30 days
- Warm = Recency (days since last purchase) is between 31 and 100 days
- Cold = Recency (days since last purchase) is between 101 and 215 days
- Inactive = Recency (days since last purchase) is more than 215 days
The Recency distribution plot segments all customers by how recent they made a purchase over a year, with defined time ranges for each segment.
Advanced Tip!
If you have transaction data for two or more years, you can create customer segments for each year. With multi-year customer segmentation, create a transition matrix to compare how many customers are moving from one segment to another over years.
Use the transition matrix combined with prior marketing performance to adjust current targeted marketing campaigns.
Customer Segmentation Summary
All transactions have been segmented using the time rages defined above. Here is the distribution of customers by segment:
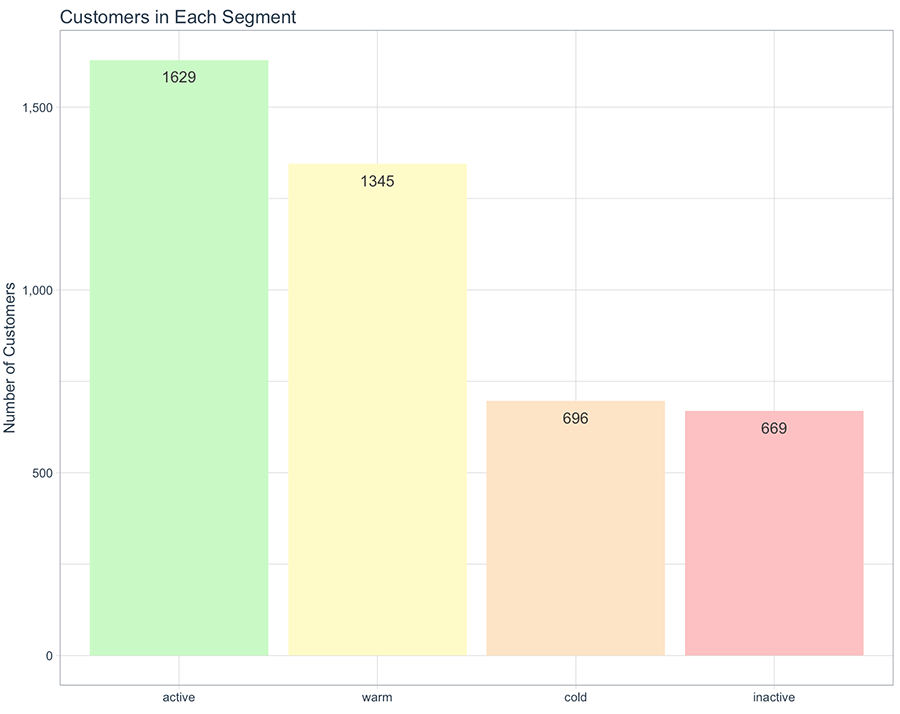
With all customers identified by segment, the eCommerce business can now create an action plan to target customers who are close to moving to lower segments.
Conclusion
Targeted Marketing Campaign
In this article, I used transaction Recency to define and create customer segmentation. With the segmentation complete, the eCommerce business can now create targeted marketing campaigns for customers who are close to falling in segments: from Active to Warm, and so on.
Further Considerations:
- Customer segmentation time ranges should be adjusted based on a balance of business goals, customer purchasing behavior, and marketing performance. The right balance can be found with more transaction data and monitoring and adjusting targeted marketing performance over time.
- Segments can be split by customer value, such as Active High Value or Warm Low Value. Segmenting by value gives the business finer control of messages to customers, where they can offer promotions that are within customer spending habits. Knowing each customer value also helps the business create targeted marketing for high-value customers.
(This will be presented in Part 2 of the article series)
Part 2 of the of the series:
The next article in the series will focus on customer segmentation Frequency and Monetary Value to personalize marketing by customer segment and customer value.
Author: David Curry
Founder, Sure Optimize – SEO and Marketing Analytics