How To Solve 90% of Business Problems with Data Science (The Business Science Problem Framework)
Written by Matt Dancho
Data Scientists want to solve business problems. However, the sad fact is that most data science projects in organizations fail. It’s not because of lack of skill or knowledge. Data science projects need a clear and effective plan of attack to be successful. As data scientists, we study a wide array of tools: advanced algorithms, knowledge of statistics, and even programming skills.
If you’re like me, you’ve had to learn how to do data science projects through trial and error. Fortunately, I’ve learned a lot over the past several years working with clients, and I’ve integrated the best resources into a 7-step framework that will solve 90% of data science projects successfully while cutting your project times in half: The Business Science Problem Framework.
In this article, I’ll cover the basics showing you how the BSPF helps as a guide for business problem solving AND successfully completing 90% of data science projects (BONUS: Customer Churn Problem Case Study). Download the problem-solving framework for FREE here.
Learning Trajectory
In this article, you’ll learn:
My Biggest Failure (disaster with a Fortune 500 client)
I’d be lying to you if I said I was always good at data science. This is a true story of a disaster with my first Fortune 500 client. And, how I overcame it (and created a profound data science framework that has allowed me and my students to solve 90% of data science projects successfully).
It was February of 2017, and I had just founded Business Science (my company). At that point I was taking on consulting jobs in addition to working my 9-5. Business Science was a way to mitigate risk and liability. And, it was a lot of fun because I was actually making money doing what I enjoyed: data science and R programming.
Business Science originally started out serving clients as a consulting firm. I’d help small financial companies create Shiny web applications using financial analysis and time series with my tidyquant R package that I was uniquely qualified to handle. But word started to spread (a good thing, right?)
In September 2017, I received a big opportunity when a Fortune 500 company signed up with Business Science to do a quick-turn data science job. I’d just released an article on HR Analytics and Machine Learning that went viral.
I received a job in which the client provided a data-dump from a Workday Cloud HR Database. The client was to present to executive management the following week and wanted to show predictive insights from their data.
The job with my first Fortune 500 client did not go well
I received the data on Friday, and was to present findings on Monday so the executives could add the results into a CEO presentation on Wednesday. I contracted an HR Specialist out of Houston. He and I worked non-stop from Friday through to Monday analyzing their data, extracting insights, and creating a detailed report that documented our entire analysis. We actually created a pretty cool algorithm that detected 13 or so employees that were not currently being targeted for the “executive track”, but should have been based on their data.
But, this report and algorithm was not what was wanted. Our contacts were expecting something different than what we interpreted from the conversations (still I do not know what they wanted). What we delivered was overly technical, not in a format they could easily add into their presentation, and - bottom line - not what they wanted.
Ugh! I felt horrible.
Signing up for this job was not smart but an excellent learning experience that paved the way for data science education.
I learned that if Business Science was going to be successful, we needed to do better.
I took the next 2-weeks off from any consulting engagements. I poured over the every step of what happened. And then it hit me.
I had no plan. I needed a framework that would be the guiding light for what a successful project needed.
The Business Science Problem Framework My 7-step framework that will solve 90% of data science projects successfully while cutting your project times in half

The Business Science Problem Framework (or BSPF for short) was a systematic process that I developed to help manage the data science project. The BSPF:
- Provided a clear plan that I could discuss with executives and align their interests with a return-on-investment (ROI) oriented framework.
- Exposed the key steps in a data science project in a way that exec’s understood
- Showed that it takes several weeks if not months to do a data science project right
- Helped bring client questions up front in early discussion, which we were able to answer and build into the project scope
- Gave the clients a sense of confidence that we knew what we were doing (and we did!) We began using the BSPF framework on every job. We saw client satisfaction skyrocket.
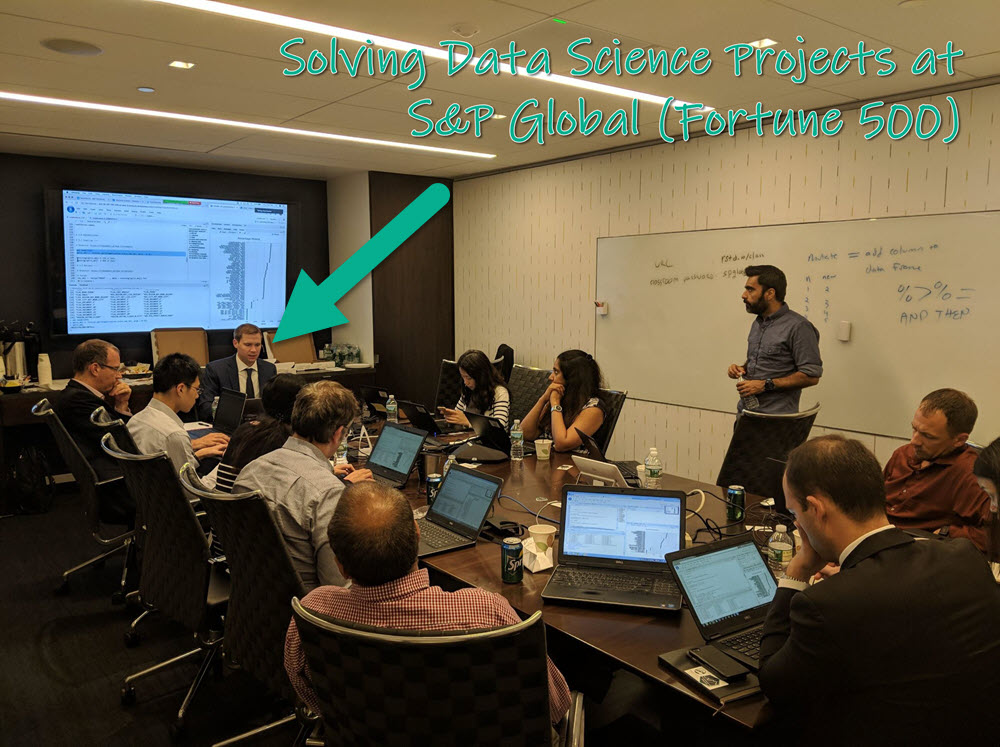
After implementing the BSPF in my next job, the project went better. But I continued to improve it over time. And before you know it, I was able to help Fortune 500 companies like S&P Global complete their data science project and training initiatives by implementing the BSPF concepts.
What It Takes To Succeed
A successful data science project doesn’t happen by accident. It takes:
- Communication to effectively pitch a benefits to executives showing the results that relate to organizational goals
- Business understanding, which only happens through interaction with the business stakeholders that are closest to the process or problem
- Planning to align everyone involved with the project scope and plan
- A checklist of proven actions that must be considered
The single most effective resource in my arsenal is a special project framework that I’ve designed, pooling from my consulting experience and combining with proven project management resources and philosophies. It’s called the Business Science Project Framework (BSPF).
Business Science Problem Framework (BSPF)
Acing interviews and cutting project times in half
The BSPF is great as a systematic plan of attack, but it’s more than just me saying this. It’s been validated based on client and, now, student feedback. Students have been using my BSPF framework to:
Now that you understand what the BSPF can do, let me show you how it works.
The Goal: Systematic Decision Making
The goal is simple: to implement data science in a way that enables decision making to follow a systematic process. We do this through the following equation relating measurement and analysis to improvement within a business context:
\[Measurement + Analysis = Improvement\]
Equation for organizational improvement via systematic decision making
The combination of measurement and analysis are critical for businesses that want to improve. Measurement, or collecting information typically in the form of data, combined with analysis, or digesting the information into usable insights, will lead to improvement. This improvement is driven by Systematic Decision Making, or converting the learning that we achieve through measurement and analysis into processes that improve results.
The reality is that this equation is over simplified. Before we can implement Systematic Decision Making, we need to understand the business. And, before we can understand the business, we need to identify the business problem. Thinking about this further, achieving Systematic Decision Making follows a path that can be visualized as a pyramid built on identifying drivers and understanding the business.
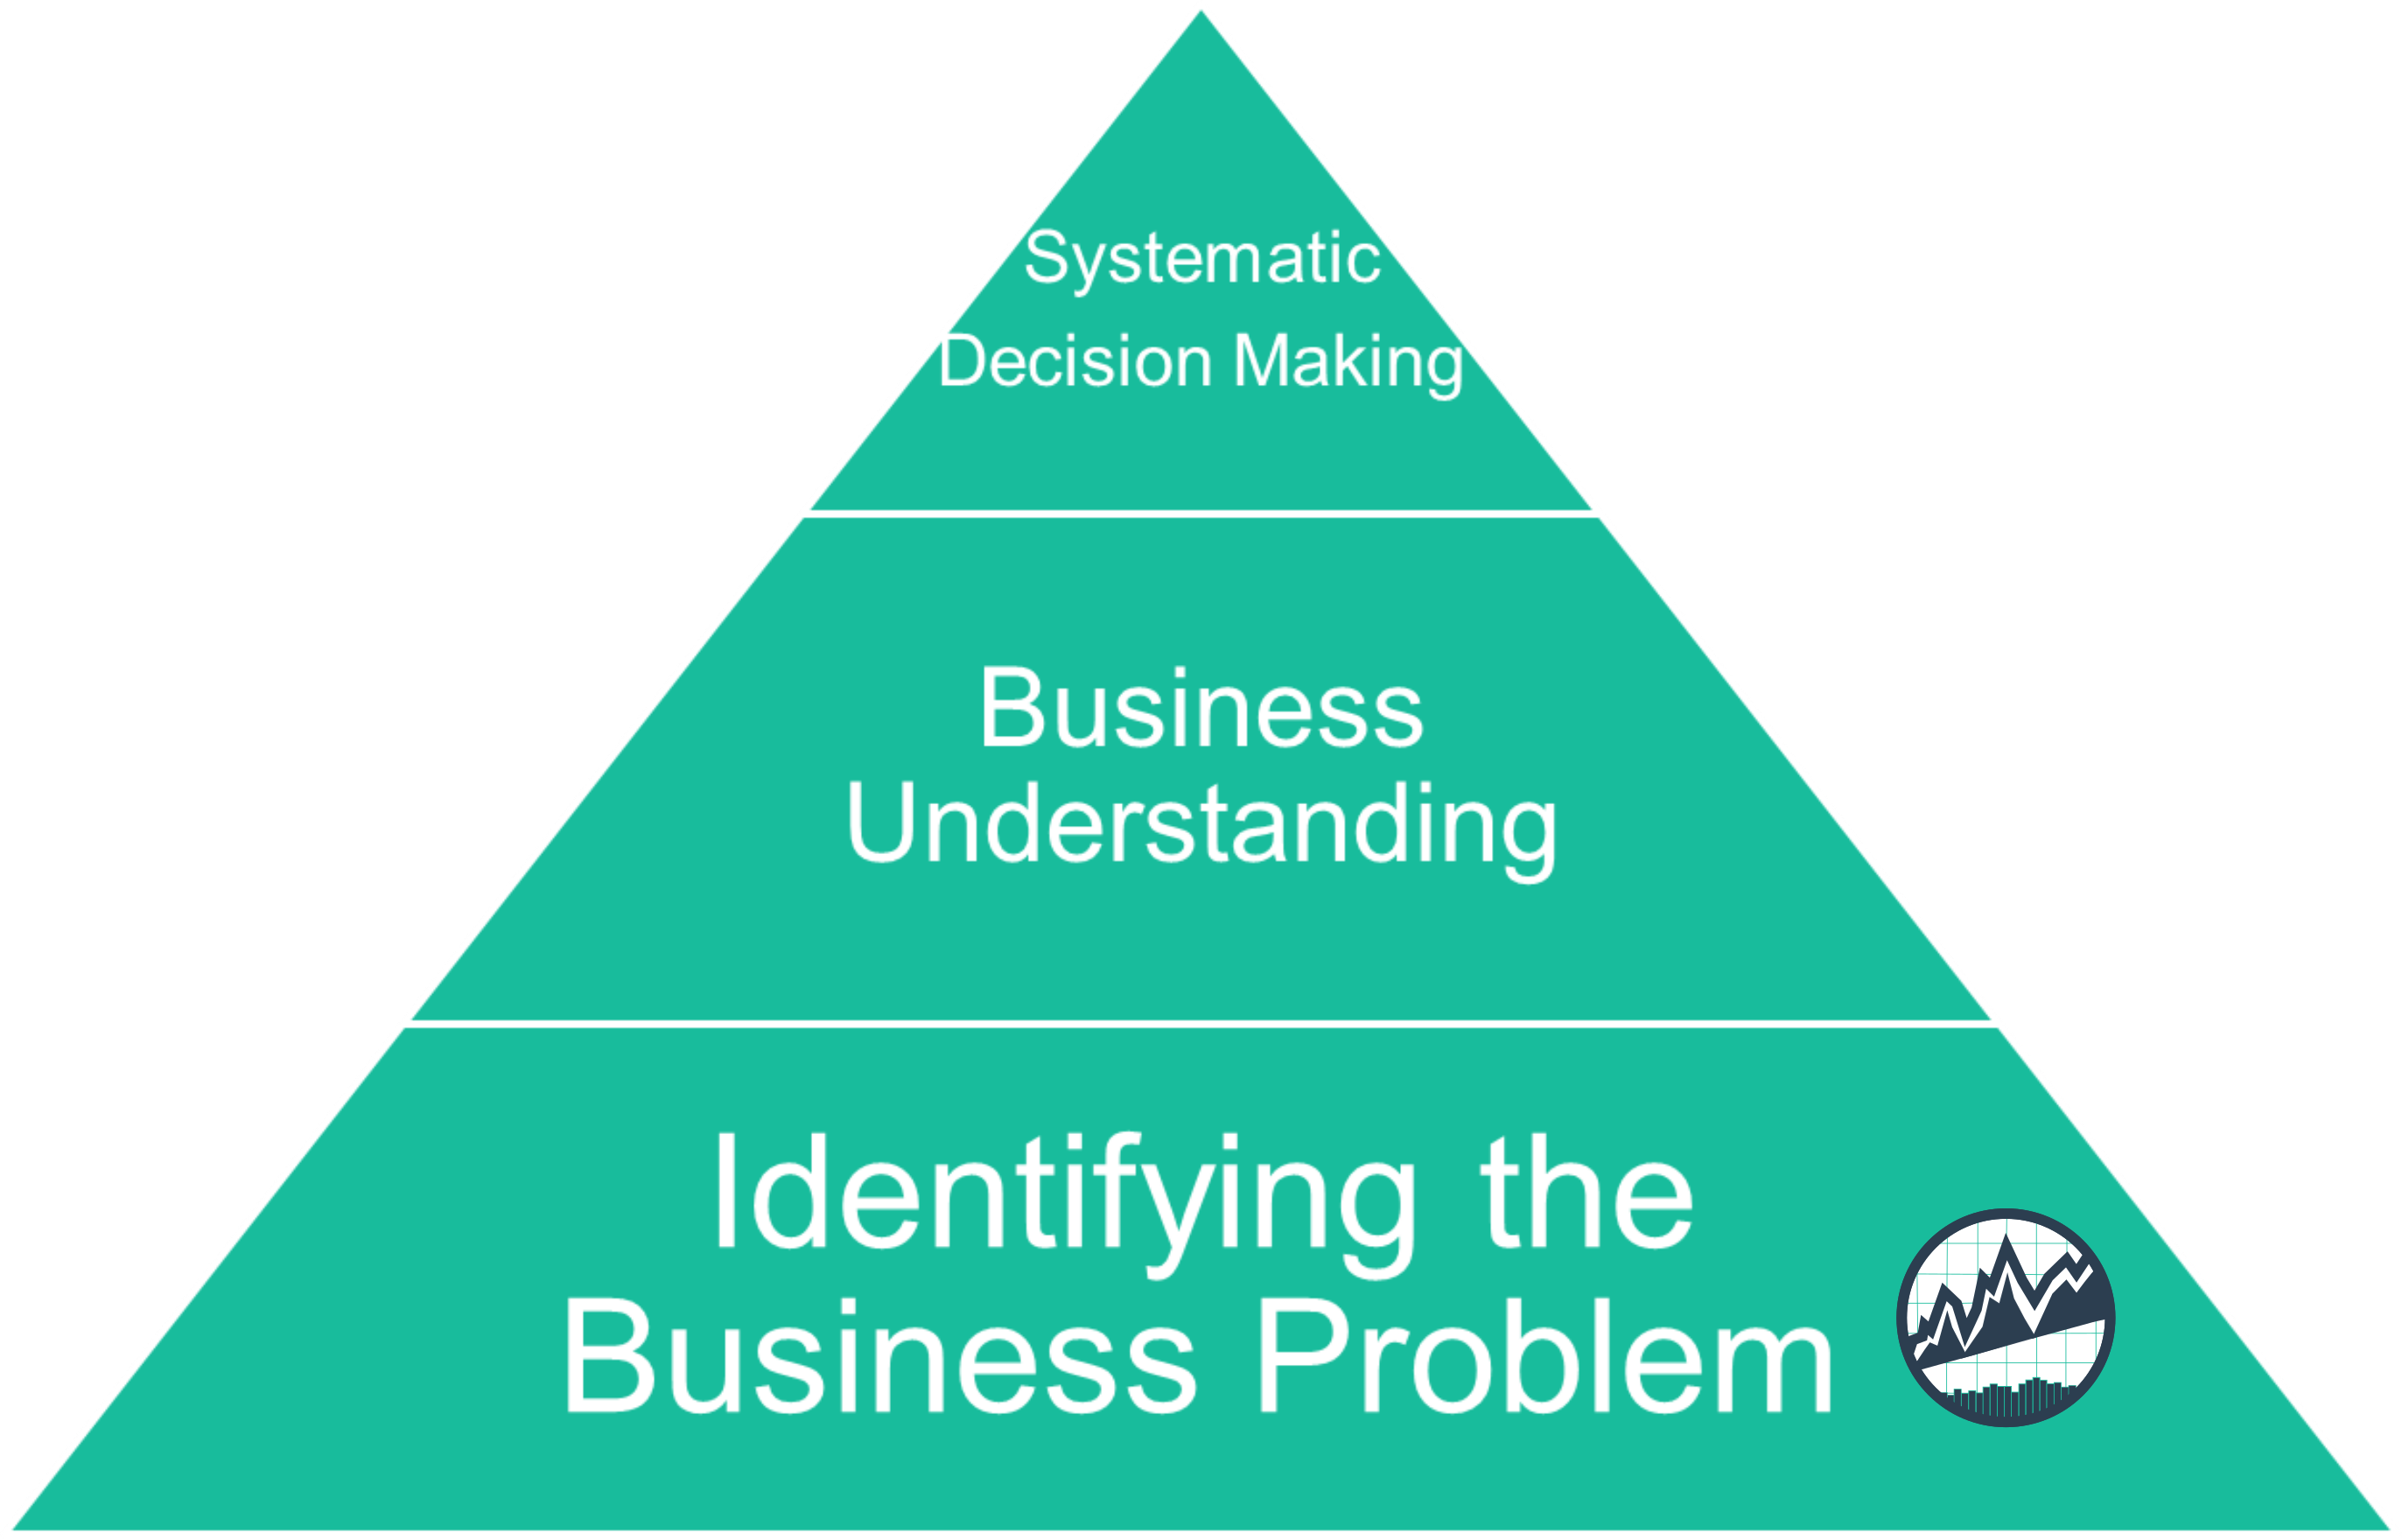
Systematic Decision Making Pyramid
This process of identifying problems, then understanding the business, and then converting the learning into systematic decision making is what the BSPF helps us do!
Get The BSPF
The BSPF allows us to go from identifying business problems to making systematic decisions. You can download the BSPF for FREE here.
Business Science Problem Framework (BSPF)
The BSPF combines three tools making it both high level and detailed while being built on experience:
- Business Science Experience: Our own internal learnings that have been incorporated into a course available for students that want to learn Data Science For Business (DS4B). From how to setup a data science project to how to show financial impact and size the business problem in terms executives need to see.
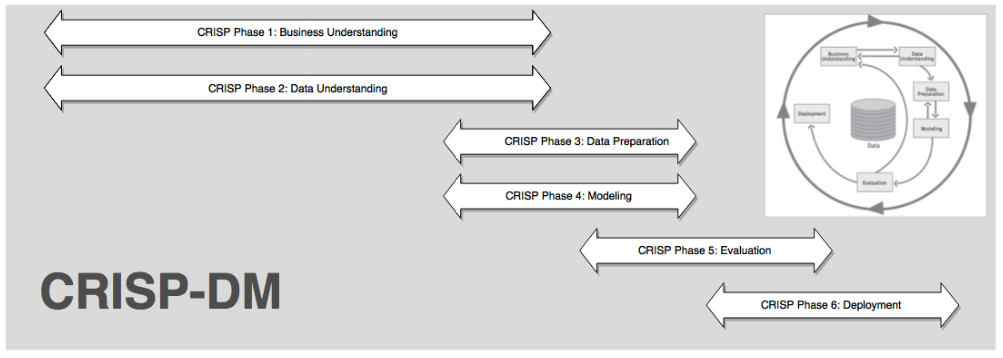
- CRISP-DM: A high-level data mining project framework that generalizes well to any data science project, but lacks critical details for business problems.
- Principles by Ray Dalio: A great book that touches on so many learnings that Ray Dalio, Founder of Bridgewatter Capital, has learned through successes and failures. The learning and business analysis philosophy has been incorporated into the BSPF.
How The BSPF Works (7 Steps)
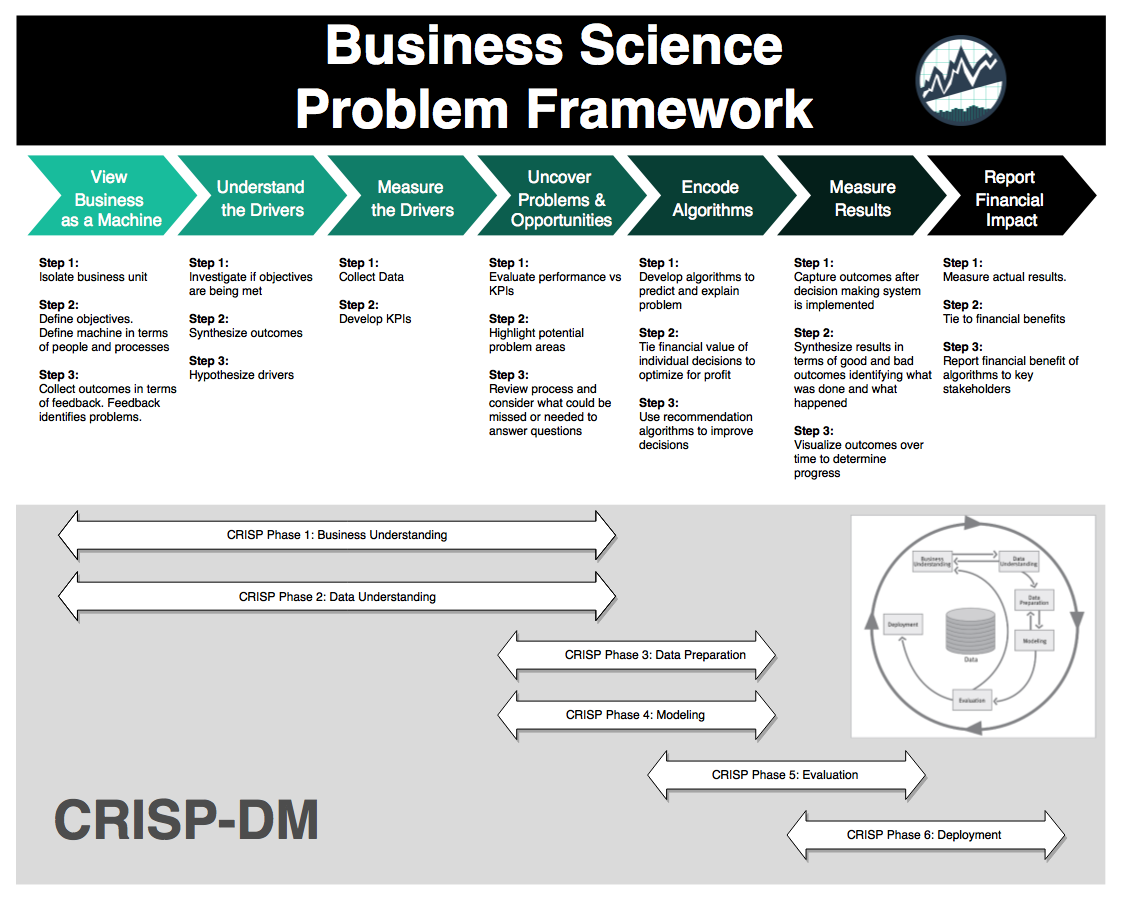
The BSPF is split into a top and bottom section. The top half contains details of what to investigate while the bottom half contains high level stages of the project. The two sections are integrated, meaning they work together to provide a complete program for managing a data science project in a business context. Finally, the BSPF is built on experience, which means it’s validated.
BSPF Top Half
The BSPF has seven steps that are detailed with specific actions focused on understanding the problem and tying the results to Return On Investment (ROI), which is what the organization is keenly focused on:
- View The Business As A Machine
- Understand The Drivers
- Measure The Drivers
- Uncover Problems and Opportunities
- Encode Algorithms
- Measure Results
- Report Financial Impact
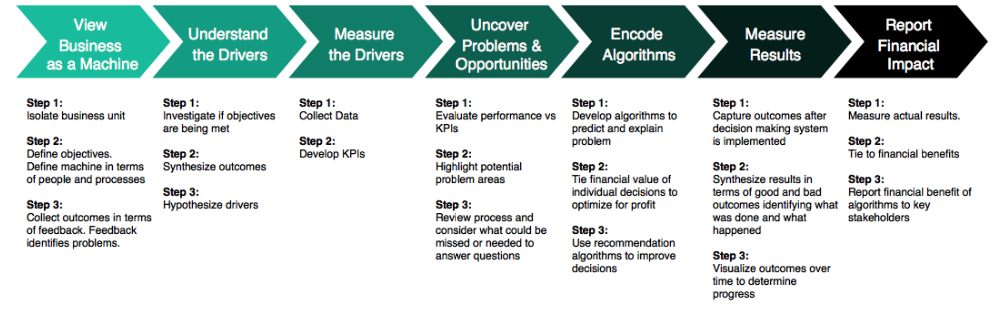
Top Half of BSPF
BSPF Bottom Half
The seven BSPF steps flow along the six phases of CRISP-DM that are high-level stages for any data science problem (beyond just business):
- Business Understanding
- Data Understanding
- Data Preparation
- Modeling
- Evaluation
- Deployment
Bottom Half of BSPF
The beauty of the framework is that we get both high-level and detail in one package!
Built On Experience
Further, it’s built on experience and best practice of business analysis. Many of the philosophies come from the writings of Ray Dalio (Refer to Principles) along with our experience using the BSPF with clients. Beyond, high level and detailed, it’s proven!
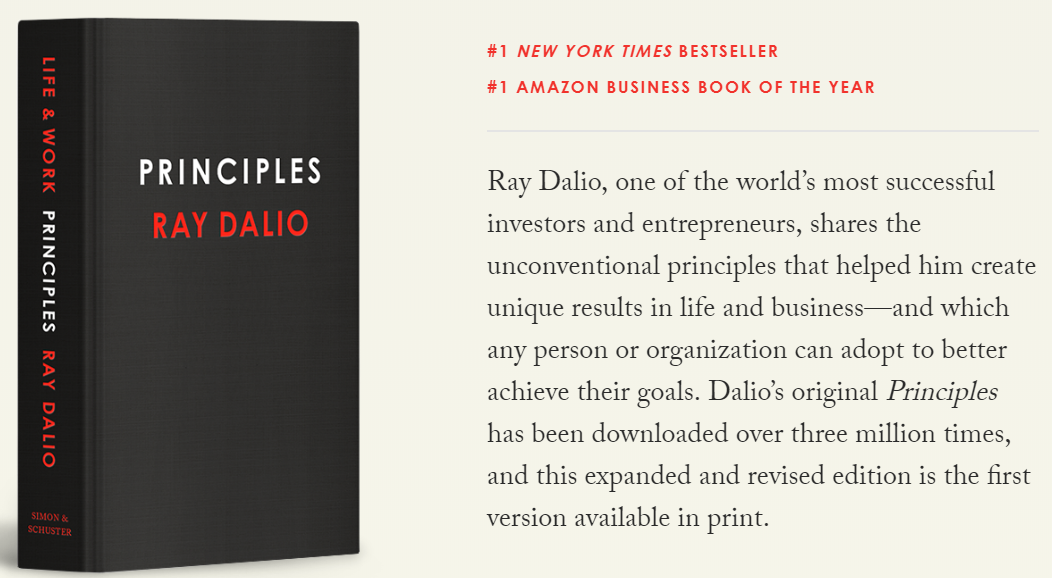
Principles by Ray Dalio
How To Use The 7 Step BSPF: A Customer Churn Example
Let’s go through an example: Customer Churn!
Problem: Customers Are Leaving
Customer churn refers to the act of customers leaving. These could be subscribers to a software or service or physically customers that shop at a store but elect to go somewhere else. Customer churn is a big problem. Often it goes undiagnosed because, individually, customers can be small, but when aggregated the effect of churn can be LARGE.
A good rule of thumb is that we only want to focus onproblems that are $1,000,000 annually or more. The higher the cost, the more important it is to solve it. And, the easier it will be to save the organization money (so they can get a return on investment from the project).
Step 1: View The Business As A Machine
The first step is viewing the business as a machine. This involves:
- Isolating business units
- Defining objectives
- Collecting outcomes
This involves breaking the business into internal parts (Sales, Manufacturing, Accounting, etc) and external parts (customers, suppliers) visualizing the connections.
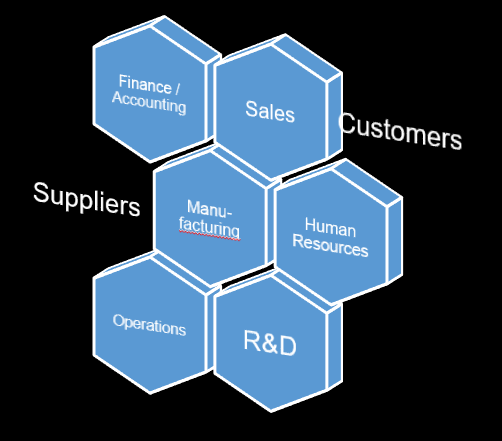
Segmenting the business into components of the machine
We then need to visualize this interaction as a machine. The machine has goals and outcomes. The goals relate to business objectives. The outcomes are what actually happens. The machine has inner workings, which are driven by people and processes. The process defines the setup, and the people execute the plan.
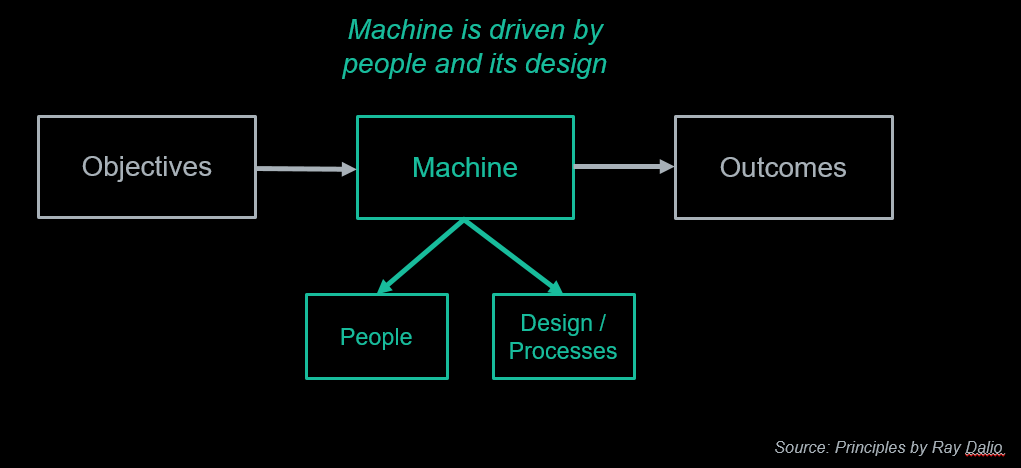
Visualizing The Business As A Machine
For the example customer churn problem, we make the following assessment:
- Isolating business units: The interaction occurs between Sales and the Customer
- Defining objectives: Make customers happy
- Collecting outcomes: We are slowly losing customers. It’s lowering revenue for the organization $500K per year.
A key in aspect in this stage is understanding the size of the problem. If we are slowly losing customers, how is this impacting revenue? Is the problem a $100 problem, a $100,000 problem, or a $1,000,000 problem? If it’s less than $100K, it may not be worth your time. Further, if it’s over $1M, executives need to know this. Get them involved quickly!
Step 2: Understand The Drivers
Next, we begin the process of understanding the drivers. The key steps are:
- Investigate if objectives are being met
- Synthesize outcomes
- Hypothesize drivers
The key in this step is starting with the business objectives: Customer Satisfaction. When customers are happy, they keep coming back. Loss of customers generally indicates low satisfaction. This could be related to availability of products, poor customer service, or competition offering lower prices and/or better service or quality.
We need to synthesize outcomes. In our hypothetical example, customers are leaving for a competitor. In speaking with Sales, several customers have stated “Competition has faster delivery”. This is an indicator that lead time, or the ability to quickly service customers, is not competitive.
The final step is to hypothesize drivers. At this stage, it’s critical to meet with subject-matter experts (SMEs). These are people in the organization that are close to process and customers. We need to understand what are the potential drivers of lead time. Form a general equation that they help create.
\[LeadTime = f(SupplierDelivery, InventoryAvailability, Personnel, SchedulingProcess, ...)\]
Developing a hypothesis with Subject Matter Experts (SMEs)
For the example customer churn problem, we make the following assessment:
- Investigate if objectives are being met: No, customers are unhappy
- Synthesize outcomes: Competitor has a faster lead time
- Hypothesize drivers: Lead time is related to supplier delivery, inventory availability, personnel, and the scheduling process
A key in this stage is communication. As a data scientist, we know the tools really well. But, tools are only useful when we understand the drivers and the business problem fully. We need to educate ourselves by listening to SMEs.
Step 3: Measure Drivers
Now we begin the process of measuring the drivers. The key steps are:
- Collect Data
- Develop KPIs
First, we need to collect data related to the high level drivers. This data could be stored in databases or it may need to be collected. We could collect competitor data, supplier data, sales data (Enterprise Resource Planning or ERP data), personnel data, and more.
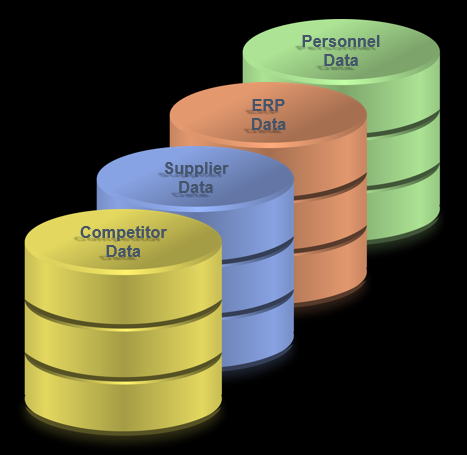
Collecting Data From Internal and External Sources
After the data is collected, we need to develop key performance indicators (KPIs), which are quantifiable measures that the organization uses to gauge performance. For our customer churn example,
- Average Lead Time: The level is 2-weeks, which is based on customer feedback on competitors.
- Supplier Average Lead Time: The level is 3 weeks, which is based on feedback related to our competitor’s suppliers.
- Inventory Availability Percentage: The level of 90% is related based on where customers are experiencing unmet demand. This data comes from the ERP data comparing sale requests to product availability.
- Personnel Turnover: The level of 15% is based on the industry averages.
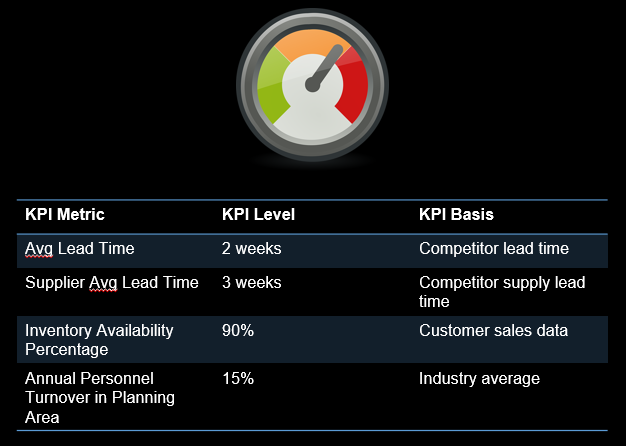
Developing Key Performance Indicators (KPIs)
Two key points in this step:
- Collecting data takes time, but don’t let it stop you. It may require effort to set up processes to collect it, but developing strategic data sources becomes a competitive advantage over time.
- Notice that KPIs requires knowledge of customers and industry for supplier, inventory, and turnover metrics. Realize that a wealth of data is available outside of your organization. Learn where this data resides, and it becomes a tremendous asset.
Step 4: Uncover Problems And Opportunities
It’s time to uncover problems and opportunities. We need to:
- Evaluate performance vs KPIs
- Highlight potential problem areas
- Review the our project for what could have been missed
For our Customer Satisfaction example, we review the results from organizational findings against the KPIs to determine where the problem areas may exist. We extended the KPI table to include an Actual Value and Conclusion vs the KPI Level:
- Our average lead time is 6 weeks compared to the competitor average lead time of 2 weeks, which is the first order cause for the customer churn
- Our supplier average lead time is on par with our competitor’s, which does not necessitate a concern.
- Our inventory percentage availability is 80%, which is too low to maintain a high customer satisfaction level. This could be a reason that churn is increasing.
- Our personnel turnover in key areas is zero over the past 12 months, so no cause for concern.
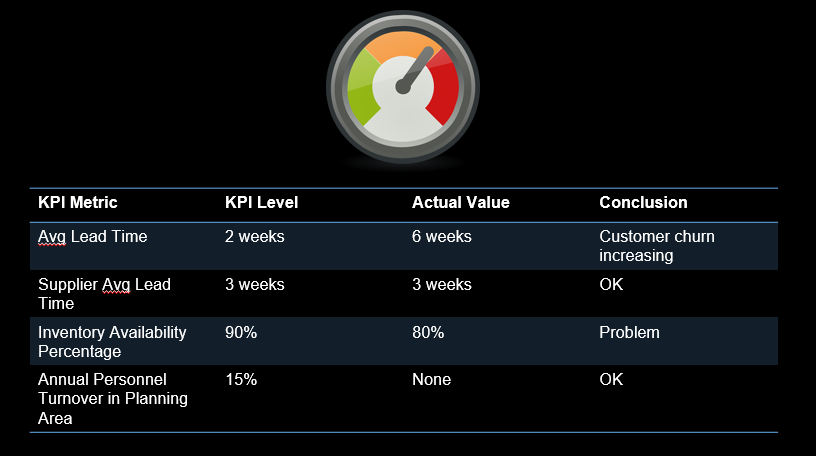
Performance Vs KPIs
It’s a good time at this spot to read a quote from Thomas Edison:
“When you have exhausted all possibilities, remember this - you haven’t”
~ Thomas Edison
Remember to ask questions and constantly test your assumptions. Talk with SME’s to make sure they agree with your findings so far.
Step 5: Encode Decision Making Algorithms
The key parts in this step are:
- Develop algorithms to predict and explain the problem
- Optimize decisions to maximize profit
- Use recommendation algorithms to improve decision making
First, develop algorithms using advanced tools like H2O Automated Machine Learning and LIME for black-box model explanations.
- H2O is a great option because of Automated Machine Learning (AutoML), which I teach in Data Science For Business Part 2, part of my 5-Course R-Track System. Automated machine learning is fast and develops highly accurate models, saving the data scientist time.
- LIME is used to explain deep learning, random forest, and stacked ensembles, which are traditionally unexplainable. We also teach LIME as part of Data Science For Business Part 2.
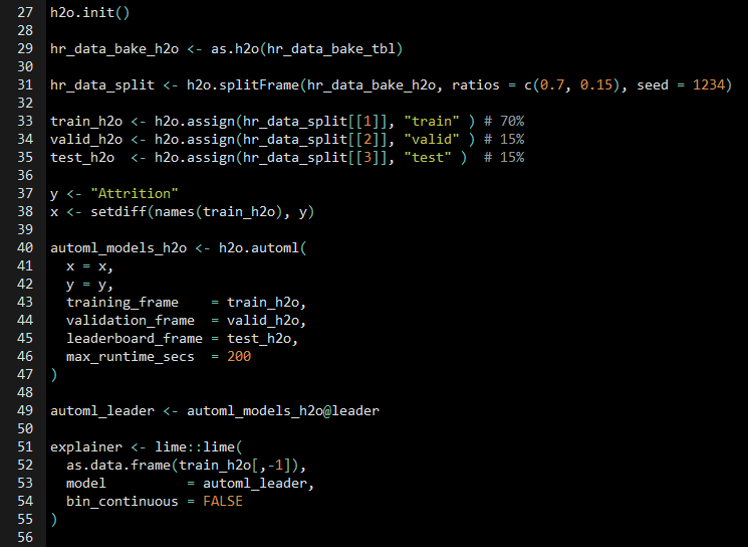
Sample H2O + LIME Algorithm, Taught in DS4B 201
Next, optimize decision selections to maximize profit. Investigate threshold optimization for binary classification problems. Also, try sensitivity analysis to gauge which features have the largest effect on the profitability of the decisions.
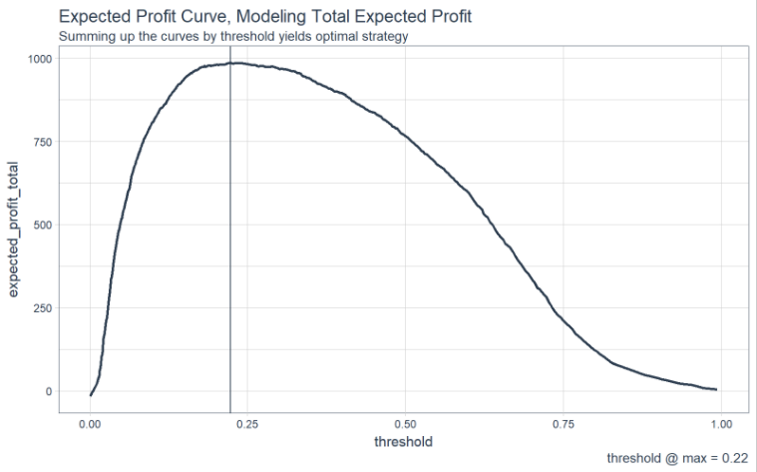
Sample Threshold Optimization Visualization, Taught in DS4B 201
Last, build recommendation algorithms that incorporate feedback from SME’s along with the feature explanations from LIME (or similar feature explanation procedures).
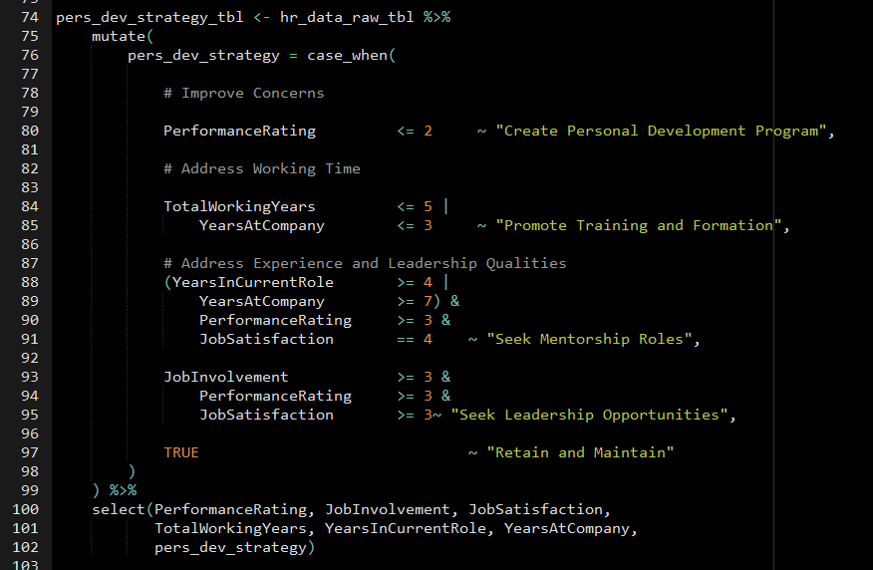
Sample Recommendation Algorithm, Taught in DS4B 201
Once a systematic decision making algorithm is developed, it’s time to deploy into the wild and measure results. Here’s an example of a web application built with Shiny that deploys our machine learning model in an application that organizations can use.
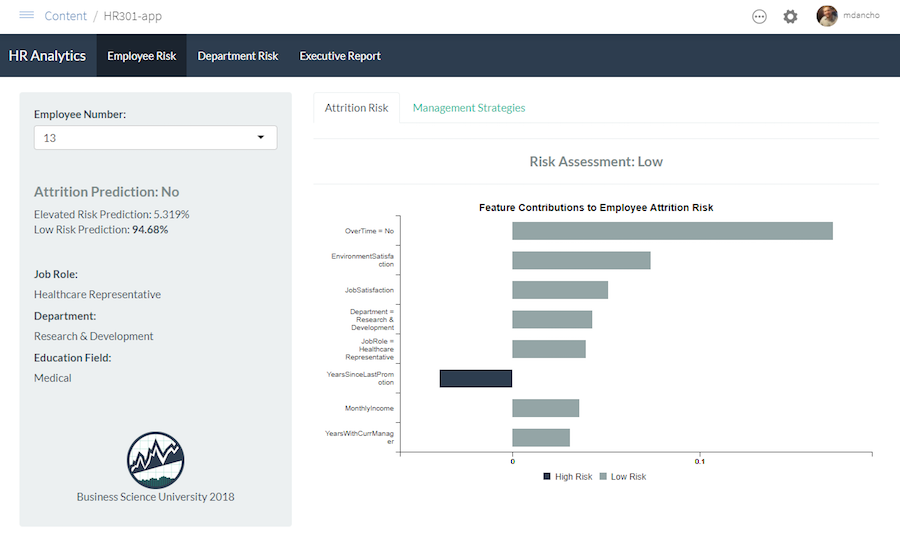
Shiny App That Predicts Attrition and Recommends Management Strategies
Step 6: Measure The Results
Once a model has been developed, evaluated, and is pushed to production (i.e. deployed), it’s time to measure the results. This requires you to:
- Capture outcomes
- Synthesize results
- Visualize outcomes over time
Once the algorithm is implemented via a web application or other decision making tool, the results must be measured to show progress. This requires more analysis. We capture outcomes over time and synthesize results. We are looking for progress. If we have experienced good outcomes, then we need to recognize what contributed to those good outcomes.
- Were the decision makers using the tools?
- Did they follow the systematic recommendation?
- Did the model accurately predict risk?
- Were the results poor? Same questions apply.
For our Customer Satisfaction example, we can make charts like these that expose the inventory availability and customer churn rate. We are seeing the inventory rise and the customer churn go down. These are good results!
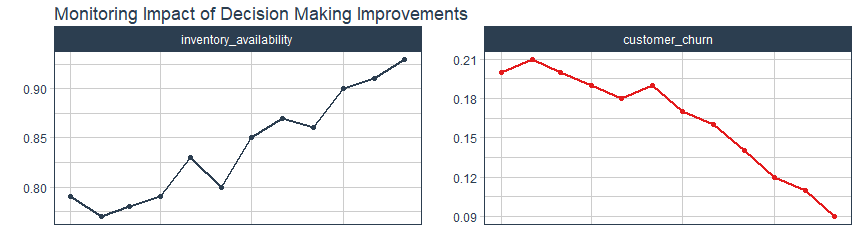
Visualizing Results Over Time
Step 7: Report Financial Impact
We’re now in the last step, report financial impact. If we’ve done good data science, implemented systematic decision making, and iterated through problems, correcting along the way, we should now see positive results. Here are the steps:
- Measure actual results
- Tie to financial benefits
- Report financial benefit to key stakeholders
Once results are understood, we need to show the results as financial benefits. This not only justifies our existence, but shows the organization that it is improving. The key here is that results must be conveyed in terms on financial impact.
It’s insufficient to say that we saved 75 employees or 75 customers. Rather, we need to say that the average cost of a lost employee or lost customer is $100,000 per year, so we just saved the organization $7.5M/year. Always report as a financial value.
Here’s an example of charts that now show the net profit and cumulative net profit over time. These are great charts to show executives, which conveys the success of the project and return on investment (ROI)!
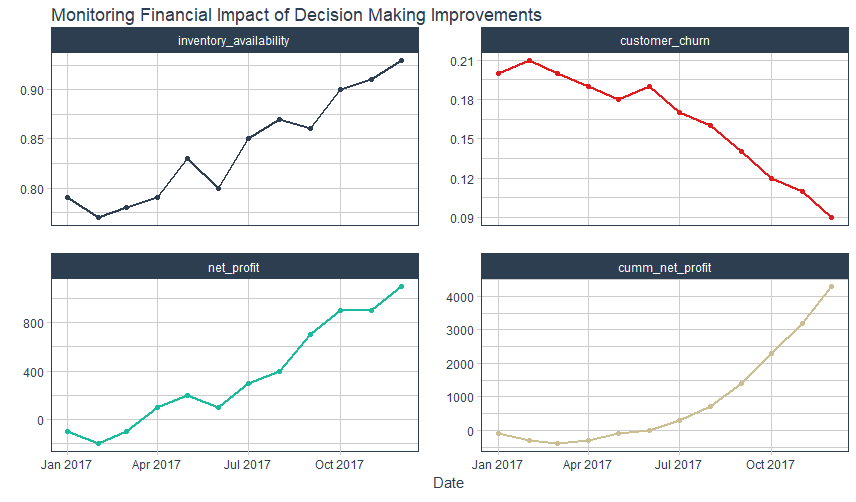
Measuring Return On Investment (ROI)
A Proven System
At Business Science, I’ve been using the BSPF in the wild with clients for some time. Clients love the BSPF because it put a clear path forward - they saw all of the steps required, where there input would be needed, and understood why the project would take several weeks to complete.
I love the BSPF because it systemized my problem-solving method, making results more repeatable. Win-Win!
We’ve recently began teaching the BSPF in our Data Science For Business Part 2 Course that is part of my 5-Course R-Track Program.
To summarize the student’s feedback in one word: AMAZING! The BSPF is one of the most loved aspects of the course because they “finally get a framework that they can follow tying data science to the business”. Here’s specifically what the two of the students have said:
“Data Science For Business Part 2 is the first course that gives me a CLEAR FRAMEWORK to apply data science to Business Intelligence!”
Renaud Liber, Business/Data Analyst, Napoleon Games NV
“I took away a repeatable methodology and project structure that can be used to solve future business problems using data science”
David Curry, CTO, Africa Talent Management
Why do the students love it? One word…
Results
At the end of the day, results are what the organization cares about. So let’s chat about a recent success story.
A recent success story is that of Rodrigo Prado. Rodrigo is a high-end data science consultant and graduate of the prestigious University of Columbia Masters of Science in Applied Analytics. While the program was very good, Rodrigo left with a knowledge gap still present not fully enabling him to connect data science to the business.
He read an article about the Business Science Problem Framework, and immediately signed up for my 5-Course R-Track Program.
Through his company, Genesis Partners, Rodrigo has since implemented the BSPF on 3 projects. According to Rodrigo, the BSPF has cut his time-to-deliver data science projects in half!
Let’s think about this for a minute. Half. That’s 50% of the time it used to take to complete a project. This means Rodrigo just doubled his efficiency. If he was generating 10X ROI as a consultant, he’s now generating 20X ROI just by implementing our BSPF framework!
If interested, you can listen to his 2-minute testimonial.
Next Steps: Imagine what earning $125,000 in 6-months from now could do for you.
How amazing would it be to know you have the financial freedom to do anything you want.
You can take a vacation.
Spend more time with family.
Have financial stability and less stress.
And this is why an investment in yourself will unlock those dreams.
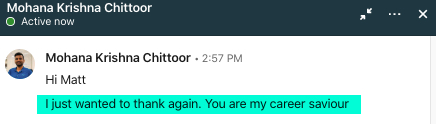
Here’s a quick story of Mohana, one of my students that earned a 94% raise in 8-months from working with me.
He’s now a Lead Data Scientist at Money View, one of India’s fastest growing start-ups.
He says, “I just want to thank you again. You are my career savior.”
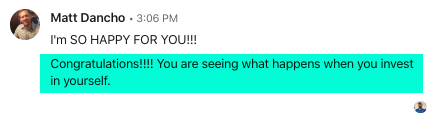
I replied, “Congratulations. You are seeing what happens when you invest in yourself.”
The same thing can happen to you.
If you are ready to learn. I’m ready to teach.
If you are ready to learn. Then, I’m ready to teach.
Here’s how.
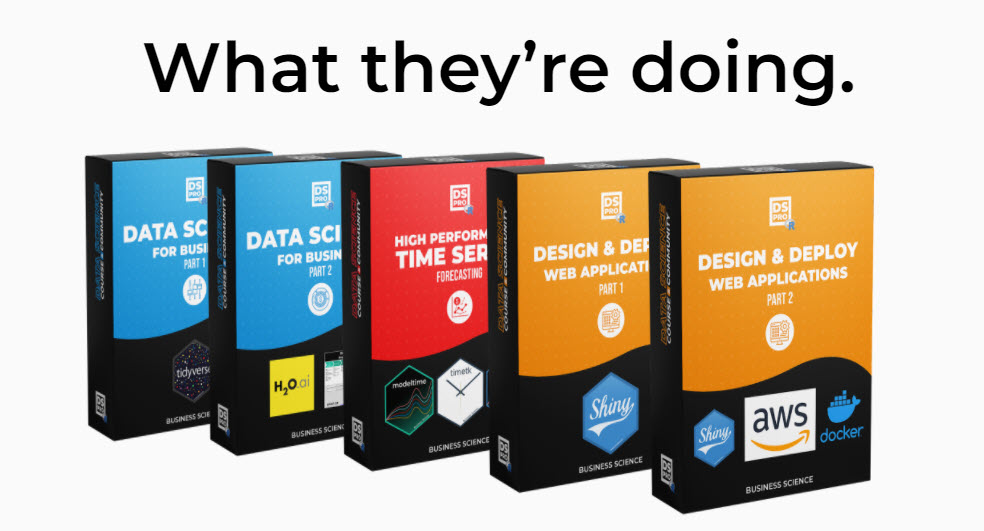
Join the 5-Course R-Track Today