tidyquant: New Tools for Performing Financial Analysis within the Tidy Ecosystem
Written by Matt Dancho
In advance of upcoming Business Science talks on tidyquant at R/Finance and EARL San Francisco, we are releasing a technical paper entitled “New Tools For Performing Financial Analysis within the ‘Tidy’ Ecosystem”. The technical paper covers an overview of the current R financial package landscape, the independent development of the “tidyverse” data science tools, and the tidyquant package that bridges the gap between the two underlying systems. Several usage cases are discussed. We encourage anyone interested in financial analysis and financial data science to check out the technical paper. We will be giving talks related to the paper at R/Finance on May 19th in Chicago and EARL on June 7th in San Francisco. If you can’t make it, I encourage you to read the technical paper and to follow us on social media to stay up on the latest Business Science news, events and information.
Technical Paper Abstract
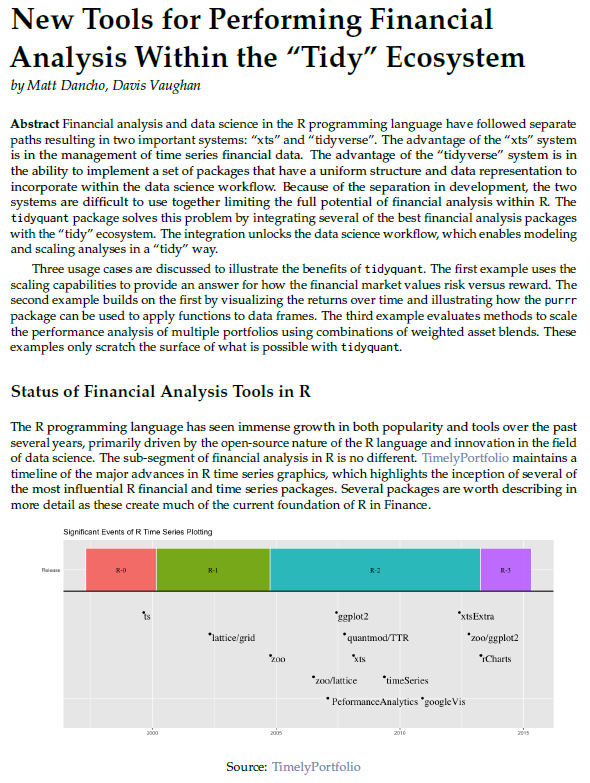
Financial analysis and data science in the R programming language have followed separate paths resulting in two important systems: “xts” and “tidyverse”. The advantage of the “xts” system is in the management of time series financial data. The advantage of the “tidyverse” system is in the ability to implement a set of packages that have a uniform structure and data representation to incorporate within the data science workflow. Because of the separation in development, the two systems are difficult to use together limiting the full potential of financial analysis within R. The tidyquant package solves this problem by integrating several of the best financial analysis packages with the “tidy” ecosystem. The integration unlocks the data science workflow, which enables modeling and scaling analyses in a “tidy” way.
Three usage cases are discussed to illustrate the benefits of tidyquant. The first example uses the scaling capabilities to provide an answer for how the financial market values risk versus reward. The second example builds on the first by visualizing the returns over time and illustrating how the purrr package can be used to apply functions to data frames. The third example evaluates methods to scale the performance analysis of multiple portfolios using combinations of weighted asset blends. These examples only scratch the surface of what is possible with tidyquant.
Download the technical paper on GitHub!
Announcements
If you’re interested in meeting with the members of Business Science, we’ll be speaking at the following upcoming conferences:
Important Links
If you are interested learning more about tidyquant: