TBS 001: The D.A.A. Method
Written by Matt Dancho
The Business Scientist Newsletter (TBS) is free to join. 90% of data scientists struggle with business. Gain a business education FOR data scientists once per month straight to your inbox:
If I wanted to make more money as a data scientist, you know who I would NOT ignore- The C-Suite.
The C-suite is YOUR ticket to getting promotions, raises, and new positions.
But, most data scientists (including me) struggle with enlisting their help, gaining their trust, and getting them to move one iota. (and this kills your career progression).
The good news is I solved that problem 10 years ago with what I’m going to teach you today.
The Story Behind D.A.A.
A long time ago in a galaxy far, far away, (back when I dreamed of having a “great corporate job”) I was working at a company called Bonney Forge.
My official title was “Sales Engineering Manager”… but I was acting as a Business Analyst while managing a small team of salespeople.
My job was to find business insights, save money, and generate more revenue.
But, I made one fatal mistake.
Every month or so, I would work with my team to find AMAZING business insights, put together a report, march into my boss’s office (the V.P. of Sales), and slam it on her desk. (And of course, I was confident she would love it.)
Being the naive, doe-eyed employee I was… I expected her to read it, be blown away immediately, and call the higher-ups & executives into a meeting about what my team had found.
In fact, every time we had a meeting, I would go on and on about my findings. I’d give speeches. I’d explain the problems I’m solving. I’d show her the benefits.
I’d tell her we need to shift our focus to this new way of making money and tell her how amazing my new “idea” is.
And you know what I would get in return?
“That sounds great Matt! We’ll get right on it.” and then crickets.
Week after week, month after month, I did this little dance. I found ways to save money, she put the report in a drawer.
I’m working 50-60 hours a week creating reports, doing analysis…
… All for my boss to do nothing with it.
So I got smart. I created a solution called: D.A.A.
It’s one of the building blocks I used to go from an unofficial Business Analyst to the Director of Sales & Marketing at Bonney Forge.
The best part? Anyone can use this to become a rockstar data scientist.
Before we dive into the solution, the “fatal mistake” I made month in and month out was that…
Companies DON’T Want Reports; They WANT Results
So every time I went into my boss’s office. She was expecting an update on how I saved the company money.
Except, what I was actually giving her was: More work.
And, that’s why nothing ever got done. So to change that, I needed to change my approach.
And it started by taking matters into my own hands.
Before stumbling onto the DAA method, I went through a lot of pain.
I’m talking about years of getting reports stuffed in drawers. And, struggling to communicate with leadership.
But, the key change was building my first business automation. (If you haven’t guessed it yet, the 2nd “A” in D.A.A. is for Automation.
Automation was the key to gaining their buy-in.
It’s because the business automation turned into…
A $15,000,000 Business Improvement.
Imagine that you are overseeing a team of 5 people. And your small group brings in on average $3,000,000 per year of revenue.
Then you make a few changes. Clean up some things. Better priortize…
…And your company now is making $15,000,000 per year.
That’s what your boss actually wants.
And that’s exactly what happened to me in 2015.
I applied the D.A.A. Method to THEIR business. And I got promoted 3 times in 2 years.
My salary went from $75,000 to $155,000 per year.
And more importantly, they started listening to me.
Now, fast forward to 2021. I duplicated my multi-million-dollar success- This time with my own business.
Here’s How I Applied D.A.A. To Build A $3,000,000 Revenue Stream (For My OWN Online Business)
I want you to know that D.A.A. is not just a one-trick poney. D.A.A. is a time-tested, successful strategy for me.
In fact, I used it most recently in 2021 to help me grow revenue from email subscribers.
Here’s how.
How Online Businesses “Work”
First, there are only 3 ways a business drives revenue:
- Acquiring New Customers
- Ascending Existing Customers
- Getting Repeat Customers To Buy Again
Acquiring new customers means someone new bought something. (Think of when you buy a new book or course. That Author just acquired you as a customer.)
Ascending an existing customer means you’re getting an old customer to spend more money with you. (usually with more expensive purchases.) (If an Author gets you to read the book and then come to a paid seminar, they’ve ascended you.)
Repeat customers means you have someone on subscription. (Think of Netflix or Hulu.)
To help, most businesses have some form of a “list”.
That’s a list of people who have either:
- Signed up for a newsletter
- Bought something
- Told the business they might be interested in buying something
Before email was around, people had customer lists in the form of OLD SCHOOL spreadsheets typed out by hand on typewriters.
These spreadsheets had their names, phone numbers, addresses, and a record of what that customer has purchased.
Now that we’re in the digital age, most companies transformed these systems into databases. (hint hint wink wink YOU should have access to these databases for analysis.)
For my company Business Science, I have a list of ~100,000 people. You would think that means I have 100,000 people ready to buy but that’s not quite the case.
Because…
Different People Are Interested In Different Things
If someone is brand new to data science, they’re going to buy beginner courses.
If someone has been a data scientist for 10 years, they’re going to buy advanced courses.
If someone is brand new to my list, they may not buy ANYTHING for months. And if they get annoyed with my emails, they’ll unsubscribe.
Because of these problems, you have to segment your company’s list based on customer information.
The easiest way to make more money is to match the right customer to the right products, also known as “customer segmentation”.
What’s great about customer segmentation and databases is we can use data science.
So in early 2021, I made a Customer Segmentation model to determine which customers I should send sales emails to.
At first, I sent sales emails to everyone and I noticed people were unsubscribing in droves. (Not good.)
When they unsubscribe, I can’t send them any more offers and revenue goes down.
Which means I was doing the OPPOSITE of acquiring new customers, I was driving them away, and driving down revenue.
On the other hand, not sending emails to the “ready-to-buy” customers resulted in a cost of about $2,000 per missed customer.
The question was, could I optimize this process to grow the business?
Well, I solved this business problem using the D.A.A. Method.
TIME FOR DATA SCIENCE
There’s a dead-simple formula that I’ve used to make my company $3,000,000+ in revenue through business process automation.
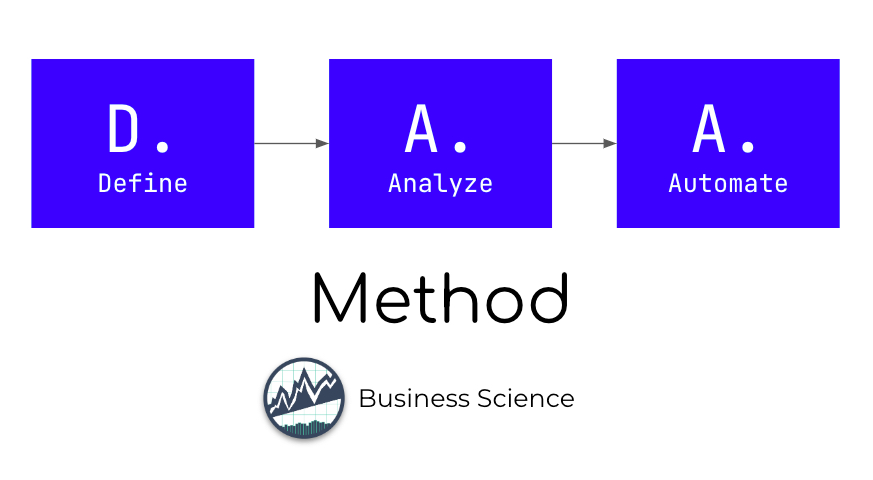
Fig.1: D.A.A. Method
It’s called the D.A.A. Method, and it stands for:
Here’s exactly how I used it to automate a business process that made $3,000,000+ in revenue for my business, Business Science.
And, I made this business automation in just 30 days.
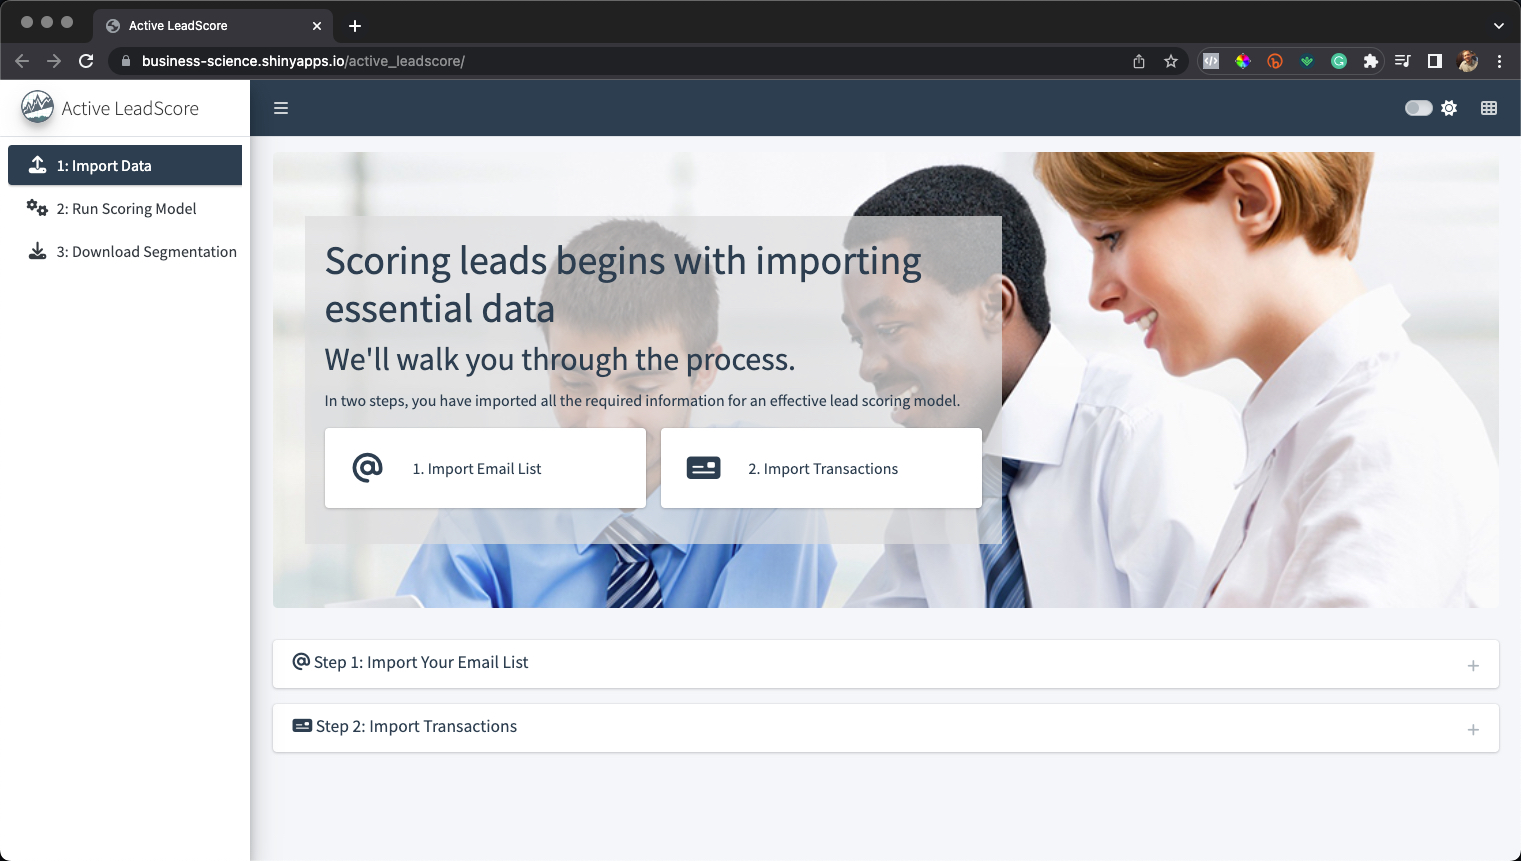
Fig.2: Lead Scoring App
You can check out a demo version of the Lead Scoring App here (the product of the D.A.A. applied to my Customer Segmentation problem).
HOW DID THIS HAPPEN?
I saw my unsubscribe rates for new subscribers were very high when exposed to a “sales email”.
I validated this by splitting the database up into groups - subscribed less than 30 days vs greater than 30 days.
Unsubscribe rates shot up in the “less than 30 days” group BUT I still got some sales from both groups.
So I couldn’t ignore the findings - Nurture vs Ready to Buy was a thing.
And then I came up with an idea. I put it on paper by defining the process to apply data science to this business problem.
Step 1: DEFINE the ideal Business Process
The first step was defining the ideal business process in terms of inputs, process steps, and outputs. This is what you think you need to solve the problem.
The process I came up with looks like this (for my particular “customer segmentation” problem).
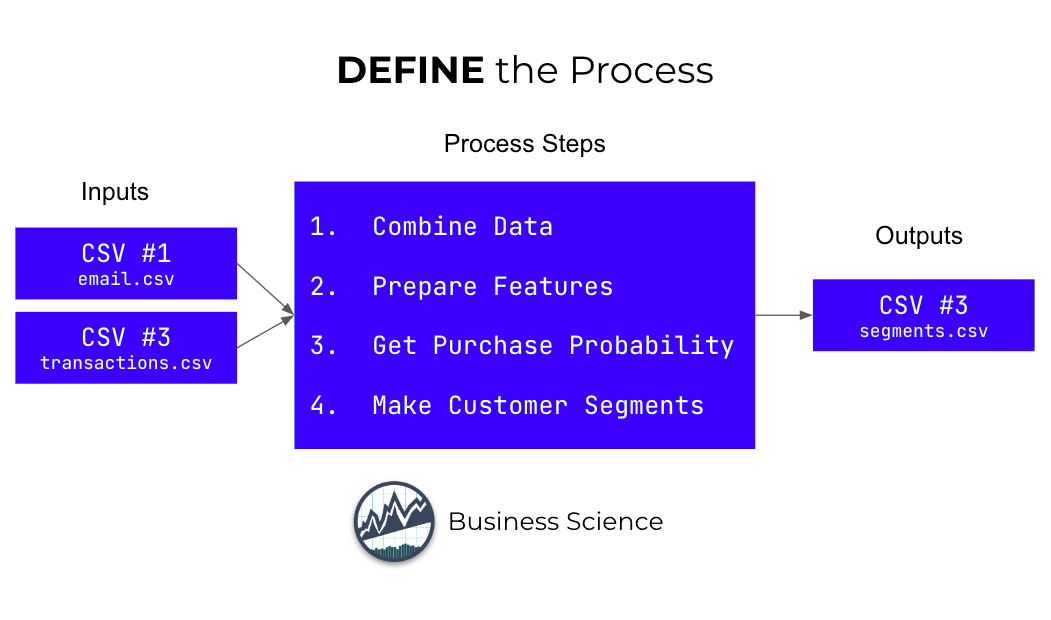
Fig. 3: Defining the Process
The inputs to the ideal process were CSV files that came from 2 databases, namely a MailChimp Email Database and a Teachable Transactions Database.
These datasets gave me:
-
Transaction history (I needed this to label who was a buyer)
-
Descriptive customer data (The email database contained behavioral data on what the customer was doing e.g. interest tags, webinars attended, email open rates, etc).
Step 1B. Process Steps (What you think you have to do)
Next, I planned out the process. The minimal processing steps I planned for were to:
-
Combine the data so I could see which students were buying and what actions they had taken (email open rates, webinar attendance, where they were located geographically, how long they had been with me, etc)
-
Prepare the features (See if I could make highly predictive features that were indicators of a sale based on user behavior)
-
Get the Purchase Probability (by running a Machine Learning Model)
-
Make Hot/Cold Segments (for email targeting)
Step 1C. Outputs (What you need to improve the process)
I needed the list of people who were ready to buy right now:
The ideal outputs would be a simple CSV file that could be uploaded to the MailChimp Email Database for segmentation.
-
Segments: All I needed were Hot/Cold segments that I could target for Sales Emails / Nurture Emails, respectively.
-
Uploading the results into the Email Database: I could then send different emails to the Hot and Cold Segments. Hot would get sales emails. Cold would get nurture emails.
Step 2: Make an ANALYSIS
Next, I made an analysis. This is where I verified that I could make something that works.
Here’s a snapshot of part of the actual solution.
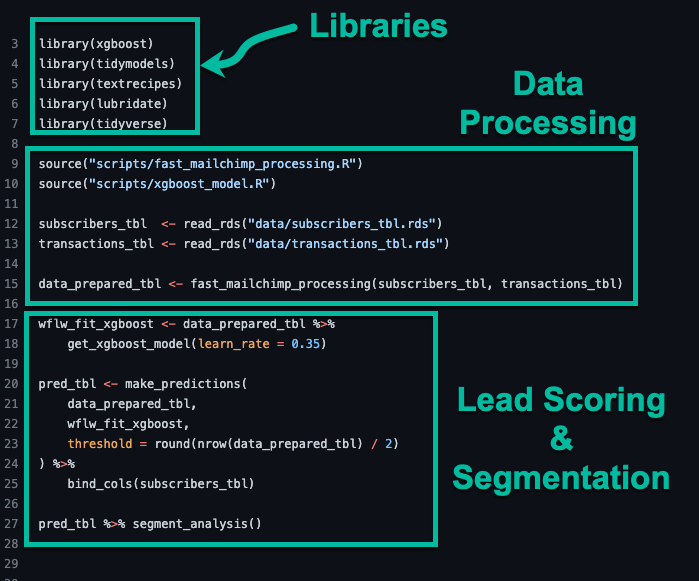
Fig. 4: Lead Scoring Analysis (analysis.R file)
I took what I knew from defining the business process and I began mocking up an analysis:
-
I used R for my analysis
-
I used tidymodels, R’s best machine learning framework, to make a single model that I could run quickly inside an application.
-
I used the tidyverse for most of the data combining and data processing.
-
I used recipes and textrecipes which helped me incorporate customer actions in a way that the machine learning algorithms could understand.
-
And I output the Lead Score as a probability of “readiness to buy”.
Step 3: AUTOMATE using an application
This part is really powerful. I used a tool called shiny to make a web application that did all of the processing, but more importantly…
The app was so easy to use…
In fact so easy, I trained my staff (aka Haley, my wife) to run the segmentation.
This saved me tons of time (and made the process repeatable).
The shiny app had 3 tabs that walked Haley through the 3 steps in the process.
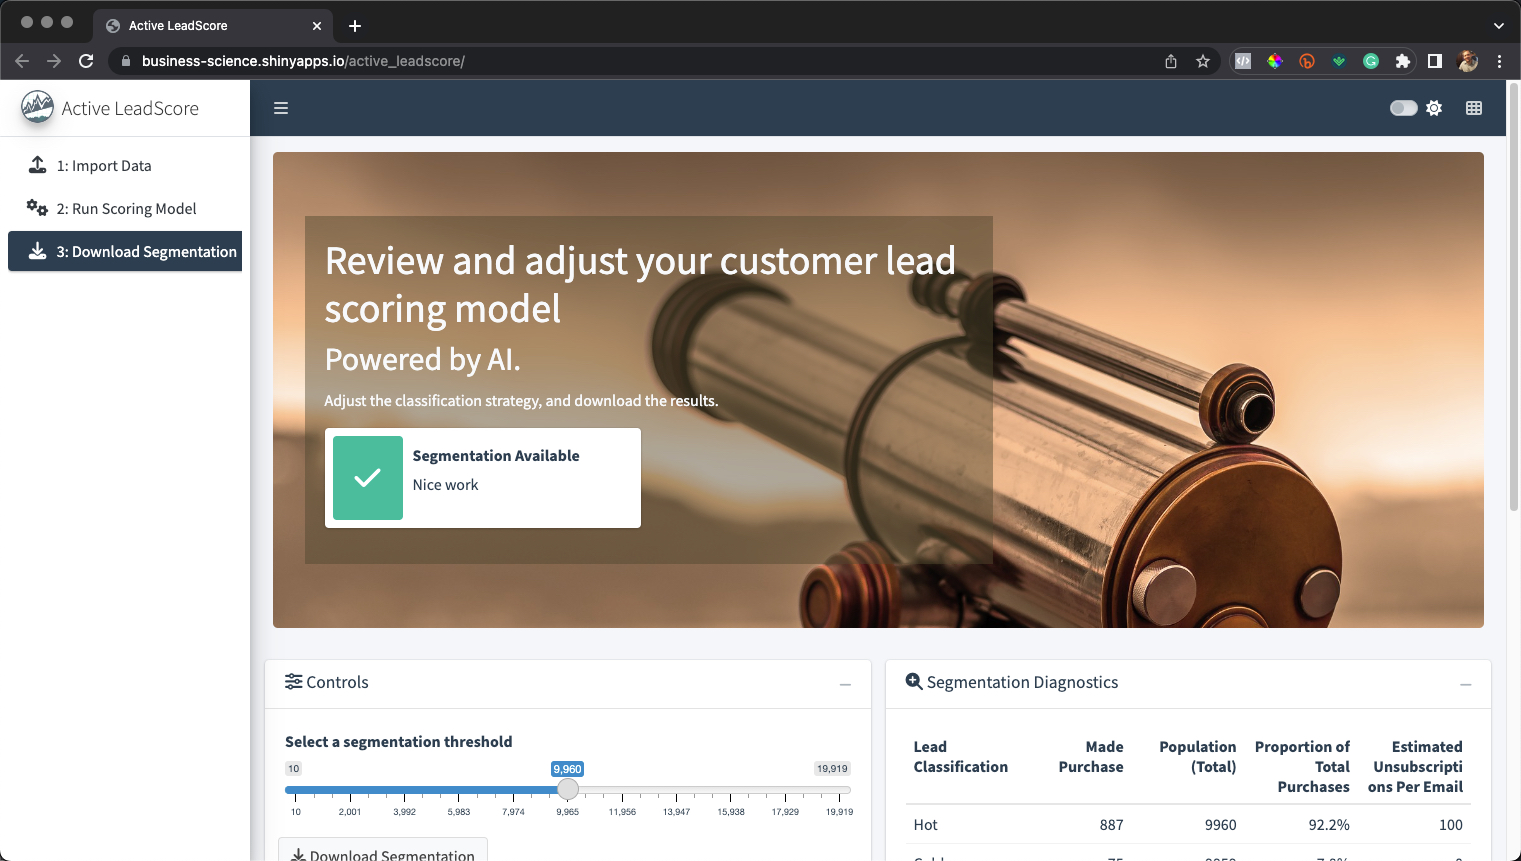
Fig. 5: The Shiny App that helped create a $3,000,000+ revenue stream
Here’s the fun part. Let me break down the 3 tabs that do the email segmentation’s “heavy lifting.”
(And you’ll see how it was so easy my wife, Haley, could crush segmentations each month with it.)
Tab 1. The “Import Data” Tab
Tab 1 imported the data from the 2 CSV files (email subscribers and transaction history).
All Haley had to do was get the data and feed into the app.
She’d grab the data first thing in the morning of a sale. Then upload them into the shiny app.
The app took care of preparing the raw data for the machine learning model.
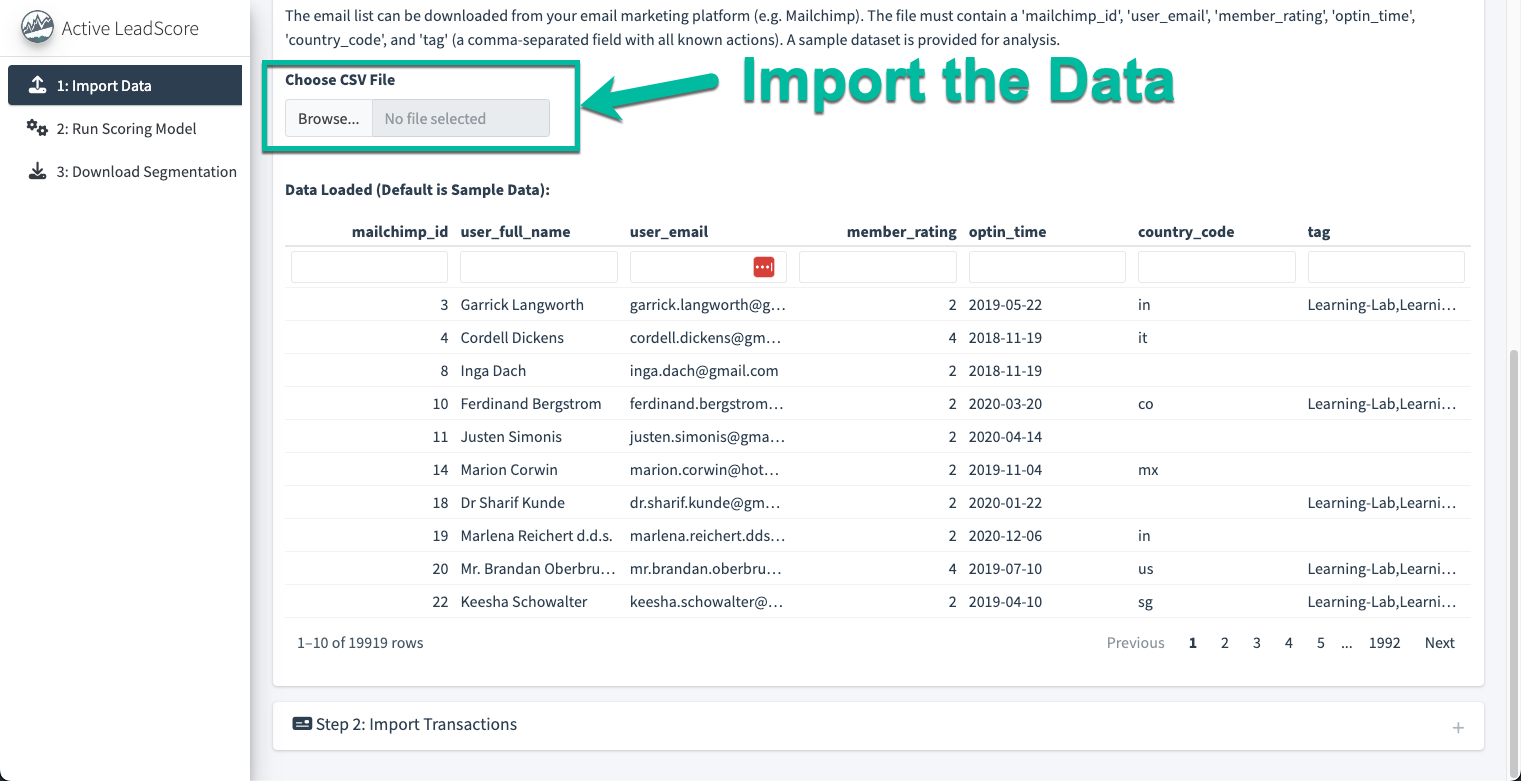
Fig. 6: Import Data Email and Transaction Data
Tab 2. “Run the Scoring Model” Tab
Tab 2 ran the lead scoring model.
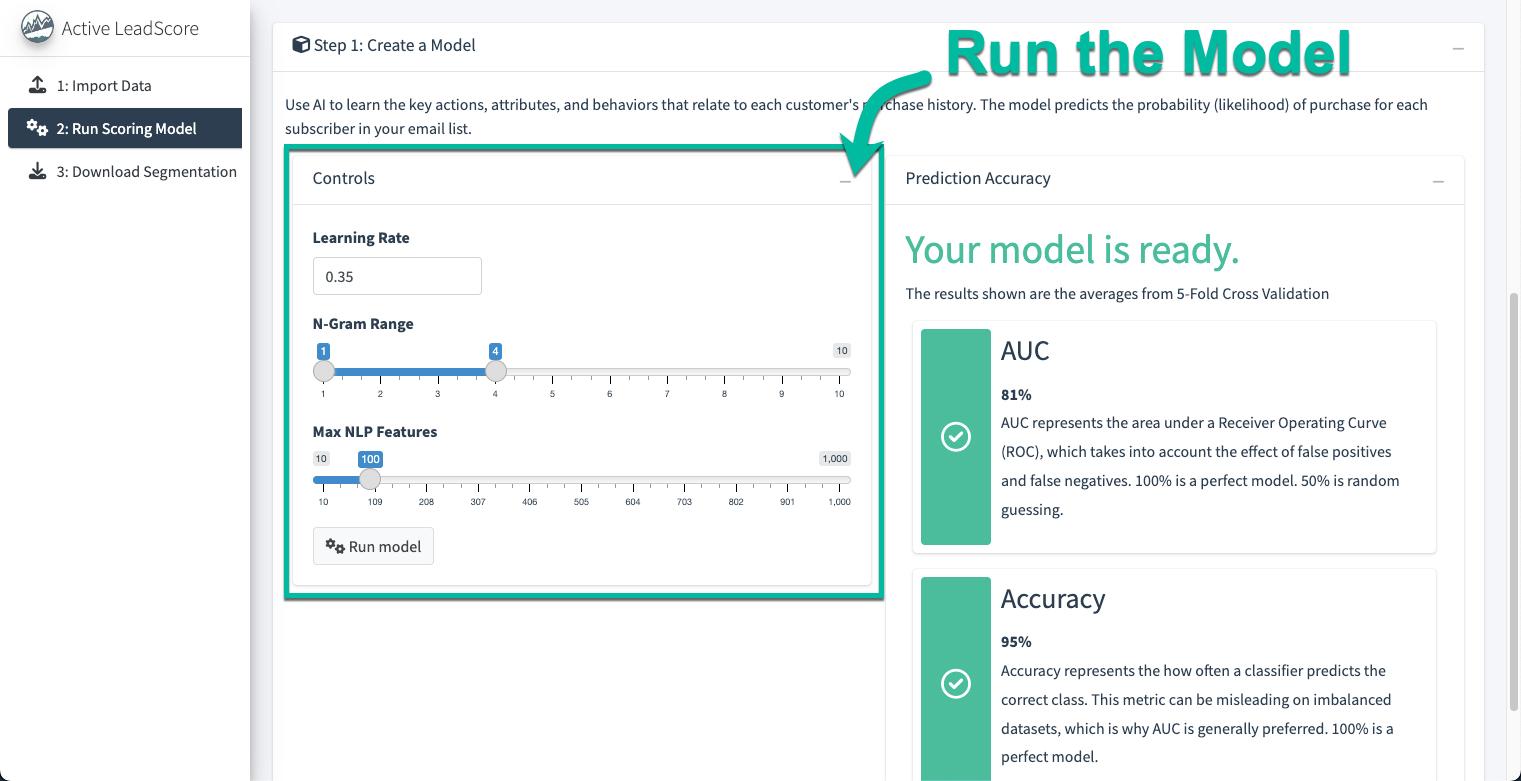
Fig. 7: Run the Lead Scoring Model
The app defaults were pretty good. This meant Haley could quickly run the default model and get an 80% to 90% AUC… Without spending hours tweaking knobs or getting frustrated because there were “too many buttons”.
I set the app up so that anything below a 0.80 AUC would trigger a RED FLAG. (Red meant bad.) If anything was RED, she would get me to figure out what happened.
But, 99% of the time she got a good model. And with a good model in hand, Haley could move on to the next step.
Tab 3. “Download the Customer Segmentation” Tab
Tab 3 produced the lead score.
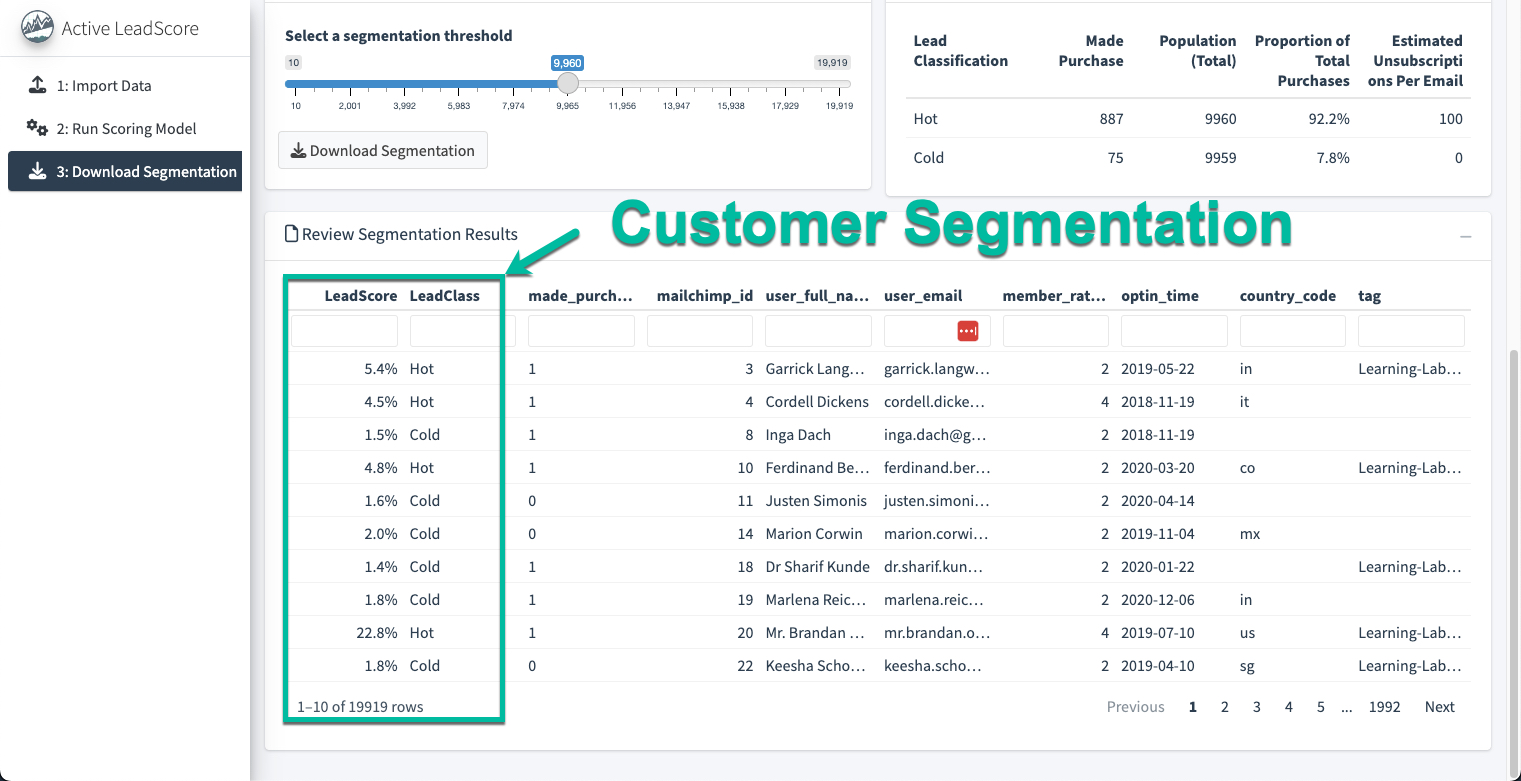
Fig. 8: Download the Customer Segmentation
It had a couple of knobs and diagnostics to “optimize” the Customer Segmentation. My goal was to get 98% of the “expected” sales.
To hit the goal, Haley would drag the slider to pick the right threshold for “Hot” and “Cold”. She could see the Customer Segmentation update, and she’d stop when “Proportion of Total Purchases” hit 98%.
Once finished, Haley clicked the download button. She would take the CSV with the segmentations, and update the Email Database. The emails would be set to go out to the 2 groups.
We just repeated this process once a month, and…
The Payoff
I implemented this system in 2021. I spent about 30 days building and refining the analysis and making the proof-of-concept shiny web application.
I then put it into production (i.e. published it internally and trained Haley how to use it) and we began using it every month.
The unsubscription rate was cut in half, and the total sales stayed at about 98% (a slight drop due to missing some buyers in the nurture group).
But this was more than made up by the growing email list.
In a given weekend now with a good offer, we are pulling in $125,000+ with a targeted sale on my R-Track Program. A healthy 4X growth over 2 years.
If you do something similar for YOUR employer, you’ll make them more money than they know what to do with.
And if you want to learn how to put things into production, (and make you and your company fistfuls of cash) you should check out my 5-Course R Track.
That’s it for today. See you again on the 1st of next month.
The Greatest Data Science For Business Instructor in the World,
Matt Dancho
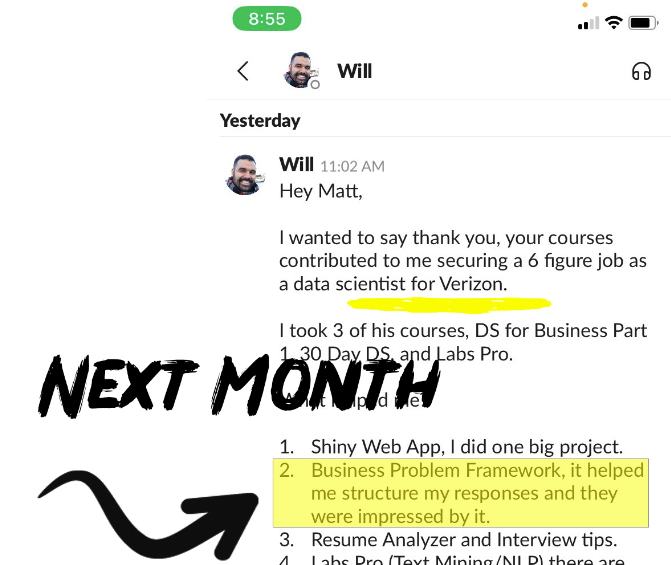
P.S. Next month I’m going to show you the most powerful framework I and my other students use to get jobs like it’s nothing.
It’s called: The BSPF. And it does this:
This is how I can help:
-
Learn what’s ahead of you. Read my 155-page E-Book, “Everything You Should Already Know About Data Science”. I wrote this to uncover the mystery behind data science (and help people understand what businesses really want.)
-
Become a Business Data Scientist with my 5-Course R-Track. This program gets insane results like $100,000+ data science careers, +50% pay raises, Senior VP promotions, Lead Data Scientist (and more.) Don’t believe me? Check out my testimonials here. Want a taste of my program? Try my Jumpstart 2.0 - It’s the first week of my training program.
Want to find out what I did to solve more business problems with data science?
(and discover how to run circles around other data scientists, ethically steal promotions, raises and job titles from your more experienced coworkers, and make millions for your company in the process.)