Shockingly-fast data manipulation in R with polars
Written by Matt Dancho
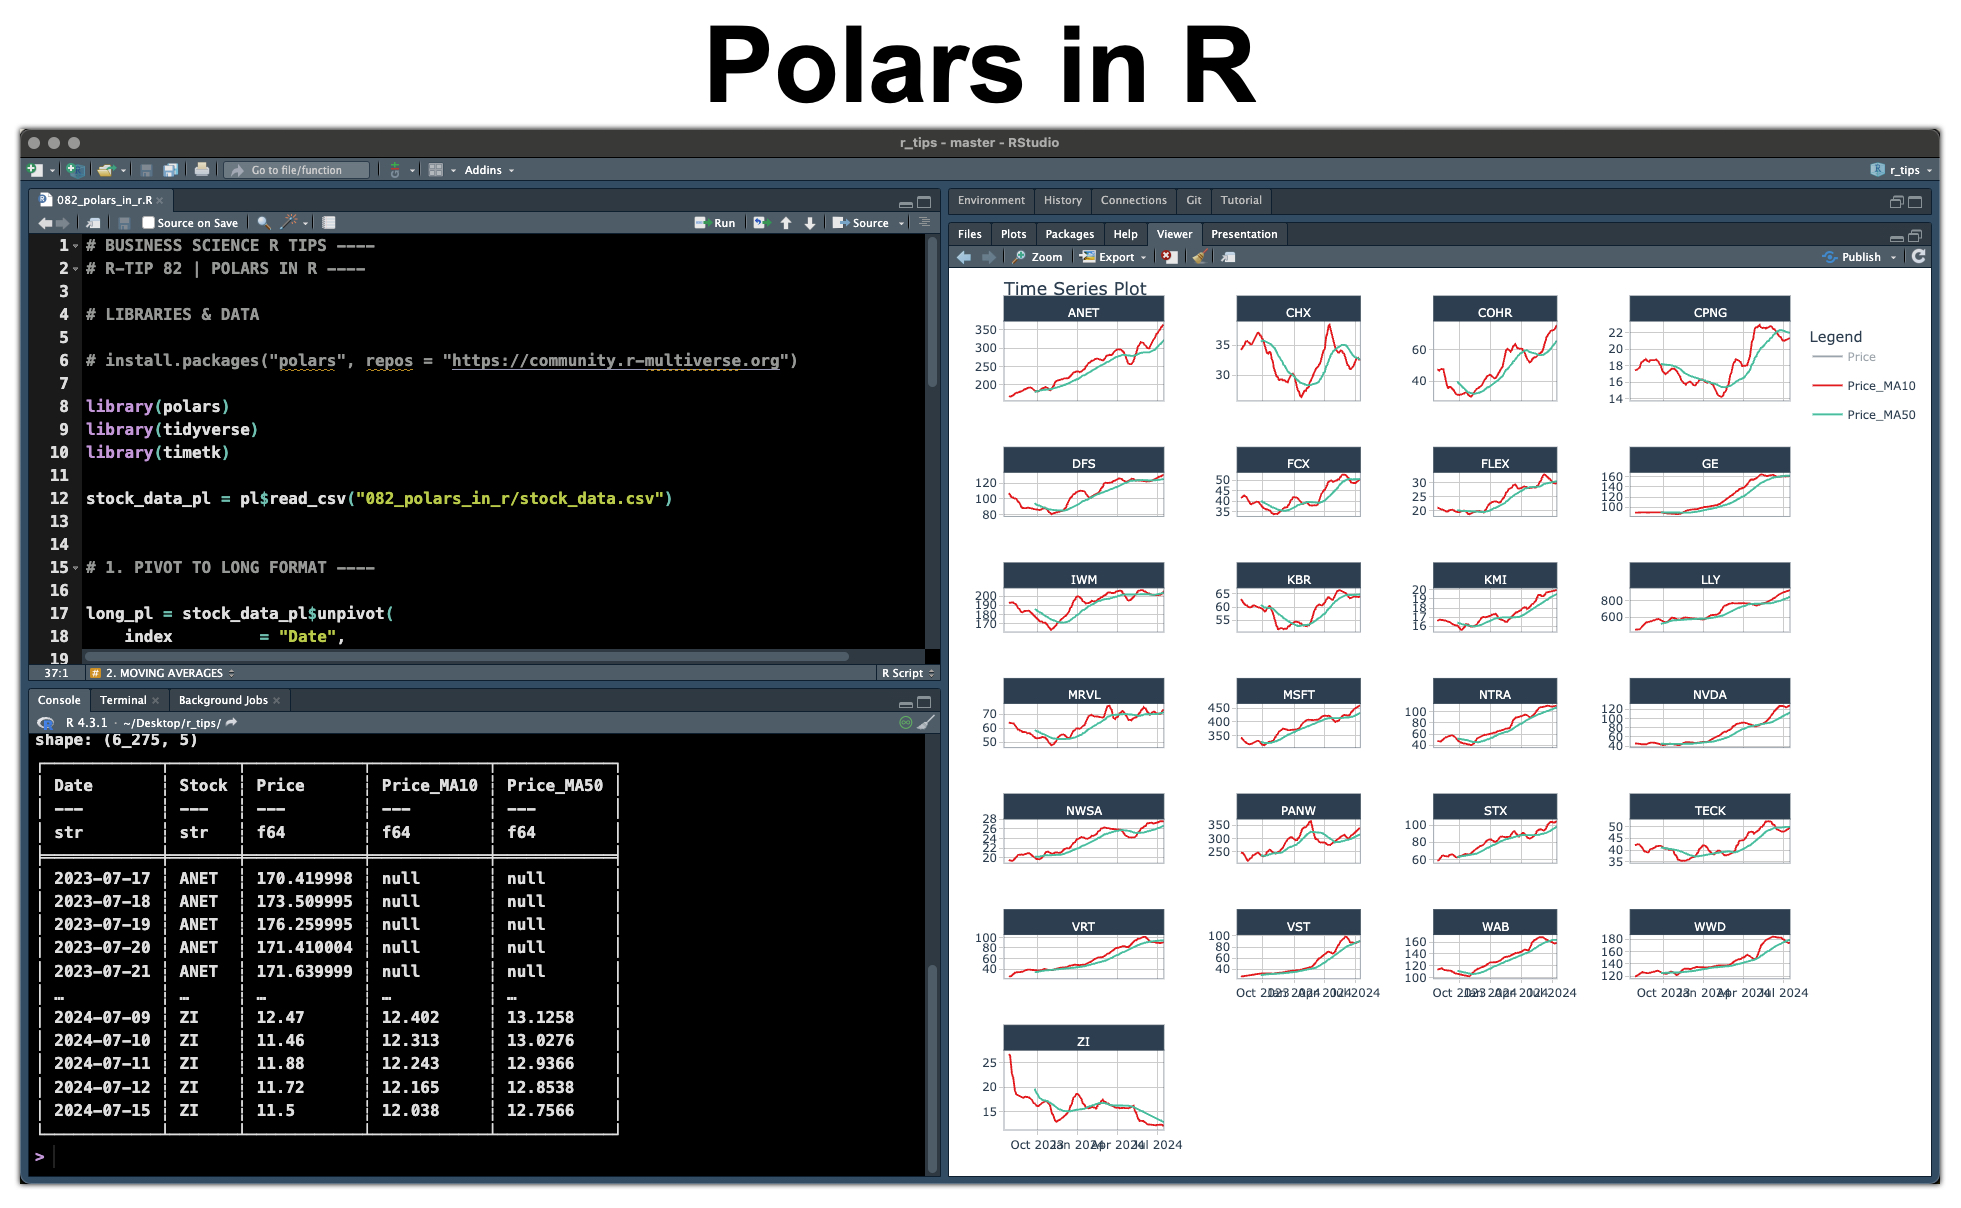
Hey guys, welcome back to my R-tips newsletter. Polars is NOW available in R! Yes– The shockinlgy-fast data manipulation library built on top of Rust is now in R. Today, I’m excited to show off some of Polar’s capabilities for fast financial and time series analysis. Let’s go!
Table of Contents
Here’s what you’re learning today:
- What is polars? You’ll discover what
polars is and how it accomplishes shockingly-fast data manipulation
- Benefits of using Polars Which types of data analysis can benefit from
polars the most.
- How to use Polars inside of R I have prepared a full R code tutorial (get the code here).

Get the Code (In the R-Tip 082 Folder)
SPECIAL ANNOUNCEMENT: AI for Data Scientists Workshop on December 18th
Inside the workshop I’ll share how I built a SQL-Writing Business Intelligence Agent with Generative AI:
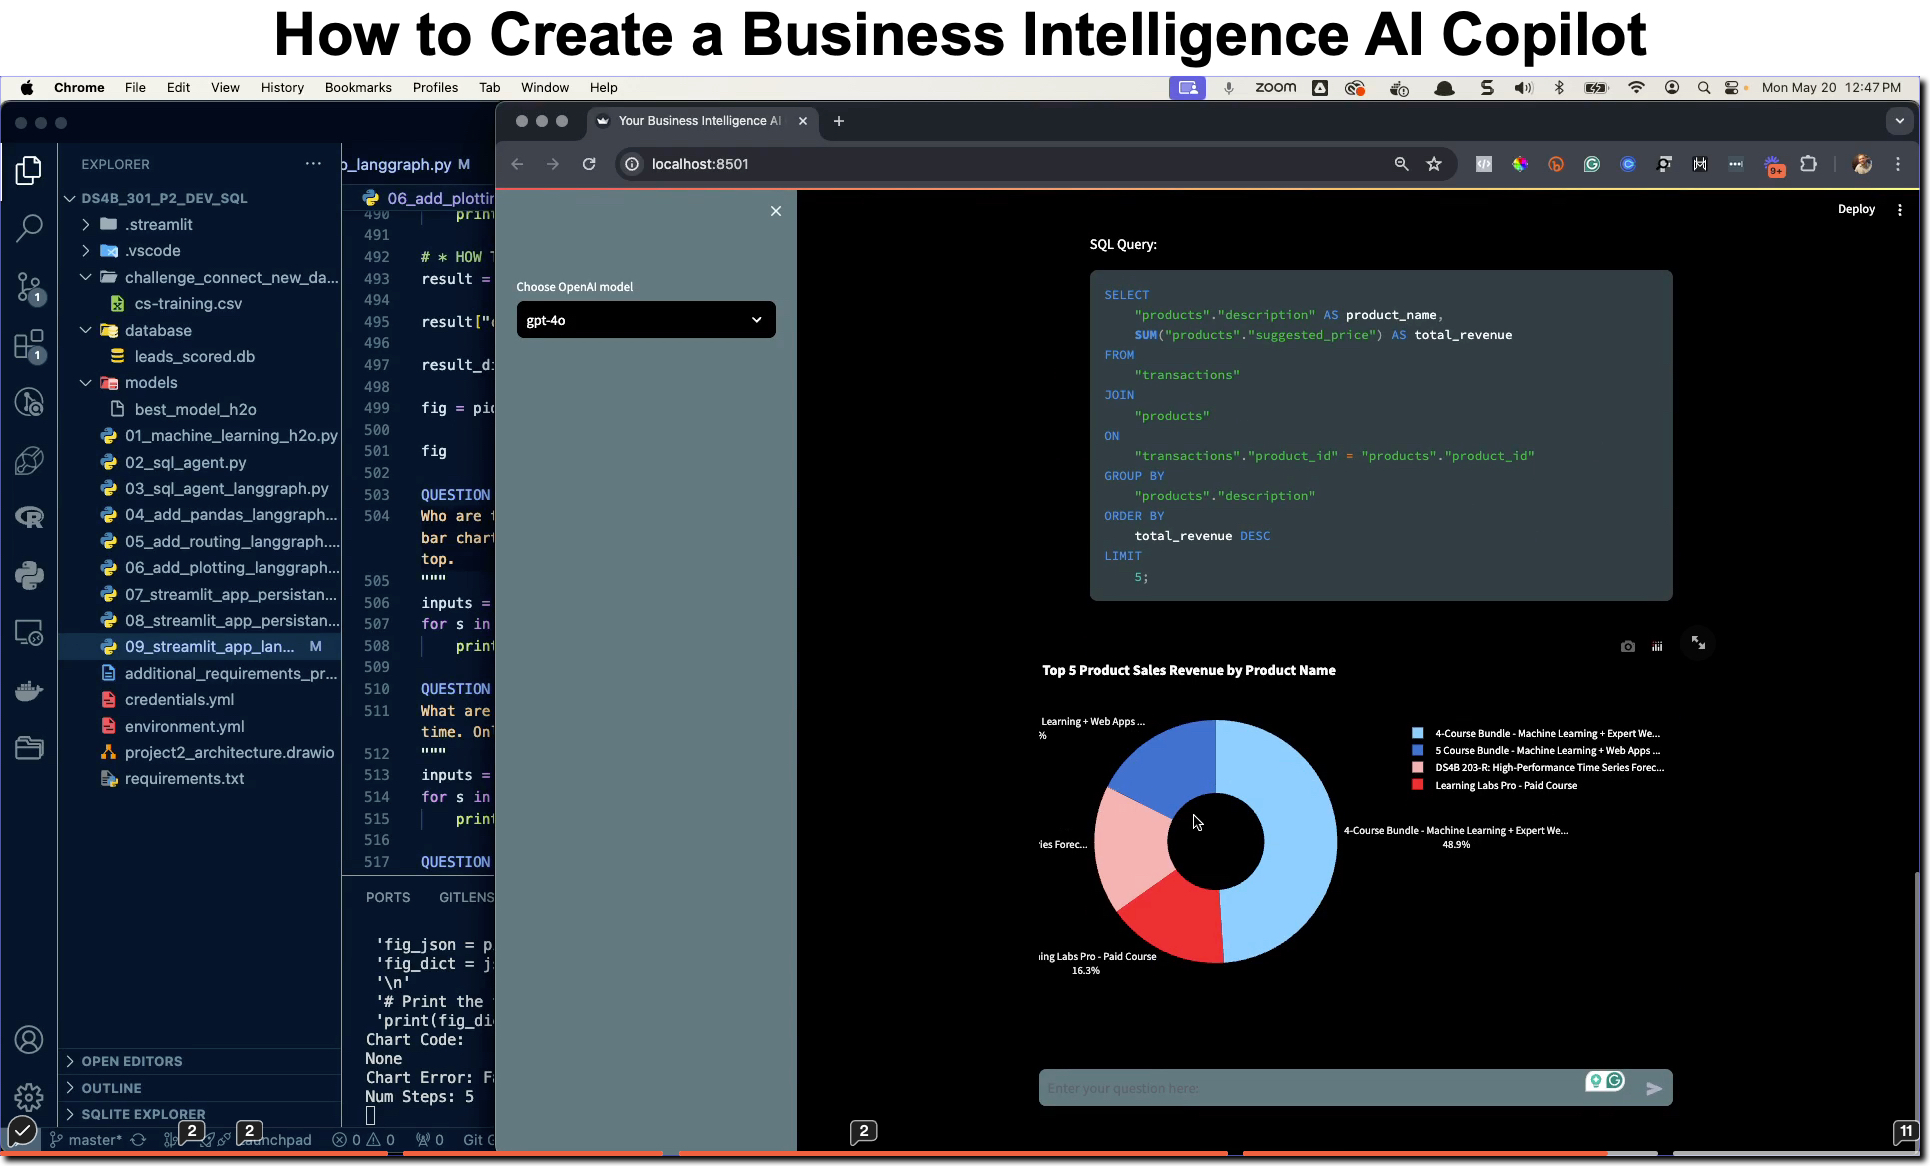
What: GenAI for Data Scientists
When: Wednesday December 18th, 2pm EST
How It Will Help You: Whether you are new to data science or are an expert, Generative AI is changing the game. There’s a ton of hype. But how can Generative AI actually help you become a better data scientist and help you stand out in your career? I’ll show you inside my free Generative AI for Data Scientists workshop.
Price: Does Free sound good?
How To Join: 👉 Register Here
R-Tips Weekly
This article is part of R-Tips Weekly, a weekly video tutorial that shows you step-by-step how to do common R coding tasks. Pretty cool, right?
Here are the links to get set up. 👇
This Tutorial is Available in Video (9-minutes)
I have a 9-minute video that walks you through setting up polars in R and running your first financial time series data analysis. 👇
What is Polars?
According to the polars documentation:
The polars package for R gives users access to a lightning fast Data Frame library written in Rust. Polars’ embarrassingly parallel execution, cache efficient algorithms and expressive API makes it perfect for efficient data wrangling, data pipelines, snappy APIs, and much more besides. Polars also supports “streaming mode” for out-of-memory operations. This allows users to analyze datasets many times larger than RAM.
Lightning-Fast Data Frame Library Written in Rust
The key here is that, under the hood, both the R and Python implementations of polars use the hyper-scalable and blazingly fast Rust library. Key aspects of Rust include:
-
Memory Safety: Rust ensures memory safety without needing a garbage collector. This is achieved through its ownership system, which enforces strict rules on how memory is managed.
-
Concurrency: Rust is designed to make it easy to write concurrent programs. The language’s ownership system helps prevent data races, which are a common problem in concurrent programming.
-
Zero-cost Abstractions: Rust aims to provide high-level abstractions without the cost typically associated with them in terms of performance. This allows developers to write efficient code without sacrificing readability.
-
Performance: Rust’s performance is comparable to C and C++ due to its focus on low-level control over system resources.
-
Tooling: Rust comes with a powerful set of tools, including cargo (the package manager and build system), rustc (the Rust compiler), and rustfmt (a code formatting tool).
Rust in a Nutshell
Rust is fast. It’s design is focused on parallel processing. And because of that polars is fast, parallel, lazy (in a good way), and really good for most data operations.
Which Data Manipulations is Polars Good For?
I’ve been testing out polars for quite a while in both Python and R.
For background, as of a year ago I began work on pytimetk, which replicates many of the R timetk packages time series analysis features in Python. And for that project, our team has internally used a polars engine for many time series operations that are known to be resource intense.
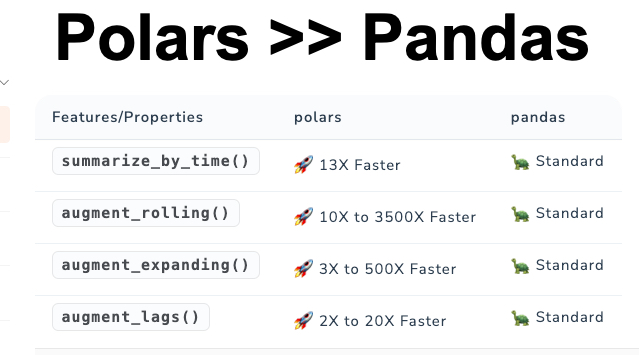
We’ve published our performance results here.
-
Rolling Operations: Polars can be 10X to 3500X faster than Pandas
-
Expanding Operations: 3X to 500X Faster
-
Aggregations (Summarizations): 13X Faster
The bottomline is that Polars is fast vs Pandas. It’s especially good for grouped time series operations including rolling, expanding, and aggregating operations.
I expect Polars in R to be faster than dplyr. However, I have not run similar tests (yet).
Tutorial: How to use Polars inside of R
It takes about 30 seconds to get polars set up so you can start using shockingly-fast data manipulation inside of R. All the tutorial code shown is available in the R-Tips Newsletter folder for R-Tip 082.
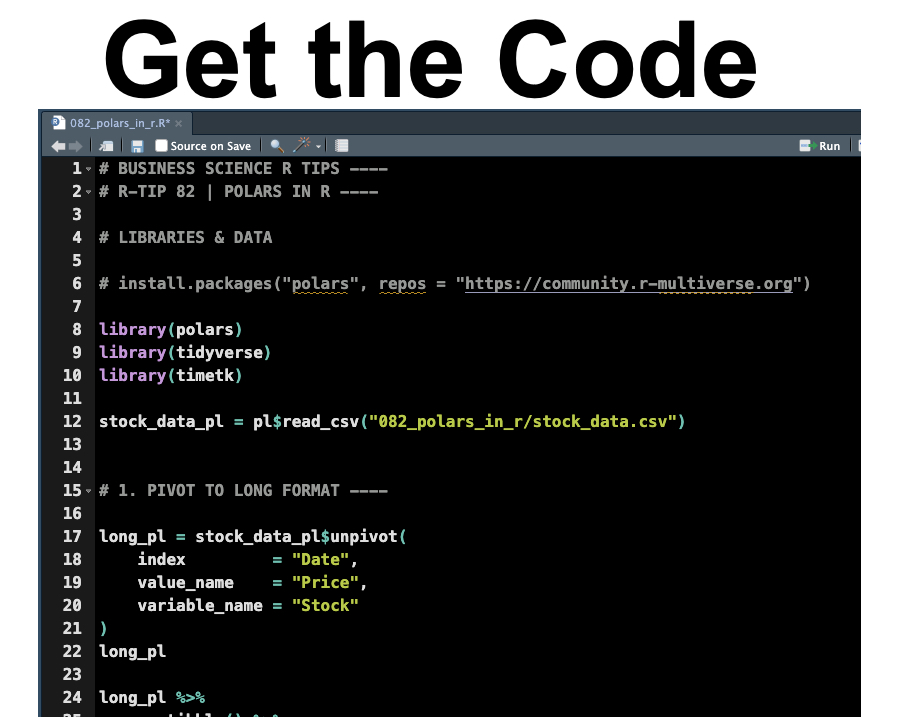
Get the Code (In the R-Tip 082 Folder)
Step 1 - Install polars:
The first step is to set up polars. Polars is not on CRAN as of the writing of this article. But it’s simple to install from the r-multiverse.org team.
Run this line of code:
install.packages("polars", repos = "https://community.r-multiverse.org")
Step 2 - Load the Libraries and Data
Once polars is installed, load the libraries and data witht his code.
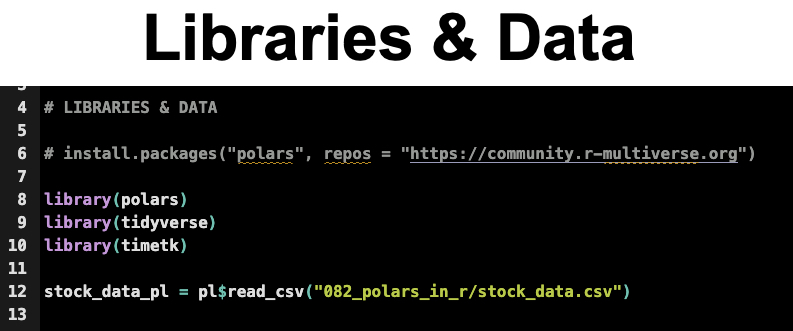
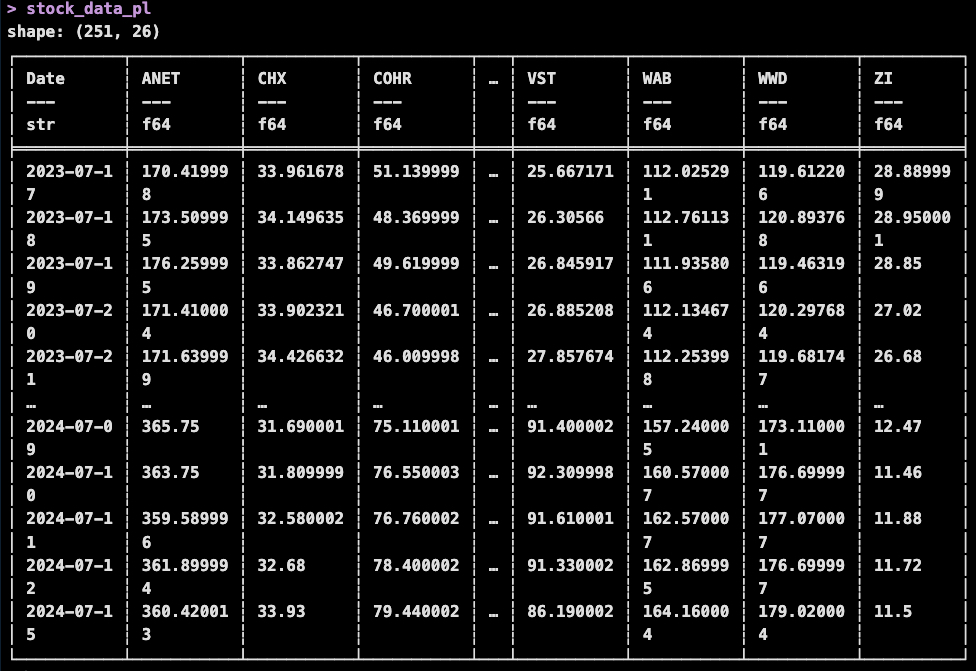
Here’s the stock_data.csv once it’s read with pl$read_csv(). A few key points about the Polars Data Frame Structure:
- Shape of the data is shown at the top.
- Some columns and rows will not be shown when printed to the screen(identifed with …)
- The “Date” column is a
str data type
- The stocks (25 total) are
f64 data type (float 64)
Get the Code (In the R-Tip 082 Folder)
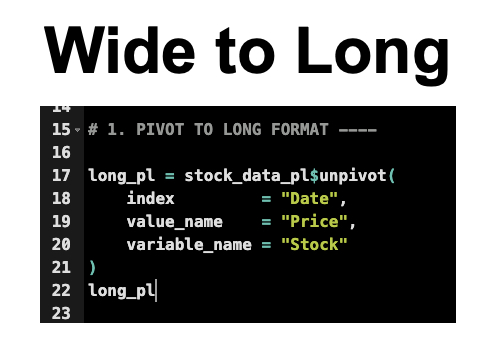
The next step is to get the data into a format so we can begin to do grouped analysis. Use the unpivot() function to go from wide-to-long format:
Get the Code (In the R-Tip 082 Folder)
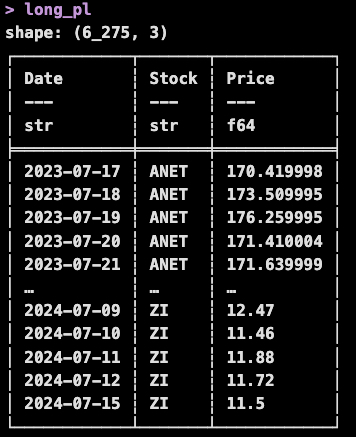
The transformation was done shockingly-fast. This is what the long format looks like:
To visualize the data, run this code:
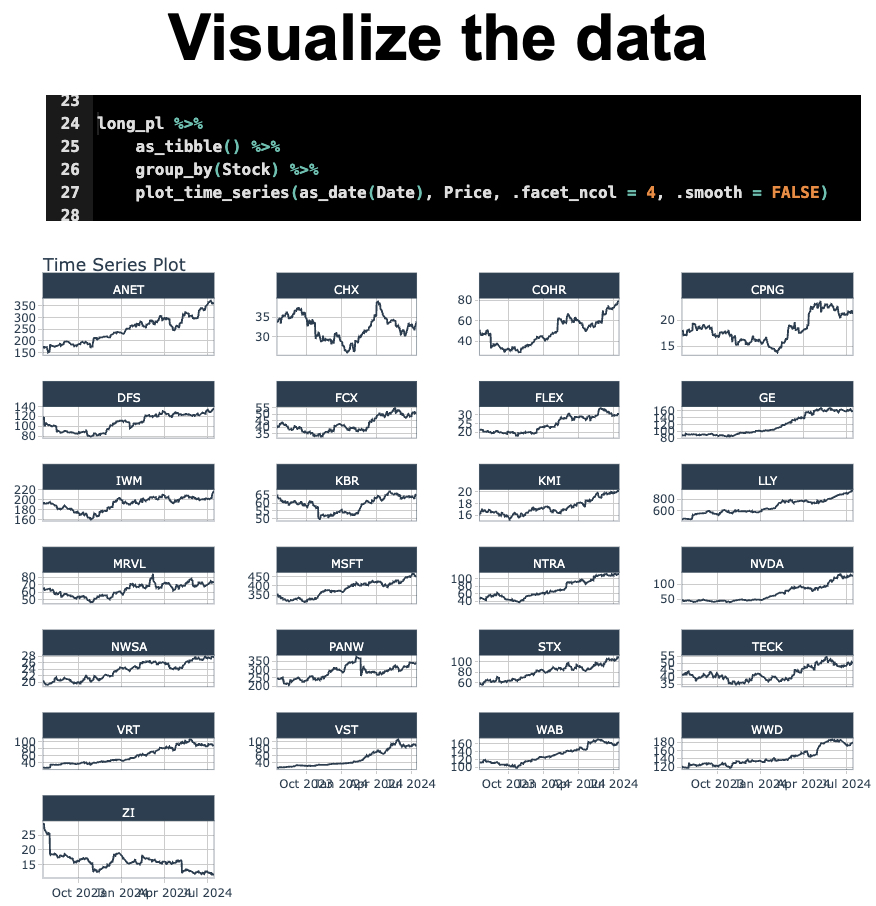
Get the Code (In the R-Tip 082 Folder)
Step 4 - Moving Averages with Polars’ Rolling Mean
The last step we’ll cover is how to perform moving averages using polars rolling mean functionality. This is one of the biggest benefits to using Polars.
Run this code to perform a 10-day and 50-day moving average over each of the 25 stocks:
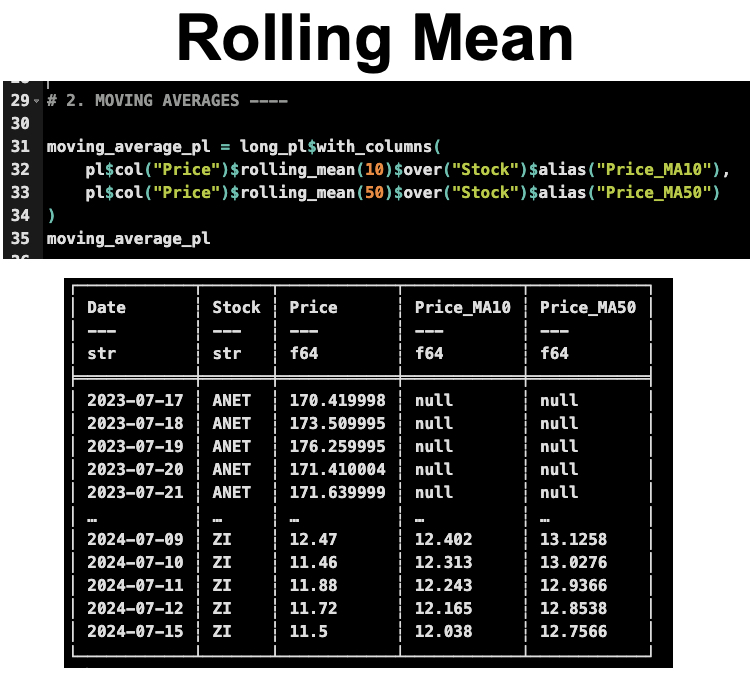
Get the Code (In the R-Tip 082 Folder)
Again, the performance is undeniable. In milliseconds, the rolling calculations are complete.
Run this code to visualize the result:
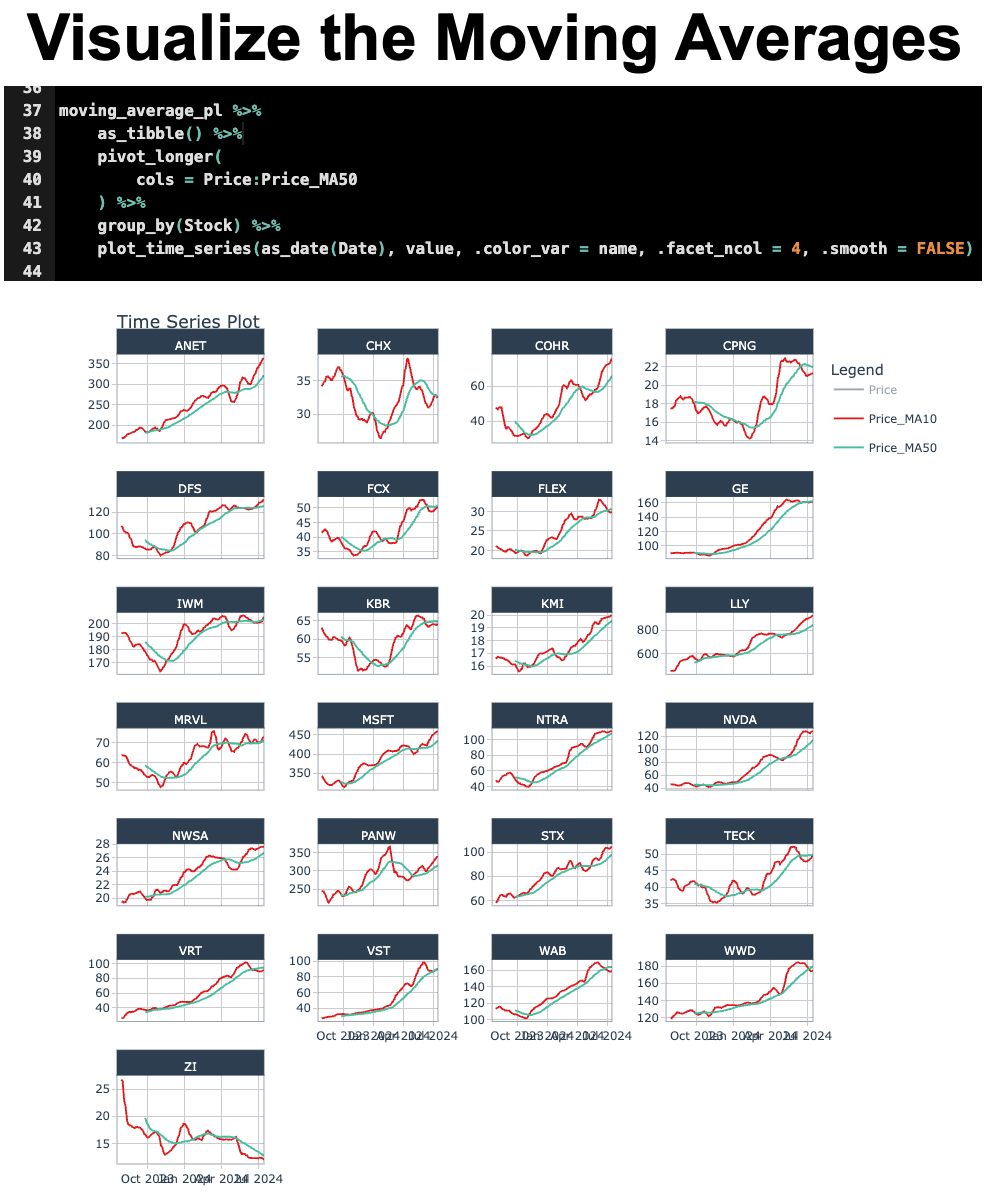
Get the Code (In the R-Tip 082 Folder)
We can quickly see which stocks have momentum from the 10-day and 50-day moving averages (those with Red lines above the Green Lines).
Reminder: The code is available free inside R-tips
All of the code you saw today is available in R-Tips Newsletter folder for R-Tip 082

Get the Code (In the R-Tip 082 Folder)
Conclusions:
Polars is one of those libraries that is quickly becoming a standard in the Python ecosystem. I’m glad to see that R is getting the same treatment. It’s simply the fastest data manipulation library I’ve come across. And I’ve tried them all.
If you would like to grow your Business Data Science skills, then please read on…
Need to advance your business data science skills?
I’ve helped 6,107+ students learn data science for business from an elite business consultant’s perspective.
I’ve worked with Fortune 500 companies like S&P Global, Apple, MRM McCann, and more.
And I built a training program that gets my students life-changing data science careers (don’t believe me? see my testimonials here):
6-Figure Data Science Job at CVS Health ($125K)
Senior VP Of Analytics At JP Morgan ($200K)
50%+ Raises & Promotions ($150K)
Lead Data Scientist at Northwestern Mutual ($175K)
2X-ed Salary (From $60K to $120K)
2 Competing ML Job Offers ($150K)
Promotion to Lead Data Scientist ($175K)
Data Scientist Job at Verizon ($125K+)
Data Scientist Job at CitiBank ($100K + Bonus)
Whenever you are ready, here’s the system they are taking:
Here’s the system that has gotten aspiring data scientists, career transitioners, and life long learners data science jobs and promotions…

Join My 5-Course R-Track Program Now!
(And Become The Data Scientist You Were Meant To Be...)
P.S. - Samantha landed her NEW Data Science R Developer job at CVS Health (Fortune 500). This could be you.
