Make Microsoft Word Reports with R + officedown
Written by Matt Dancho
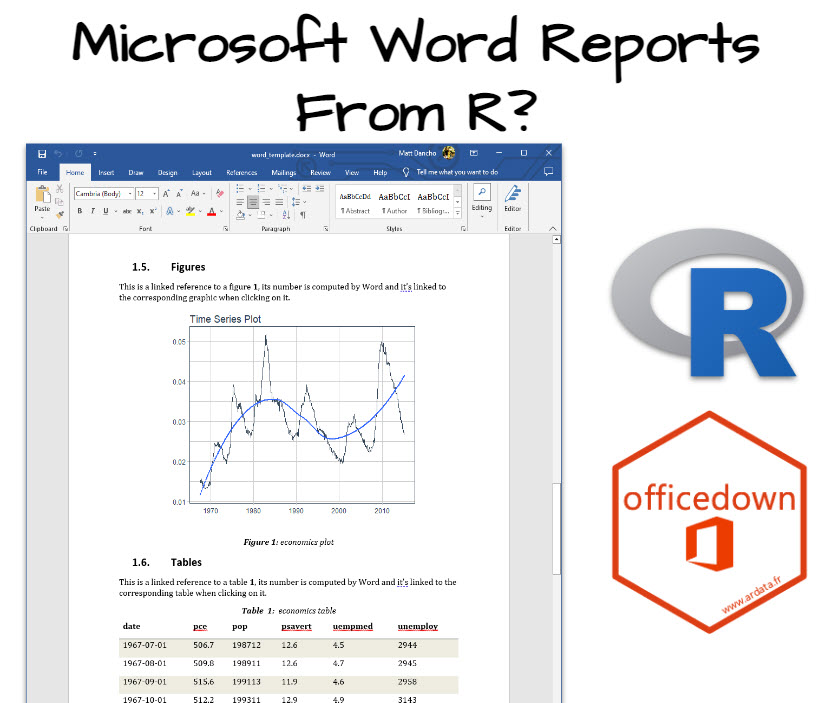
What’s the one thing that will impress your company (that you can make in under 60 minutes)? A professional business report.
And Microsoft Word is the defacto standard (NOT Jupyter Notebooks or HTML web-reports). Even PDFs aren’t ideal, especially if they need to review and comment on them.
Table of Contents
Today I’m going to show you how to make professional Microsoft Word Reports use officedown. Here’s what you’re learning today:
- Tutorial: How to use
officedown to effortlessly produce a Microsoft Word Report (that your company will read)
- Bonus: Get a Free Rmarkdown Template for making Word Reports
SPECIAL ANNOUNCEMENT: AI for Data Scientists Workshop on December 18th
Inside the workshop I’ll share how I built a SQL-Writing Business Intelligence Agent with Generative AI:

What: GenAI for Data Scientists
When: Wednesday December 18th, 2pm EST
How It Will Help You: Whether you are new to data science or are an expert, Generative AI is changing the game. There’s a ton of hype. But how can Generative AI actually help you become a better data scientist and help you stand out in your career? I’ll show you inside my free Generative AI for Data Scientists workshop.
Price: Does Free sound good?
How To Join: 👉 Register Here
R-Tips Weekly
This article is part of R-Tips Weekly, a weekly video tutorial that shows you step-by-step how to do common R coding tasks. Pretty cool, right?
Here are the links to get set up. 👇
This Tutorial is Available in Video
I have a companion video tutorial that gives you the bonus Rmarkdown MS Word Template shown in this video (plus walks you through how to use it). And, I’m finding that a lot of my students prefer the dialogue that goes along with coding. So check out this video to see me running the code in this tutorial. 👇
Why Making Microsoft Word Reports from R is a Must
Listen, there’s one way to immediately turn off an executive…
And that’s by giving them a Jupter Notebook (I mean look at this mess).
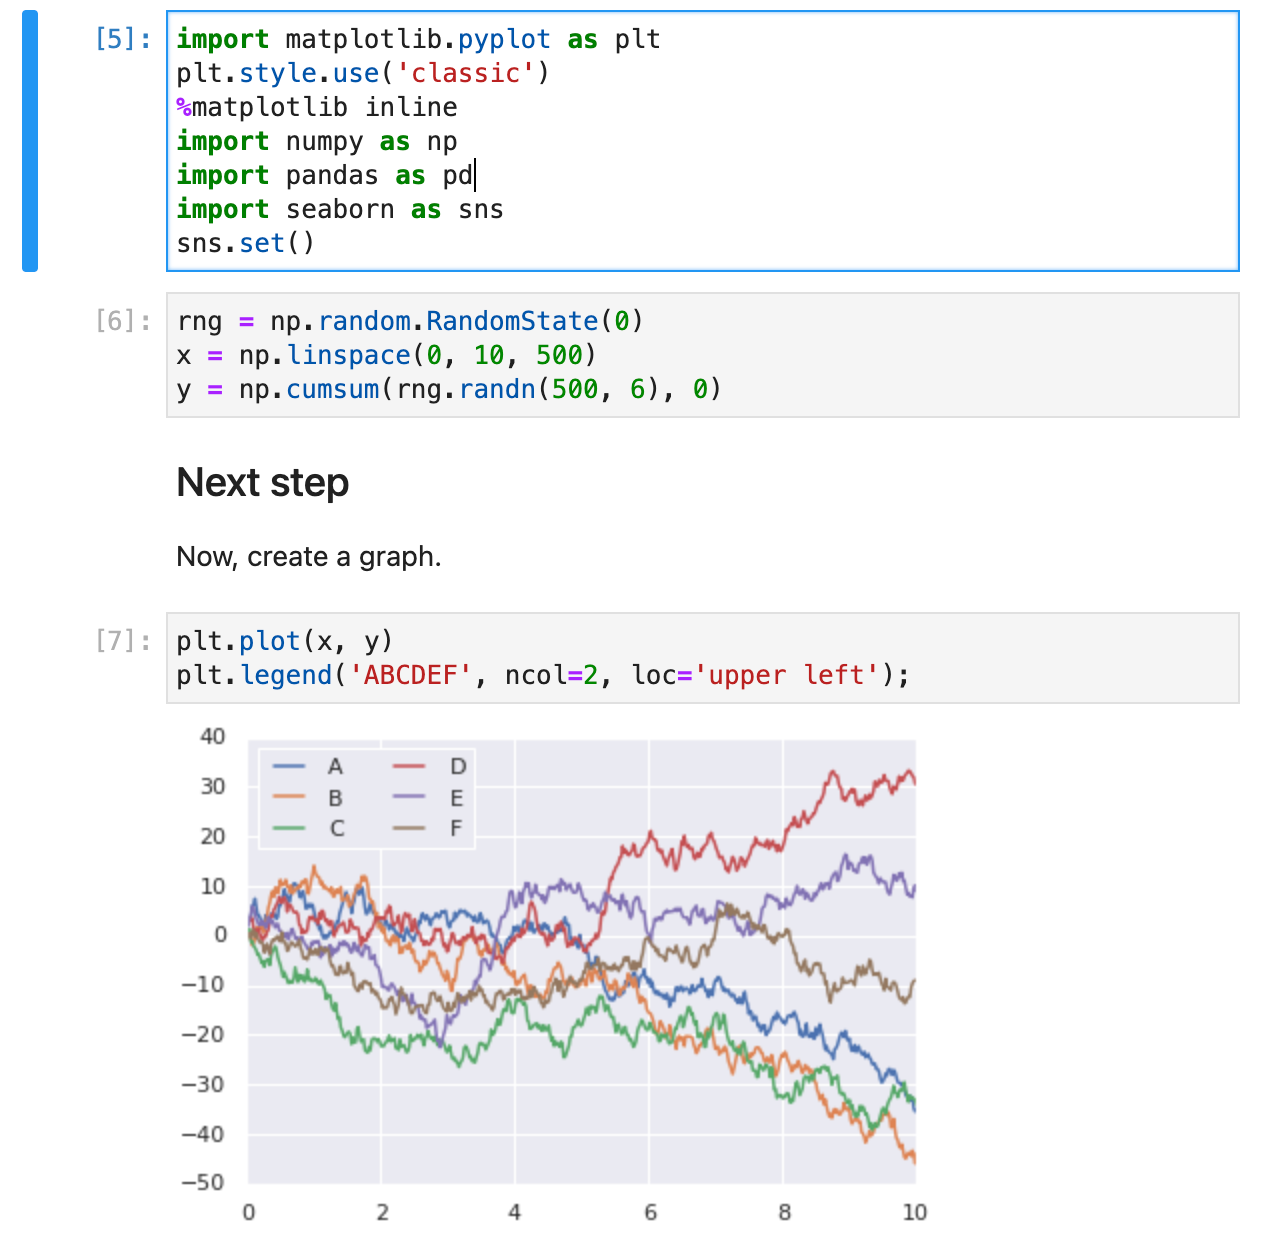
Please don't send Executives reports that look like this.
Nothing against those that use Jupyter Notebooks to make their analysis.
But, if you sent one of those to me (and I’m an executive that’s used to reading reports in Microsoft Office formats like Excel and Word)…
How does that make you feel?
You just spent days on a report. And guess what, it’s not getting read.
Well let’s fix that by learning how to making Microsoft Word Reports today.
Thank You to the Developer (and Community).
Before we do our deep-dive into officedown, I want to take a brief moment to thank the developer, David Gohel. David runs a consulting company Ardata. Please connect and follow David. His work is on GitHub here.
Also I’d like to thank Adrian Olszewski, Principal Biostatistician at 2KMM for sharing the Office-verse R ecosystem with me. Without community and sharing knowledge, this R-tip wouldn’t be possible.
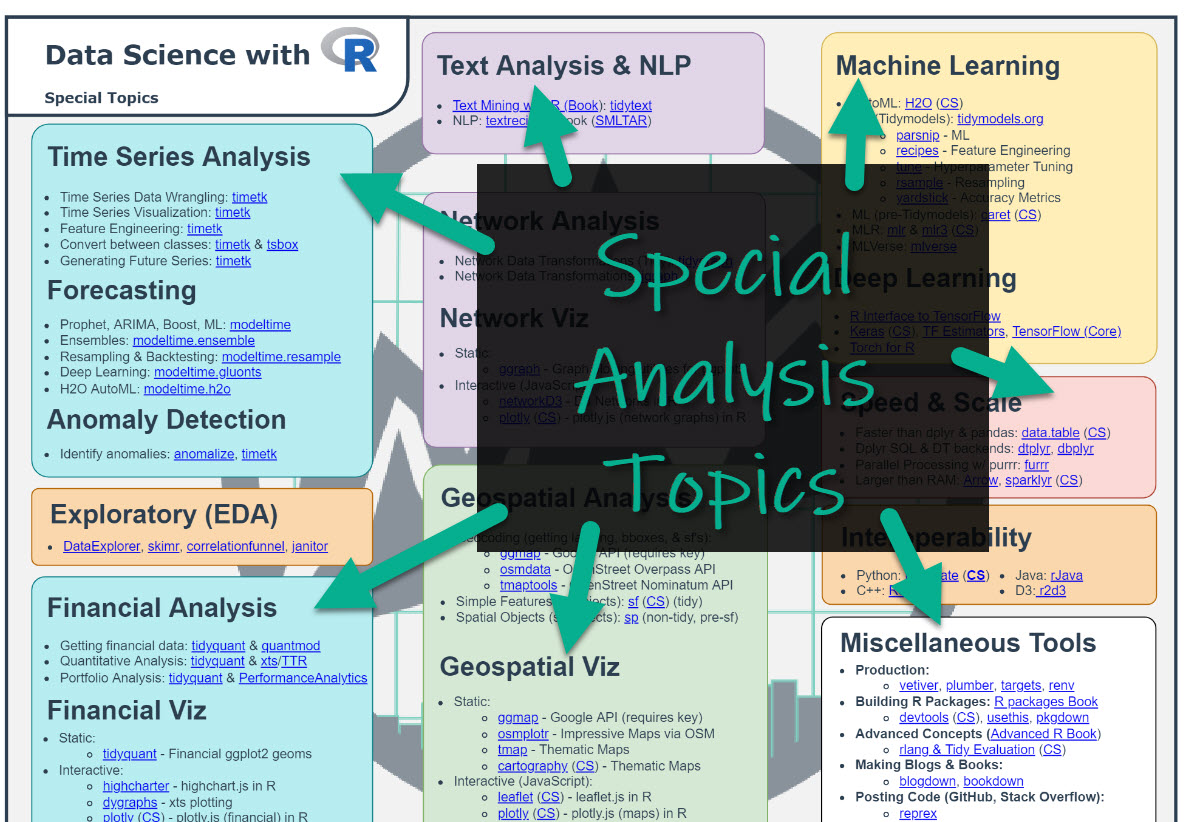
Free Gift: Cheat Sheet for my Top 100 R Packages (Special Data Analysis Topics Included)
Before we dive in…
You’re going to need R packages to complete the analysis that goes in your MS Word reports. So why not speed up the process?
To help, I’m going to share my secret weapon…
Even I forget which R packages to use from time to time. And this cheat sheet saves me so much time. Instead of googling to filter through 20,000 R packages to find a needle in a haystack. I keep my cheat sheet handy so I know which to use and when to use them. Seriously. This cheat sheet is my bible.
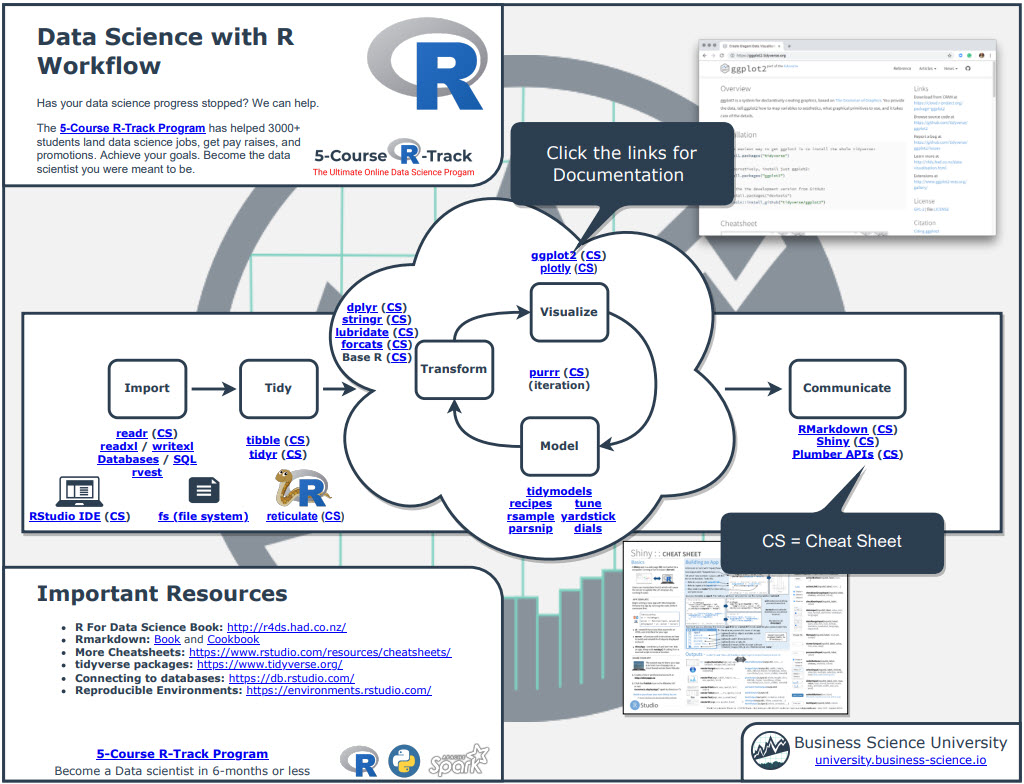
Once you download it, head over to page 3 and you’ll see several R packages I use frequently just for Data Analysis.
Which is important when you want to work in these fields:
- Machine Learning
- Time Series
- Financial Analysis
- Geospatial Analysis
- Text Analysis and NLP
- Shiny Web App Development
So steal my cheat sheet. It will save you a ton of time.
Tutorial: Make Microsoft Word Reports with officedown
Here’s how to use officedown to start make a professional Word Report.
Step 1: Make an Rmarkdown document
Start by making a normal Rmarkdown document. Go to File > New File > R Markdown.
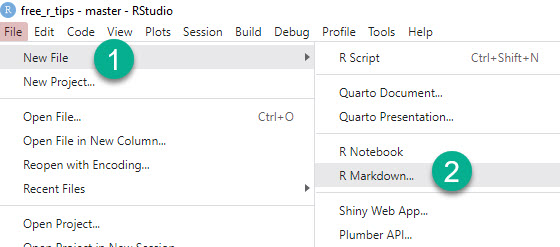
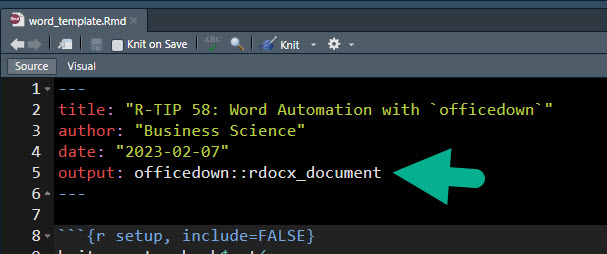
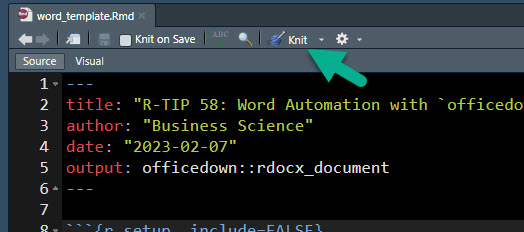
Step 2: Enable Officedown
Enable officedown as the Rmarkdown Output.
Get the code.
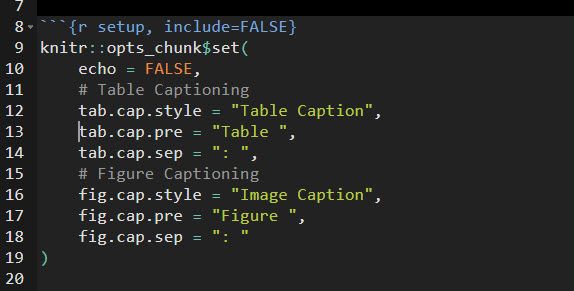
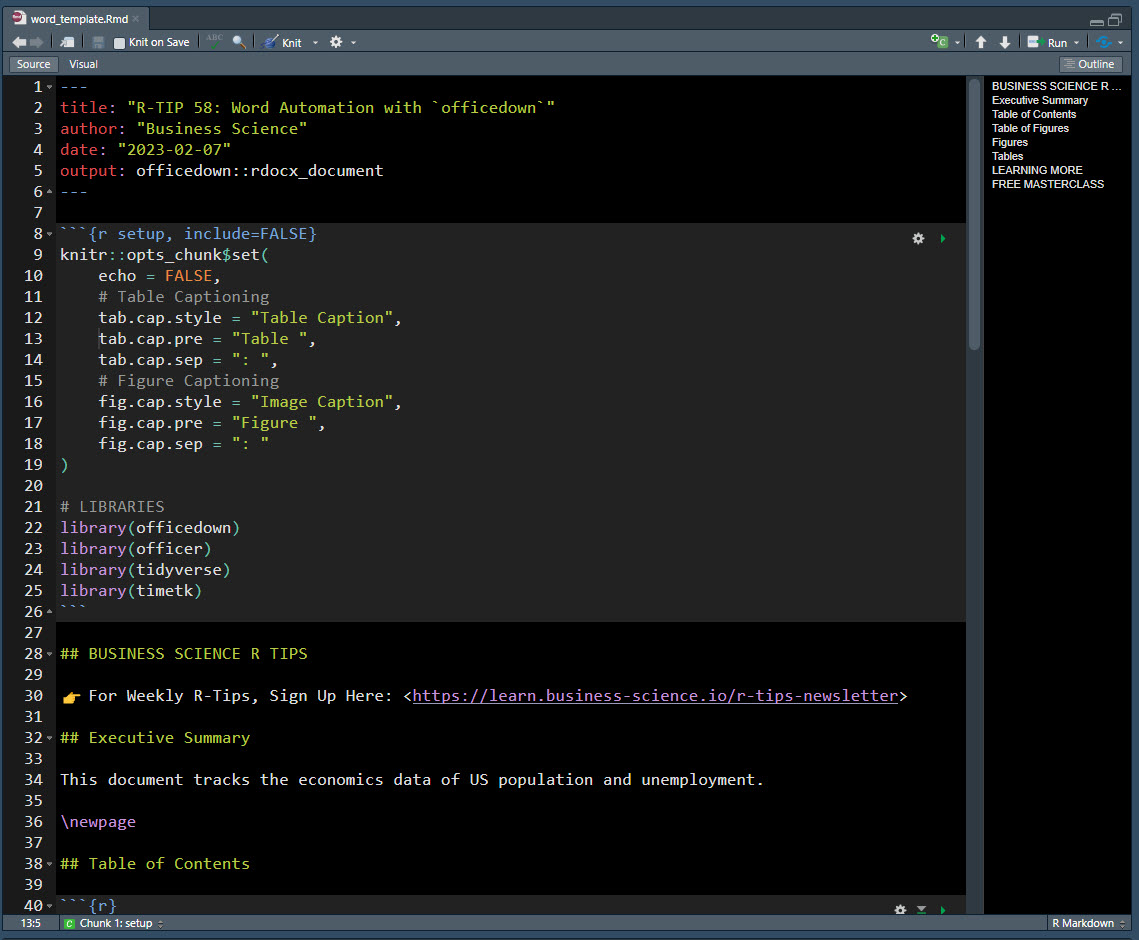
Step 3: Setup the document’s global knitr options
Use these knitr options to let officedown format the table and figure captions.
Get the code.
Step 4: Add Table of Contents
The block_toc() function allows the Word Table of Contents to be generated.
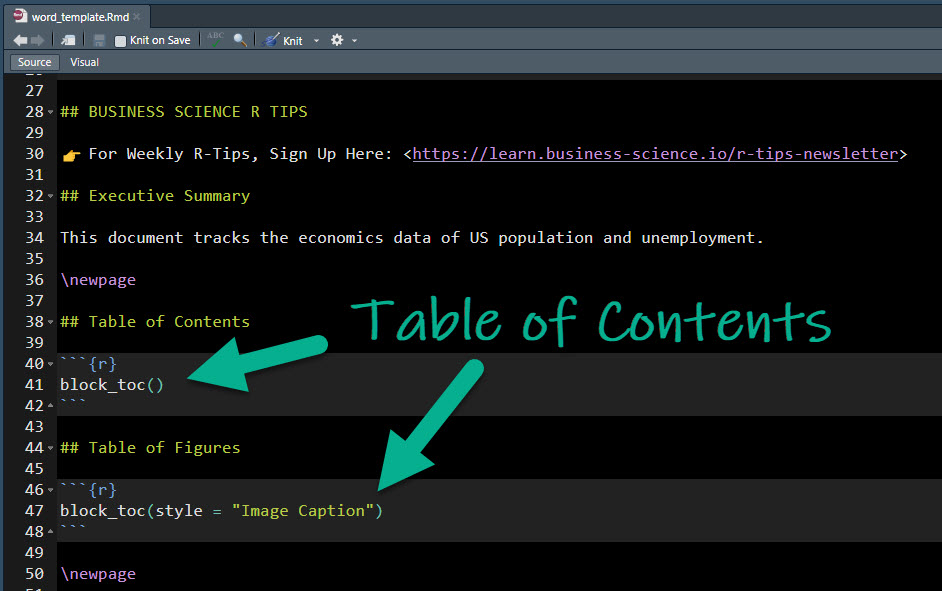
Get the code.
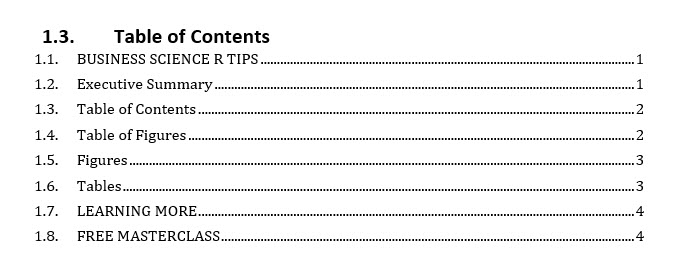
Here’s what the Table of Contents looks like.
This is where you start building the core of your report. Officedown integrates:
- Hyperlinked Figure Captioning using
\@ref(fig:fig_id)
- Knitr Options like
fig.id to connect the linked references to the figures
- Just add R Code inside of the Rmarkdown chunks like you would normally
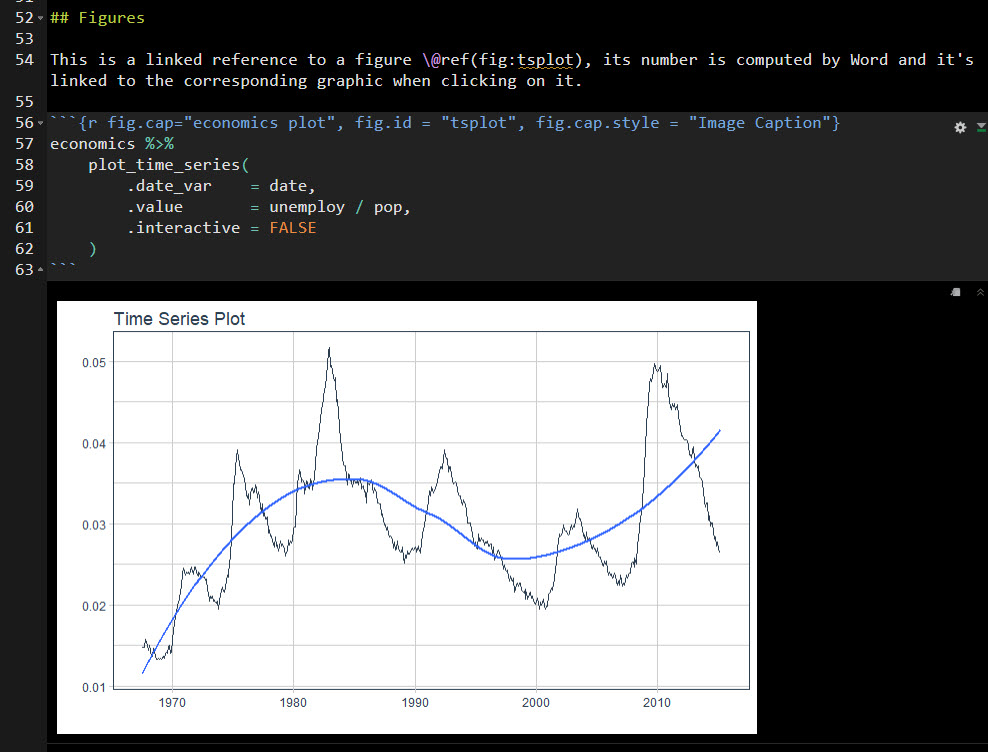
Get the code.
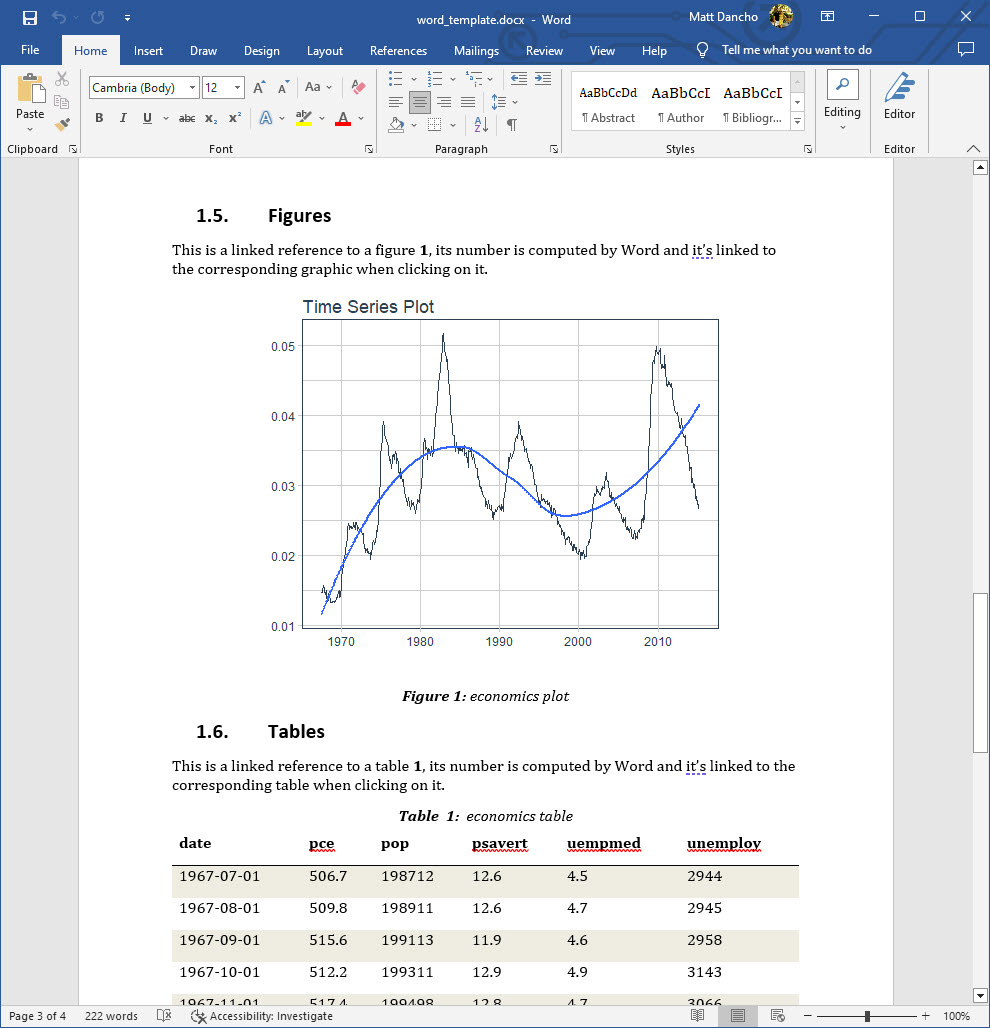
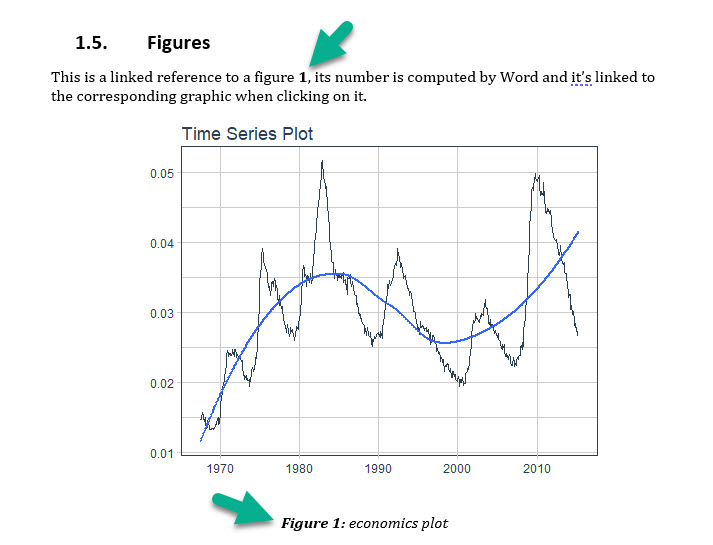
Here’s what it looks like in the report:
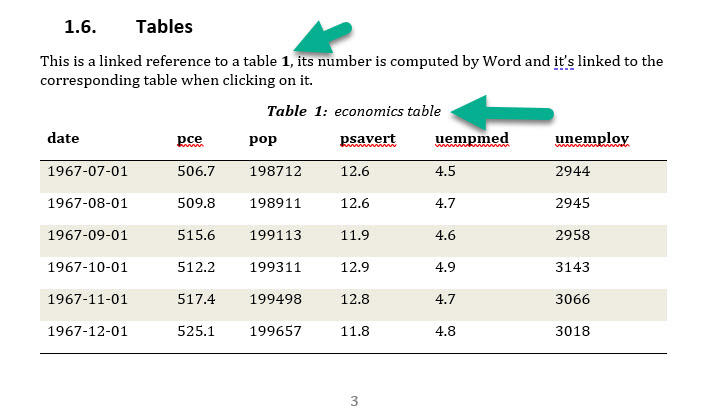
Step 5: Add Tables
The last step is adding tables in your document.
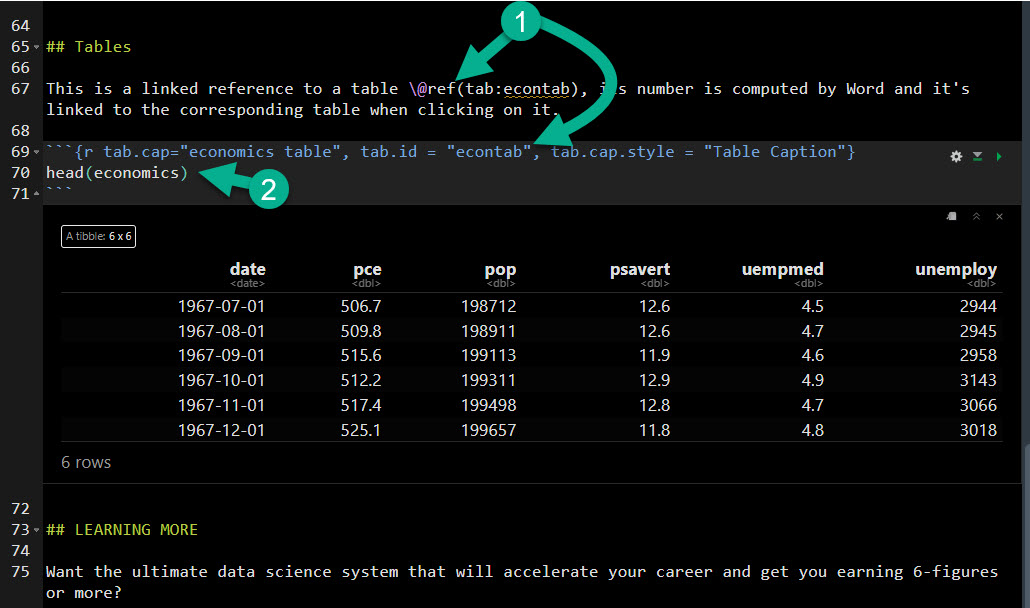
Get the code.
And here’s what it looks like in the Word Report.
Step 6: Knit the Report
The last step is to click the “knit” button.
Get the code.
Viola! You get a professional report:
Bonus: Steal My Officedown Template
Want to speed up the process? You can steal my Officedown Template. All you need to do is subscribe to my R-Tips Newsletter.
Steal My Officedown MS Word Template.
Once you register, you’ll get instructions to download all of the R-Tips.
The Officedown Word Template is located in the folder 058_ms_word_reports.
💡 Conclusions
You learned how to use the officedown library to create a professional-looking Microsoft Word Report. Great work! But, there’s a lot more to becoming a data scientist.
If you’d like to become a Business Data Scientist (and have an awesome career, improve your quality of life, enjoy your job, and all the fun that comes along), then I can help with that.
Need to advance your business data science skills?
I’ve helped 6,107+ students learn data science for business from an elite business consultant’s perspective.
I’ve worked with Fortune 500 companies like S&P Global, Apple, MRM McCann, and more.
And I built a training program that gets my students life-changing data science careers (don’t believe me? see my testimonials here):
6-Figure Data Science Job at CVS Health ($125K)
Senior VP Of Analytics At JP Morgan ($200K)
50%+ Raises & Promotions ($150K)
Lead Data Scientist at Northwestern Mutual ($175K)
2X-ed Salary (From $60K to $120K)
2 Competing ML Job Offers ($150K)
Promotion to Lead Data Scientist ($175K)
Data Scientist Job at Verizon ($125K+)
Data Scientist Job at CitiBank ($100K + Bonus)
Whenever you are ready, here’s the system they are taking:
Here’s the system that has gotten aspiring data scientists, career transitioners, and life long learners data science jobs and promotions…

Join My 5-Course R-Track Program Now!
(And Become The Data Scientist You Were Meant To Be...)
P.S. - Samantha landed her NEW Data Science R Developer job at CVS Health (Fortune 500). This could be you.
