Introducing anomalize for timetk in R (For Time Series Anomaly Detection)
Written by Matt Dancho
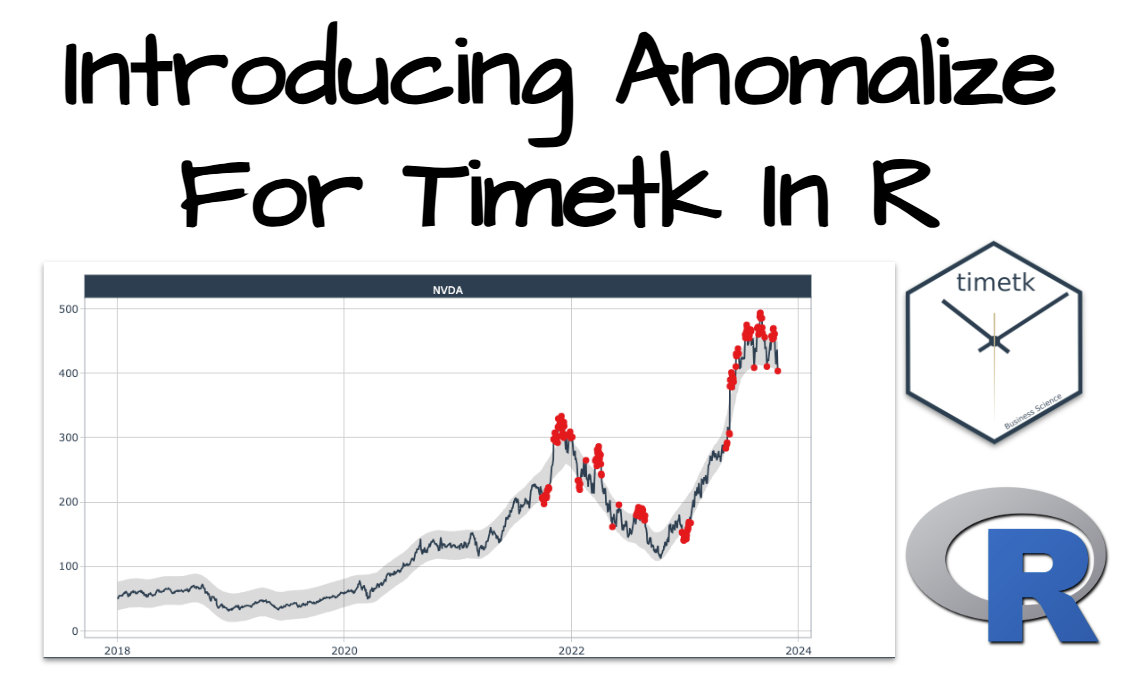
Hey guys, welcome back to my R-tips newsletter. In today’s R-Tip, I’m sharing BRAND NEW time series anomaly detection functionality I just added to timetk in R. It’s a native integration of my anomalize R package (and it includes some new bells and whistles for time series anomaly detection). Plus, I’m sharing exactly how to do anomaly detections with a student-driven finance example (stock data). AND how you can analyze anomalies for ANY time series data set. Let’s go!
Table of Contents
Today I share how to automatically detect anomalies with anomalize(), a new function just added to timetk. Here’s what you’re learning today:
- How to use
anomalize() to automate anomaly detection: This 1 function automatically breaks down, detects, and cleans anomalies in R.
- Full Code Demo: Exactly how to anomalize ANY time series in under 25 lines of code.
- Financial Example: How to use
anomalize() to detect anomalies in stock data.
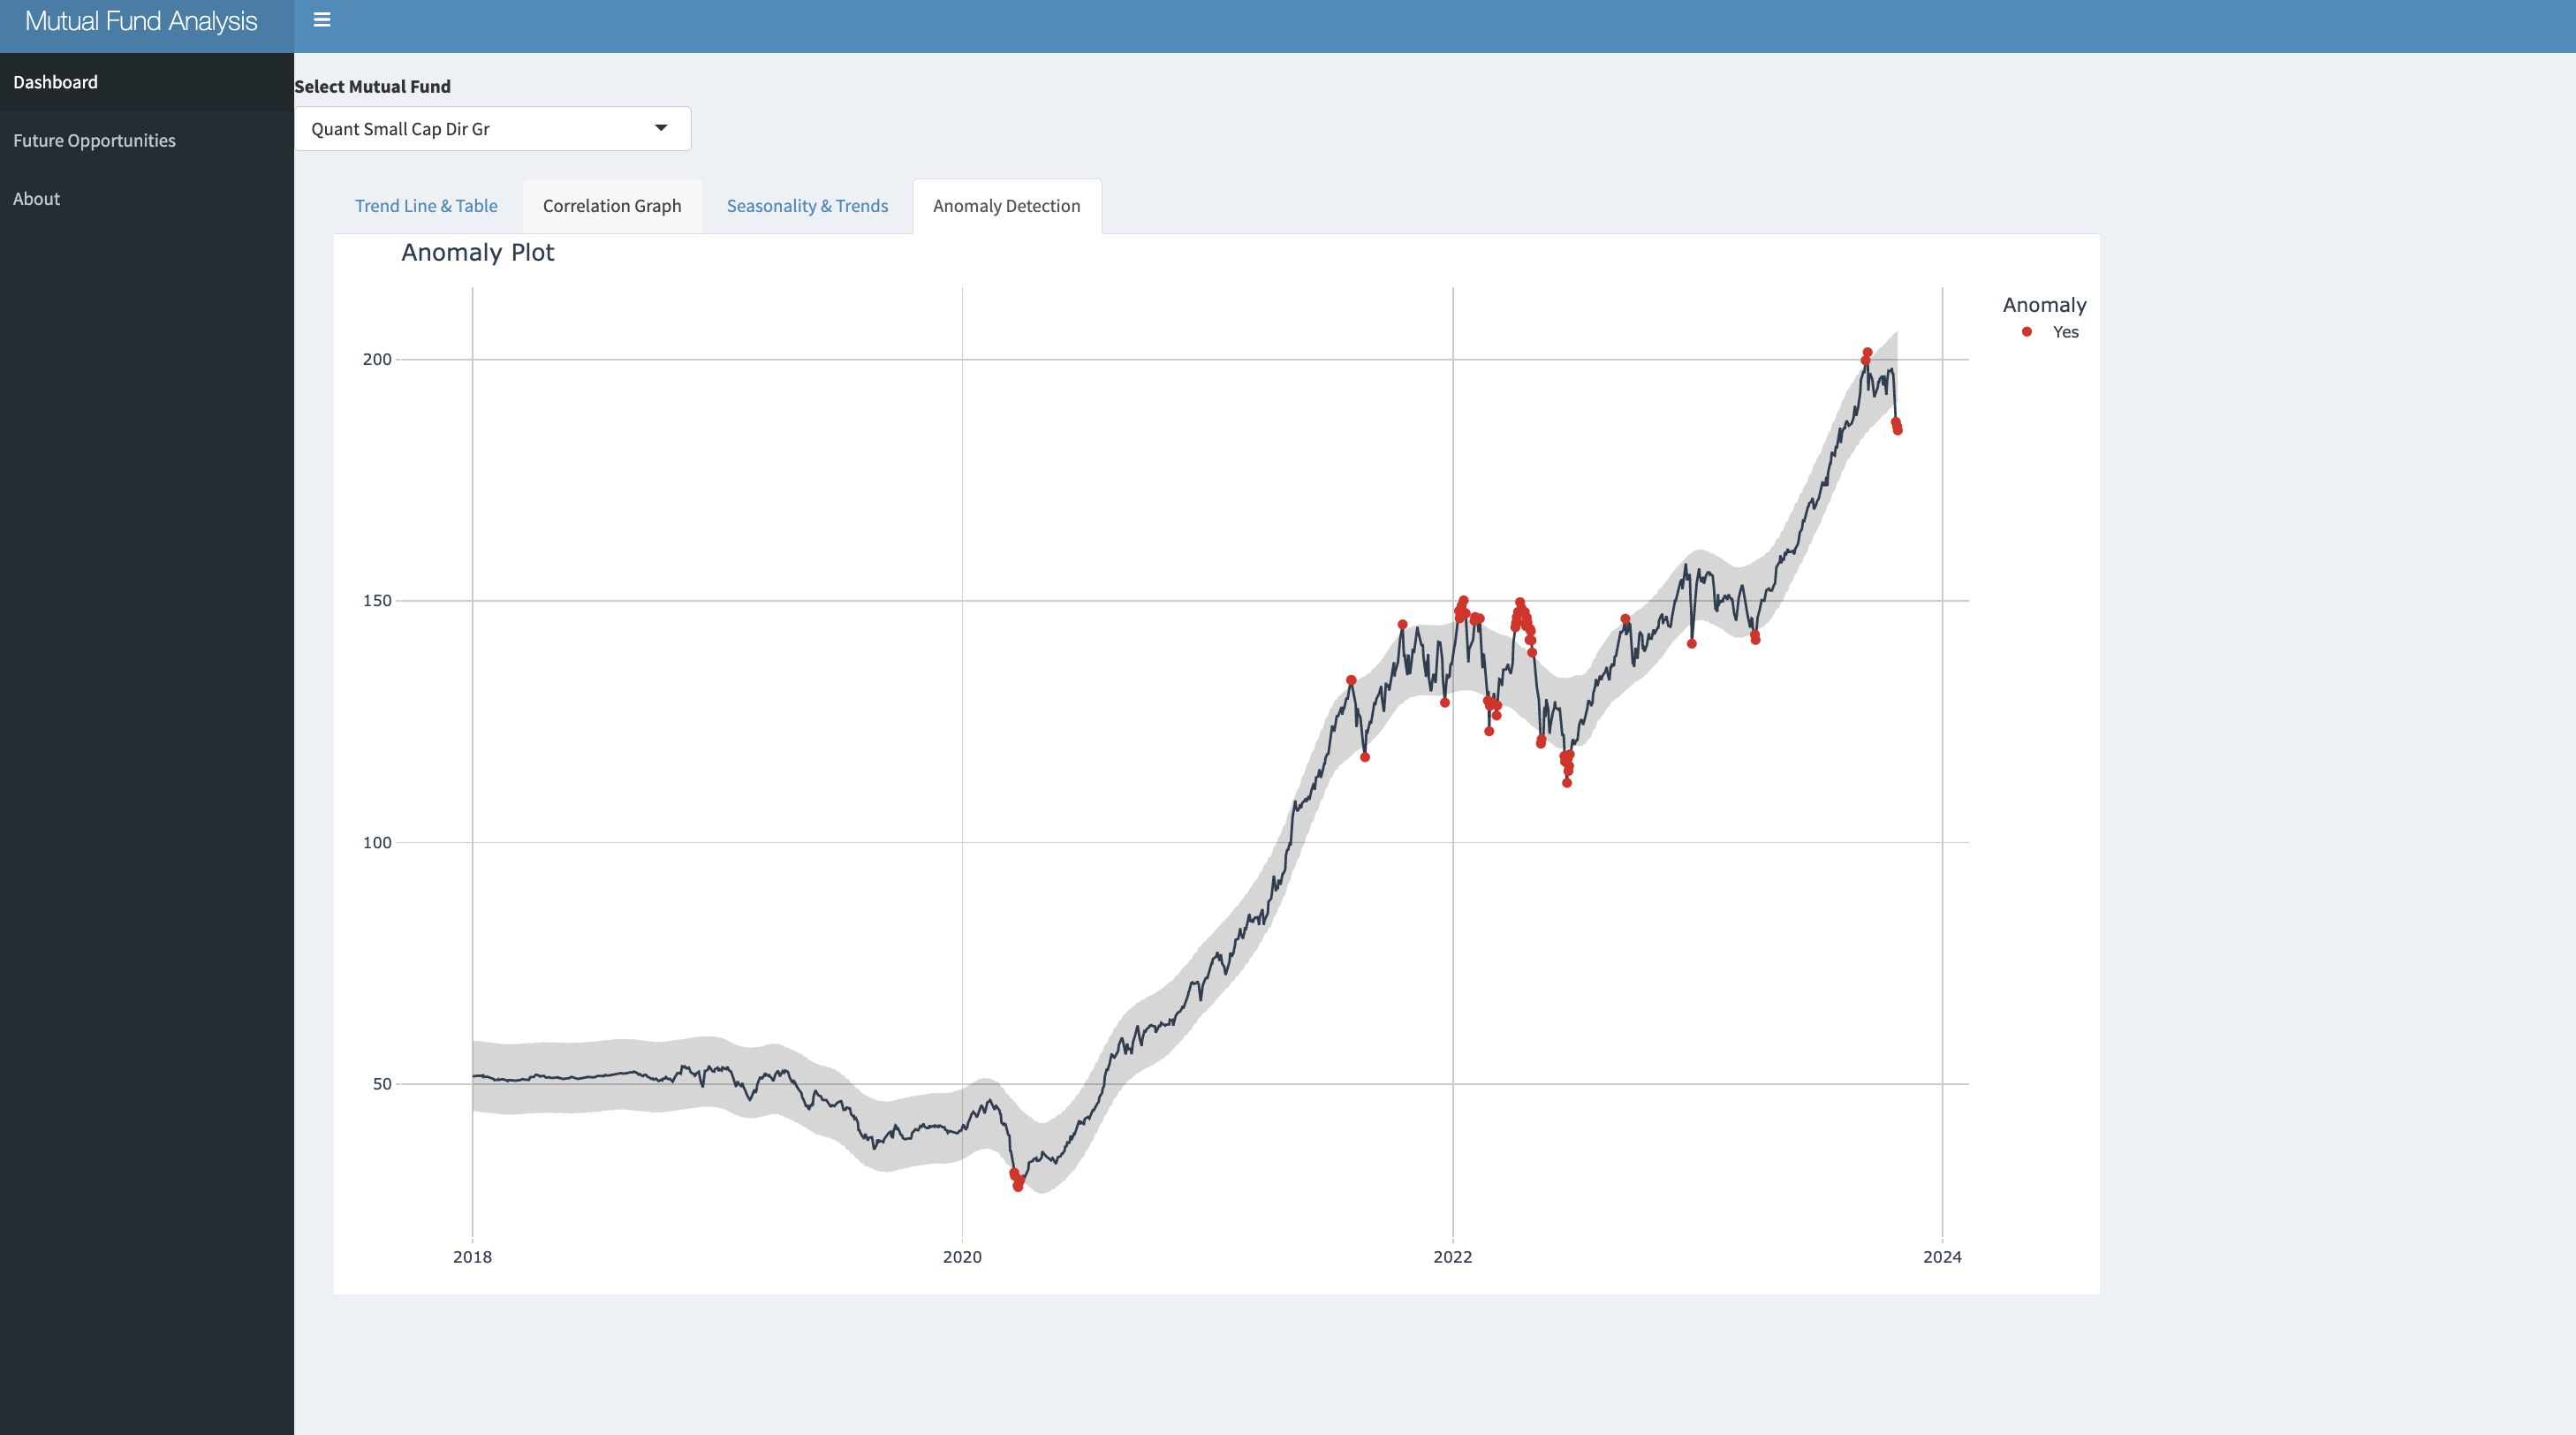
What You Make Today!
Disclaimer
We are doing a stock analysis example. This is for educational purposes only. I am not a financial advisor. I am not recommending any stocks. I am not responsible for any financial losses. Please consult a financial advisor before making any financial decisions.
SPECIAL ANNOUNCEMENT: AI for Data Scientists Workshop on December 18th
Inside the workshop I’ll share how I built a SQL-Writing Business Intelligence Agent with Generative AI:

What: GenAI for Data Scientists
When: Wednesday December 18th, 2pm EST
How It Will Help You: Whether you are new to data science or are an expert, Generative AI is changing the game. There’s a ton of hype. But how can Generative AI actually help you become a better data scientist and help you stand out in your career? I’ll show you inside my free Generative AI for Data Scientists workshop.
Price: Does Free sound good?
How To Join: 👉 Register Here
R-Tips Weekly
This article is part of R-Tips Weekly, a weekly video tutorial that shows you step-by-step how to do common R coding tasks. Pretty cool, right?
Here are the links to get set up. 👇
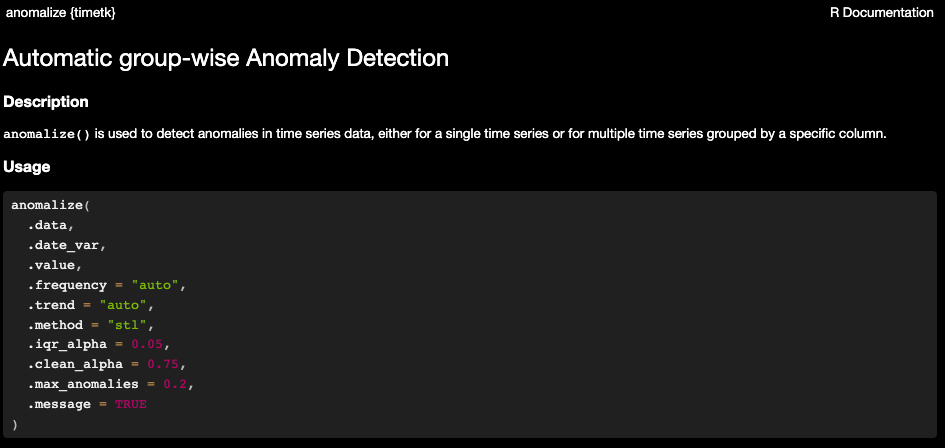
The new anomalize() function in timetk (R)
Anomalize: In 1 line of code it does 3 things:
- Time Series Decomposition: Breaks down a time series into trend, seasonal, and remainder components.
- Anomaly Detection: Reconstructs the original time series without anomalies.
- Anomaly Adjustment: Replaces anomalies with interpolated values.
Anomalize for TimeTK in R
Here’s how it works using a Stock Analysis example that’s inspired by one of my students.
Student Example: Anomaly Detection in Stock Analysis and Algorithmic Trading
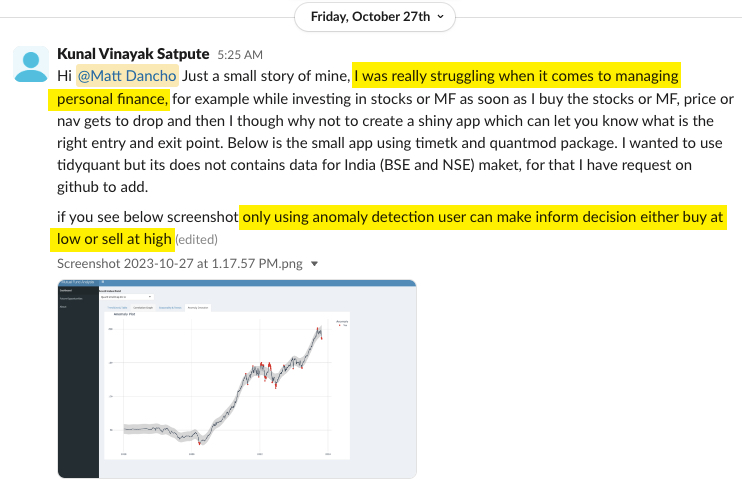
This example is inspired by my student, Kunal Vinayak Satpute, who is a student in my High Performance Time Series Course. He’s working on a project to detect anomalies in stock data to help him improve his personal investing strategies. He’s using timetk and anomalize() to do it.
The Problem: When to Buy and Sell Stocks?
A big challenge when deciding to invest in a stock is whether the timing is right for an entry or exit point. The stock market is volatile and it’s hard to know when to buy or sell. And without a systematic strategy, it’s easy to lose money.
Kunal faced this issue. He says, “I was really struggling when it comes to managing my personal finances.While investing in stocks or mutual funds, as soon as I buy the stock’s price drops.”
The Solution: Anomaly Detection with timetk and anomalize()
Using time series analysis and more specifically Anomaly Detection, Kunal is able to detect anomalies in stock data. This helps him make better decisions on when to buy and sell stocks. He then put this into an R Shiny App that he can use to analyze any stock or mutual fund in a systematic and scalable automation.
So let’s get into the code and see how it works, shall we?
Tutorial: How to Detect Anomalies in Financial Time Series Data with anomalize() in timetk
Today, you’re going to learn how to use anomalize() to detect anomalies in financial time series data. We’ll use the stock data similar to the student example.
For the code and data used in this example, you can get it here:
-
Join the R-Tips Newsletter Right Now! (Code and Data are sent via email)
-
The data and R script files are located in the /071_anomalize_timetk_intro folder
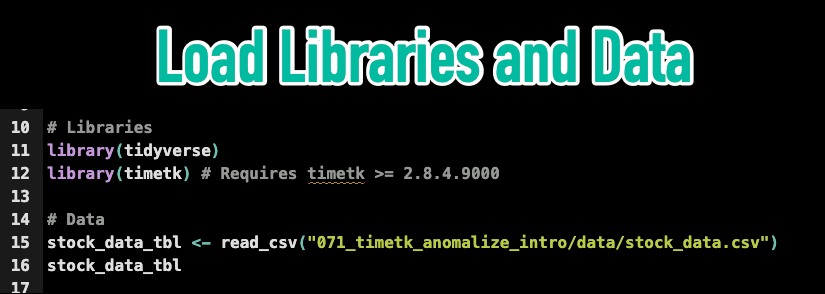
Step 1: Load the Libraries
The anomalize() function is BRAND NEW. In fact, it’s so new that it’s not even on CRAN yet. You can get it from GitHub using remotes::install_github("business-science/timetk").
Get the Financial Data and Code Now
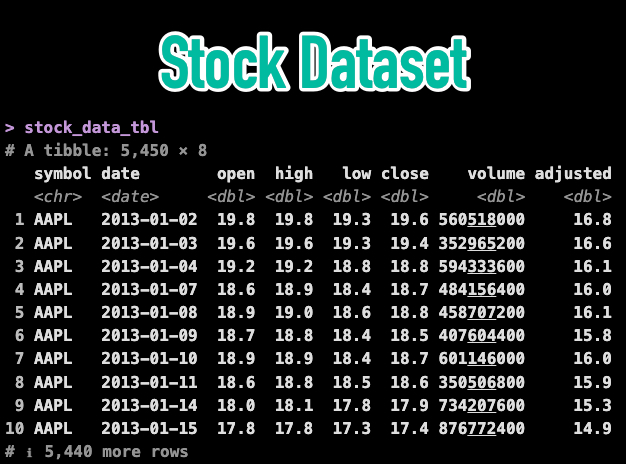
The dataset is a financial time series using OHLCV Data (Open, High, Low, Close, Volume) for the 2 Stocks: AAPL and NVDA.
Get the Financial Data and Code Now
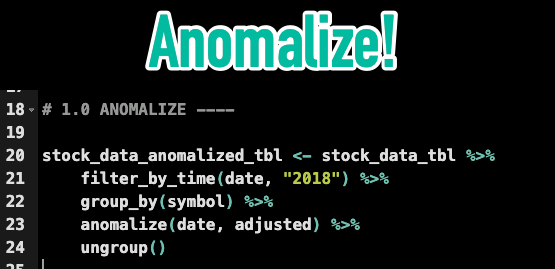
Step 2: Anomalize!
Next, let’s use anomalize() to detect anomalies in the stock data.
Get the Financial Data and Code Now
The data has now been anomalized. Let’s take a look at the results.
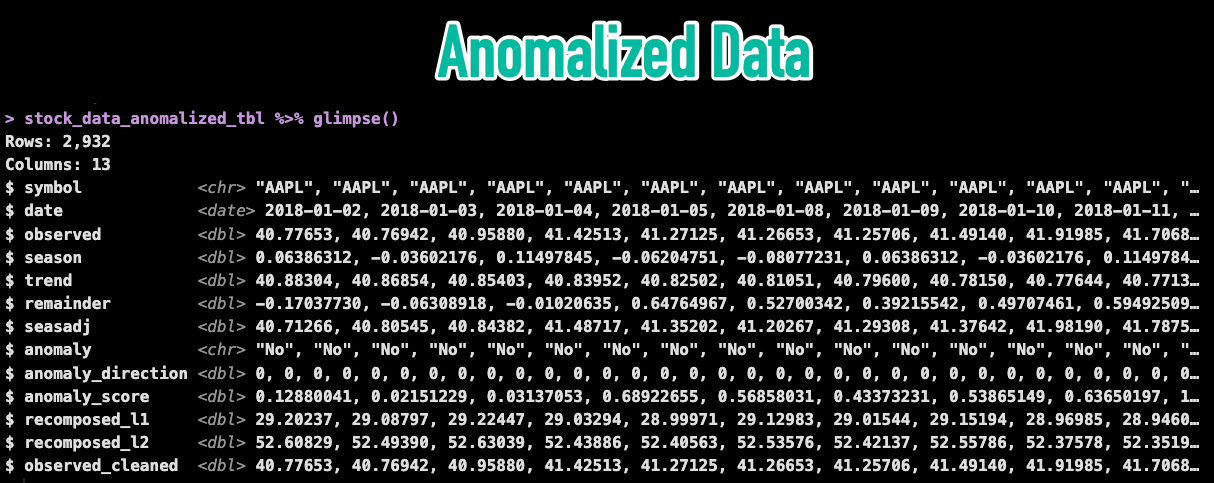
Get the Financial Data and Code Now
We can see new columns are returned:
-
Time Series Decomposition: Trend, Seasonal, Seasonal Adjustment, and Remainder
-
Anomalies: The anomaly (Yes/No), anomaly direction (-1, 0, 1), anomaly_score, recomposed_l1 and l2 bands that distinguish anomalies.
-
Cleaned: The observed_cleaned` time series without anomalies.
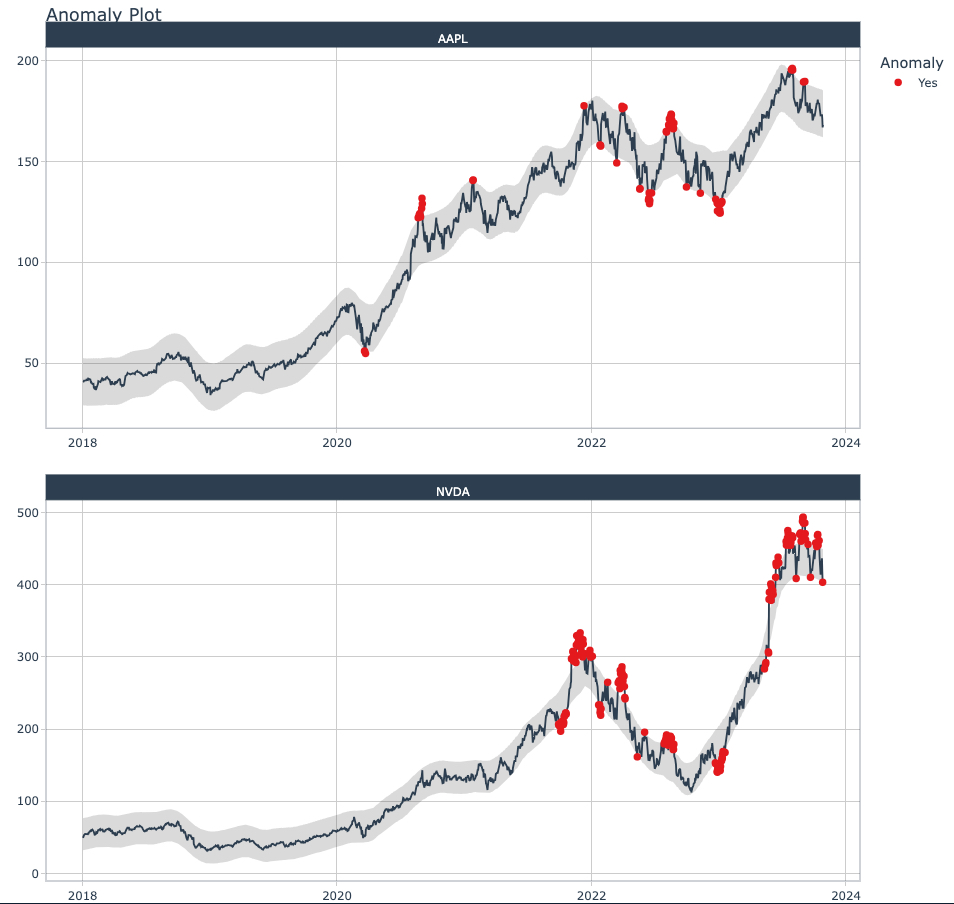
Step 3: Visualize the Anomalies
Next, let’s visualize the anomalies using plot_anomalies().
Get the Financial Data and Code Now
This returns the following plot:
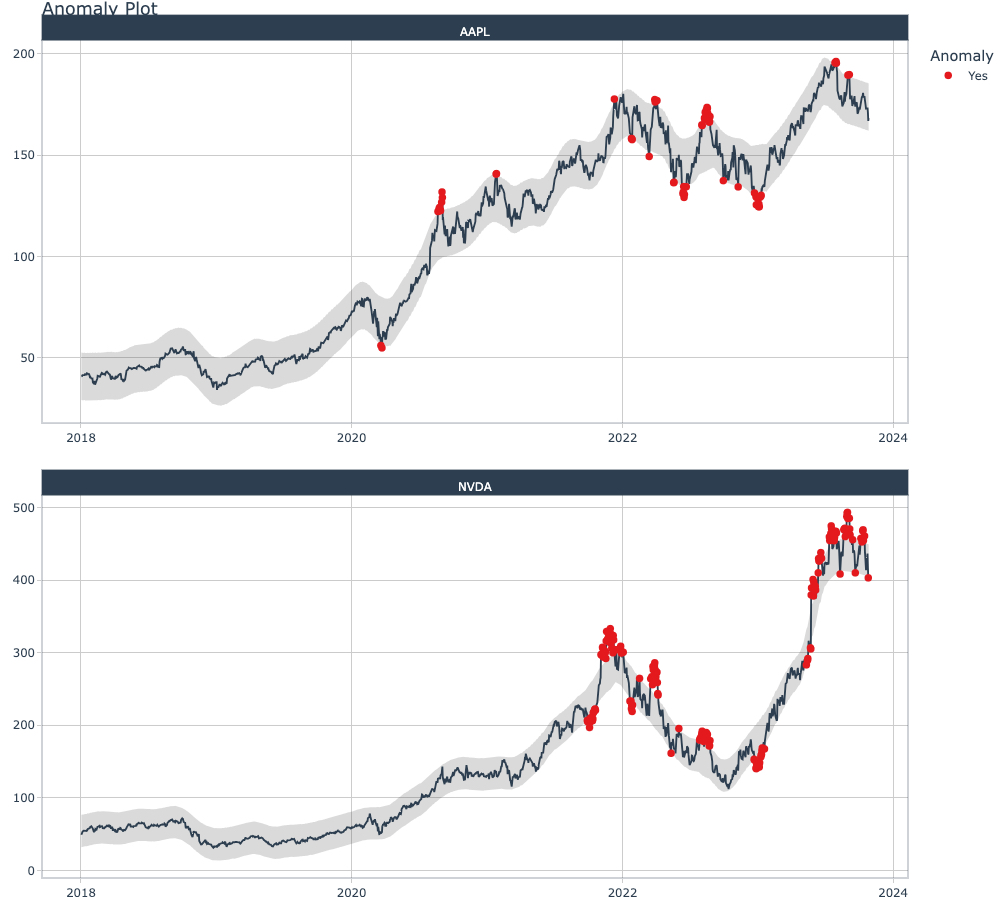
Get the Financial Data and Code Now
Step 4: Analyze the Anomalies
Let’s inspect the anomalies and see if we can detect some buy/sell signals.
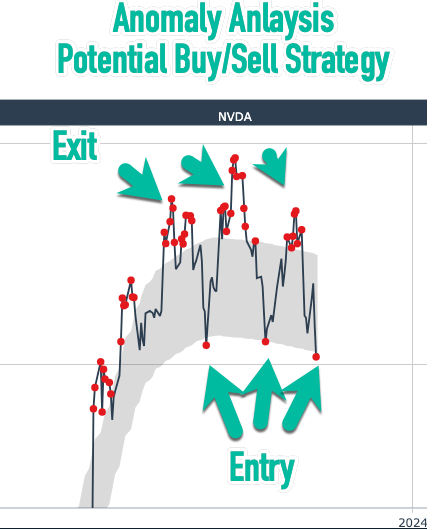
Get the Financial Data and Code Now
Conclusions:
With the new anomalize() function in timetk, we can now automatically detect anomalies in time series data. This is a powerful tool that can be used to detect anomalies in any time series data set.
However, there is A LOT more to learning Time Series, Data Science, and Production Web Applications.
If you are struggling to become a Data Scientist with R, then please read on…
Need to advance your business data science skills?
I’ve helped 6,107+ students learn data science for business from an elite business consultant’s perspective.
I’ve worked with Fortune 500 companies like S&P Global, Apple, MRM McCann, and more.
And I built a training program that gets my students life-changing data science careers (don’t believe me? see my testimonials here):
6-Figure Data Science Job at CVS Health ($125K)
Senior VP Of Analytics At JP Morgan ($200K)
50%+ Raises & Promotions ($150K)
Lead Data Scientist at Northwestern Mutual ($175K)
2X-ed Salary (From $60K to $120K)
2 Competing ML Job Offers ($150K)
Promotion to Lead Data Scientist ($175K)
Data Scientist Job at Verizon ($125K+)
Data Scientist Job at CitiBank ($100K + Bonus)
Whenever you are ready, here’s the system they are taking:
Here’s the system that has gotten aspiring data scientists, career transitioners, and life long learners data science jobs and promotions…

Join My 5-Course R-Track Program Now!
(And Become The Data Scientist You Were Meant To Be...)
P.S. - Samantha landed her NEW Data Science R Developer job at CVS Health (Fortune 500). This could be you.
