Introducing Pytimetk: Time Series Analysis in Python
Written by Matt Dancho
Hey guys, welcome back to my R-tips newsletter. I’m deviating from the normal R post to talk about a new Python package (available on my Python Newsletter). Sounds weird, but it’s actually aimed at helping R users do time series analysis in Python. It’s a port of my R package timetk thats been downloaded over 2,000,000 times. And I’m excited to announce it’s available in Python. Let’s go!
Table of Contents
Today, I’m focusing on a Financial Time Series Analysis use case. Here’s what we’ll cover:
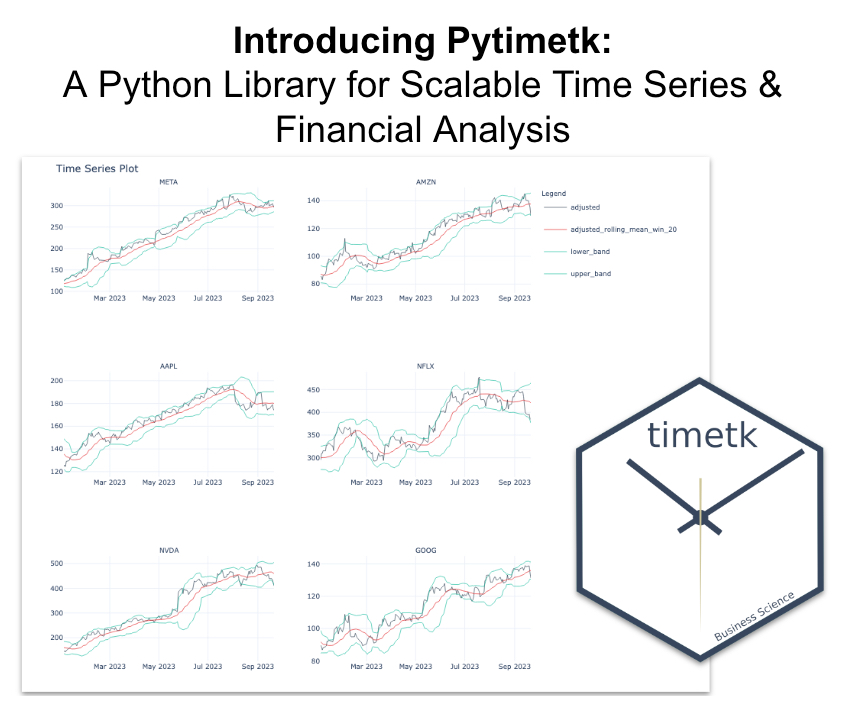
Introducing Pytimetk
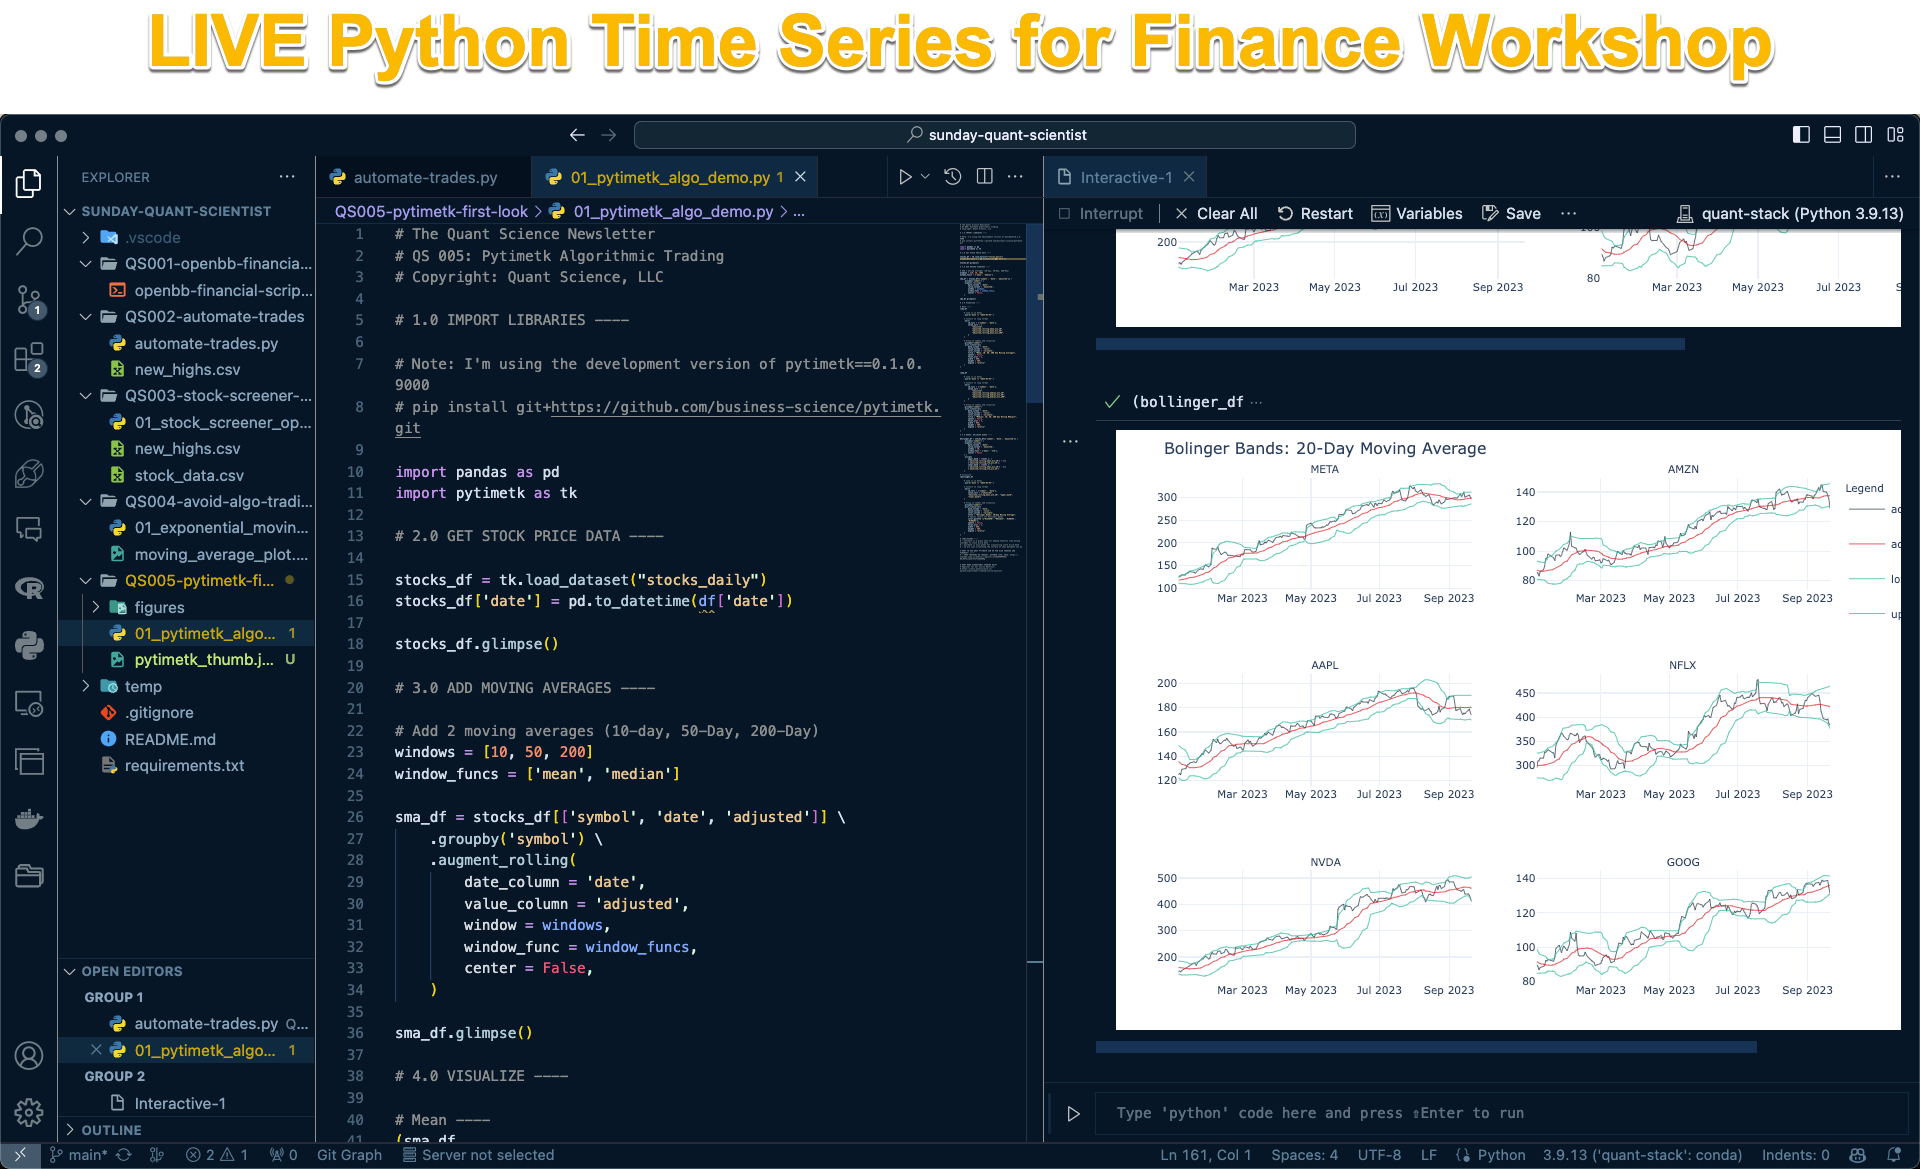
Special Announcement: Free LIVE Python Time Series for Finance Workshop on October 17th
I’m excited to announce that I’m teaming up with Snowflake to do a FREE LIVE WORKSHOP on Python Time Series for Finance on October 17th.
Inside the workshop, Jason Strimpel, Jonathan Regenstein (Snowflake) and I will share how Snowflake is scaling financial and quantitative time series analysis with PyTimeTK. We will demonstrate the code used to analyze 100s of financial investments. And we will give a roadmap for our financial software development and course training programs at Quant Science and our sister company Business Science.
-
What? Python Time Series for Finance with PyTimeTK (Special Guest: Snowflake ❄️)
-
When? Tuesday October 17th at 2PM EST
-
How It Will Help You? Whether you are new to Python for Finance or Time Series Analysis or you are an expert, Pytimetk is changing the game. How can Pytimetk help you become a better Quant Scientist, improve your trading skills, and help you stand out in your career? We’ll show you inside our free Python Time Series for Finance Workshop.
-
Special Guest: Jonathan Regenstein, author of Reproducible Finance and Director of Finance Data Science at Snowflake
-
Price? How does FREE sound?
-
How to Join? 👉 Register here.
Python-Tips Newsletter
This article is part of Python-Tips, a bi-weekly tutorial that shows you step-by-step how to do common python coding tasks.
Here are the links to get set up. 👇
Why Pytimetk for Time Series Analysis in Python?
It’s no question that Python is a powerful language for algorithmic trading, quantitative analysis, and finance. But when it comes to doing time series analysis, Python and more specifically pandas takes a lot of code to do simple things at scale. And pandas is slow. Plus it’s easy to mess things up.
Both Jason Strimpel (of PyQuant News and Co-Founder Quant Science) and I (Matt Dancho, Founder of Business Science, Co-Founder Quant Science) have been working in Time Series and Financial Analysis for a combined 40 years, and over that time we’ve created, well, a lot of software (that’s an understatement).
With the rise in Python for data science and machine learning, it’s now time to take some of our foundational algorithms and time series toolkits and open source them to make things just a little bit easier (and to give you access to the same tools the PROS use).
Enter Pytimetk.
Pytimetk is brand new, and it’s our first joint software development initiative at Quant Science and Business Science (our sister company).
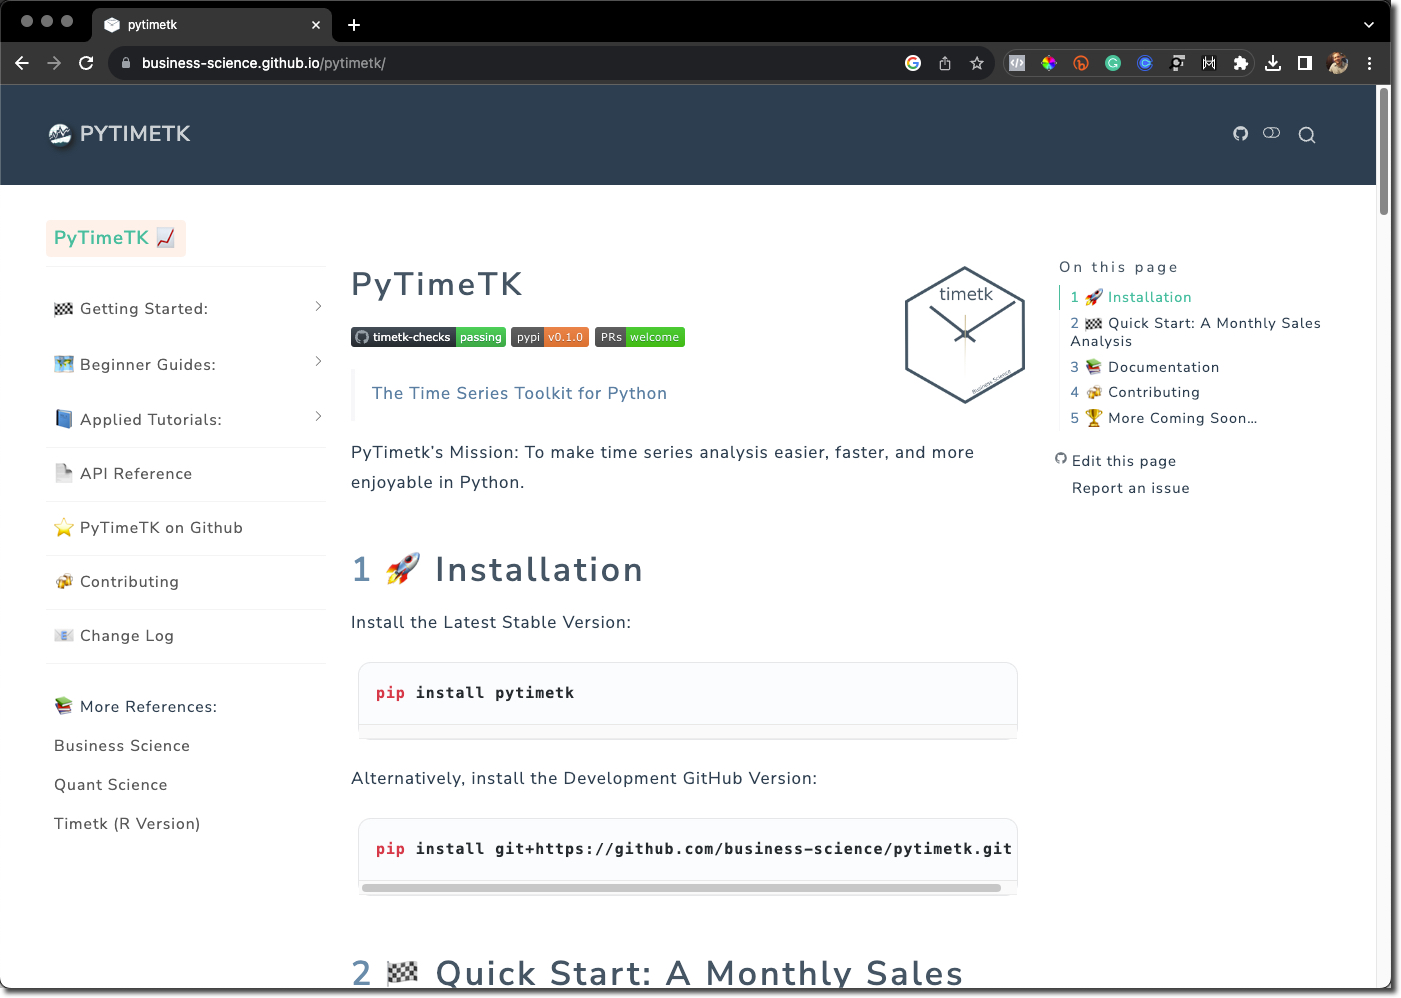
Pytimetk Website
Users of the R programming language will recognize the name timetk. It’s a time series toolkit that I created in 2018 that has been downloaded over 2,000,000 times. And it’s been central to my time series forecasting ecoystem, namely modeltime.
The goal of pytimetk is to make Time Series Analysis in Python easier, faster, and more enjoyable.
The goal of pytimetk is to make Time Series Analysis in Python easier, faster, and more enjoyable. And believe me when I say this… We have A LOT COMING for both Time Series and Financial Analysis. And we want to SHARE it with you!
In fact, Jason and I (Matt) have an upcoming LIVE Workshop with Special Guest Snowflake (THE BIGGEST company in Financial Data Science). Jonathan Regenstein, Director of Financial Services Data Science at Snowflake is our Special Guest. Inside the workshop, we will uncover how Snowflake is using pytimetk to scale financial workloads inside their infrastructure. PLUS we’ll share the full roadmap for software development and our Quant Science courses at the event. Register here for Python Time Series for Finance with Pytimetk (Special Guest: Snowflake).
We have 2 brief examples to share today that focuses on fast experimentation. And please attend the workshop to see a more in-depth finance tutorial.
The first thing to do is to install pytimetk into your Quant Stack. Our official quant stack contains python packages like openbb, alphalens, pyfolio. And pytimetk fits right in.
Pytimetk Installation
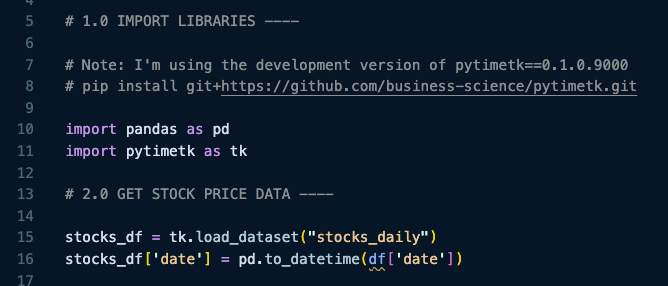
Because we are under active development, it’s best to install the Development Version of Pytimetk. You can do so here.
pip install git+https://github.com/business-science/pytimetk.git
Alternatively, you can install the latest stable version from PyPI.
pip install pytimetk
Import the packages and get the dataset
Next, here’s how we recommend to import pytimetk as tk. This gets you access to all of the rich functionality that we are about to cover.
Get the Code.
Glimpse the Data Set
Our first function I’d like to introduce you to is tk.glimpse(). This function allows us to quickly see what columns we have in our dataset, the data class for each column, and what the data looks like for the first several observations. If you come from the R programming language, you’ll notice an immediate parallel to the tidyverse.
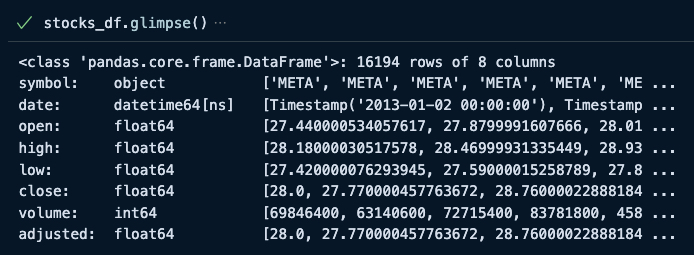
Get the Code.
As Jason Strimpel says, “The best traders have market intuition”.
One of the best ways to get market intuition is to do Fast Experimentation. Develop and idea (or strategy), test it, and iterate. This is where pytimetk excels. Let’s take a quick example.
Augmenting Rolling Features
Here let’s use a new function called tk.augment_rolling() to add MANY rolling time series features. This is great for simple moving averages, moving standard deviations, and more.
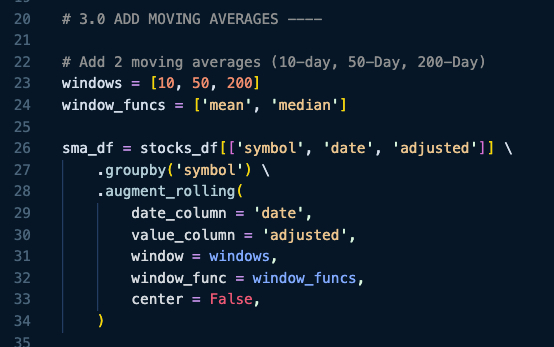
Get the Code.
Next, tk.glimpse() the data to see what happened.
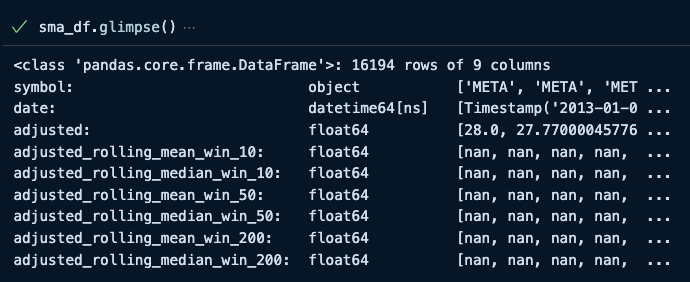
We now have 6 new features to explore. Not bad for 3 lines of code. Most importantly these 6 features have been added by group. Pytimetk respects Pandas’ groupby method.
Data Visualization with Plot Time Series
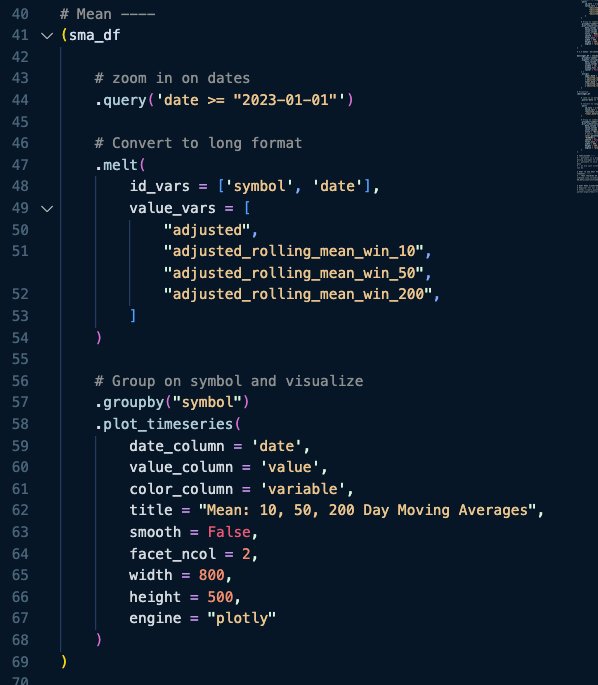
In our fast experimentation, a key component is visualization. For that we have tk.plot_timeseries(). Run the following code to convert the moving averages to long format and visualize with plot_timeseries:
- Plot time series uses long-format, this is also a convention from R’s
tidyverse that makes complex faceted plots possible.
- To get into long format, we add a
melt function to get the columns we want to compare into long format.
- Then
groupby and plot_timeseries.
Get the Code.
This produces the following interactive plotly visualization.
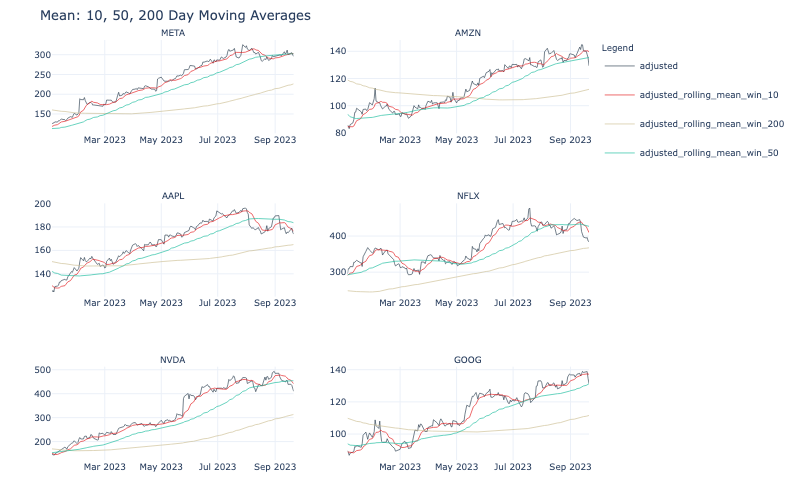
Key Point: You can easily scale this to as many time series as needed to explore vast ecosystems of stocks (and even entire indexes).
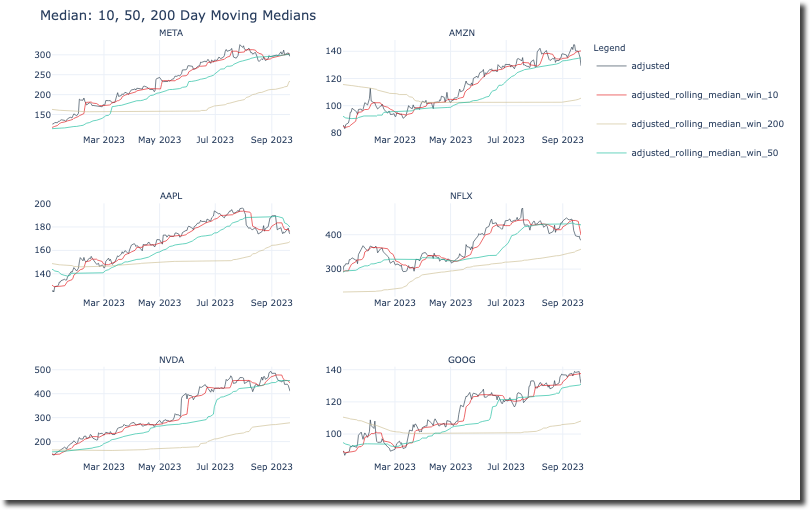
Next, let’s add moving medians. This is as simple as changing the stat argument to median and the col_name argument to median.
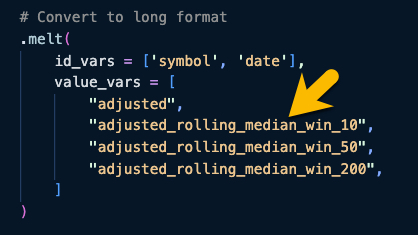
Get the Code.
Then just update the visualization:
BONUS: Fast Experimentation (Part 2): Adding Customized Bollinger Bands to 6 Stocks
The code for this tutorial also covers how to make interactive Bollinger Band visualizations. Bollinger Bands can help you examine both trend and volatility for various stocks. Join the newsletter to get the code. It’s in the 07_pytimetk_introduction folder.
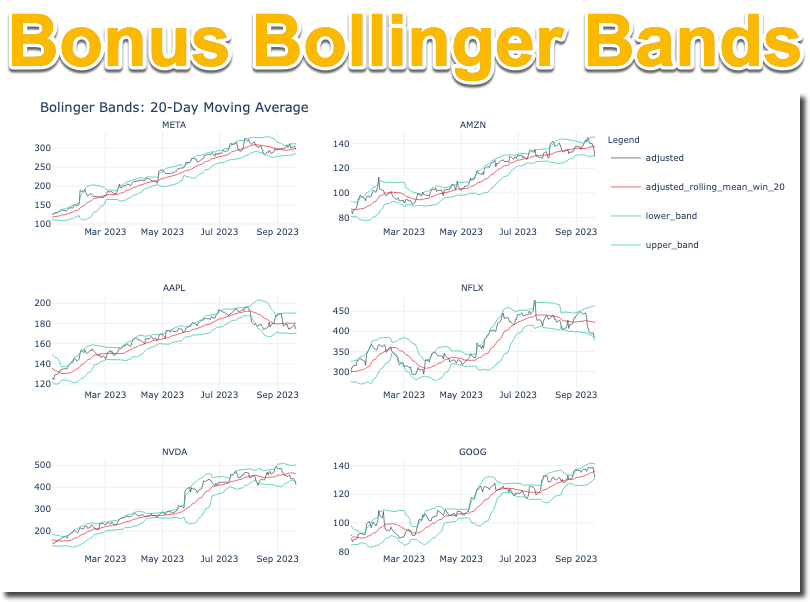
Click here to get the Bonus Bollinger Bands Code.
Conclusion:
Python is getting even better for Time Series Analysis
By now you can tell that we are giving you every POSSIBLE tool and skill to enhance your data science skills game.
Don’t forget to attend the Live Workshop with us and Snowflake on October 17th. This workshop will help you understand how Pytimetk fits into the Python time series ecosystem and what we have in store to help you improve in Quantiative Analysis, Finance and Algorithmic Trading. Click here to register.
Special Announcement: Free LIVE Python Time Series for Finance Workshop on October 17th
I’m excited to announce that I’m teaming up with Snowflake to do a FREE LIVE WORKSHOP on Python Time Series for Finance on October 17th.
Inside the workshop, Jason Strimpel, Jonathan Regenstein (Snowflake) and I will share how Snowflake is scaling financial and quantitative time series analysis with PyTimeTK. We will demonstrate the code used to analyze 100s of financial investments. And we will give a roadmap for our financial software development and course training programs at Quant Science and our sister company Business Science.
-
What? Python Time Series for Finance with PyTimeTK (Special Guest: Snowflake ❄️)
-
When? Tuesday October 17th at 2PM EST
-
How It Will Help You? Whether you are new to Python for Finance or Time Series Analysis or you are an expert, Pytimetk is changing the game. How can Pytimetk help you become a better Quant Scientist, improve your trading skills, and help you stand out in your career? We’ll show you inside our free Python Time Series for Finance Workshop.
-
Special Guest: Jonathan Regenstein, author of Reproducible Finance and Director of Finance Data Science at Snowflake
-
Price? How does FREE sound?
-
How to Join? 👉 Register here.