Top 9 R packages (that every Data Scientist must know)
Written by Matt Dancho
Hey guys, welcome back to my R-tips newsletter. In today’s R-tip, I’m sharing the top 9 R packages that I use almost every day… You’re getting the cheat code to learning these R packages. Plus, I’m sharing a 200 lines of R code that shows how you can use my 9 R code templates for ANY company. Let’s go!
Table of Contents
Today I share how to use my Top 9 R Packages . Here’s what you’re learning today:
- Top 9 R Packages: We’ll go through each of the top 9 R packages that I use almost every day.
- 9 Code Templates: How I use each of these
R packages to complete business analysis and data science tasks.
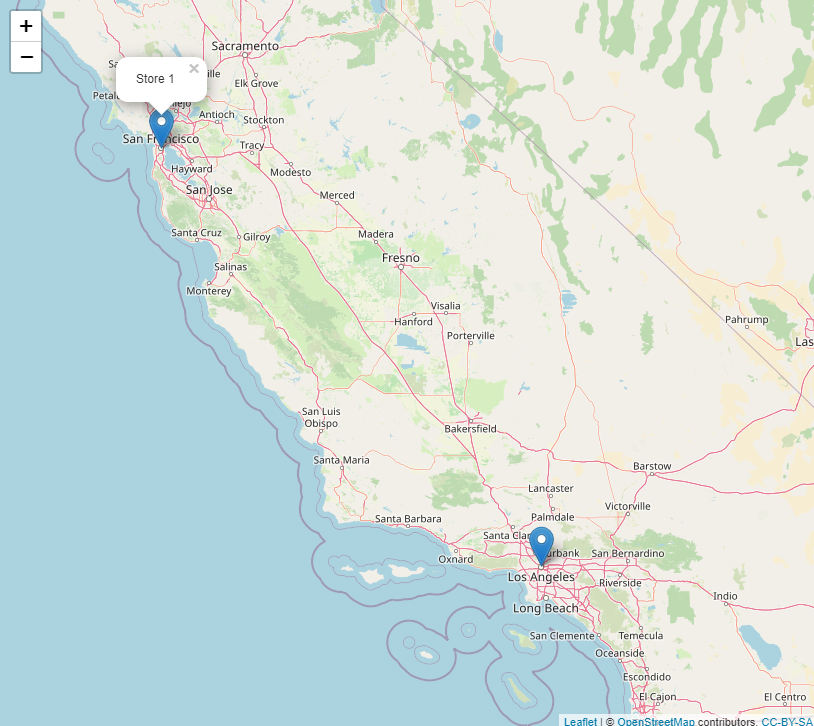
- Shiny App Bonus: I’m sharing my Shiny App: Interactive Store Locator.
Matt's Top R Packages
This is the Bonus Shiny App you’re getting today!
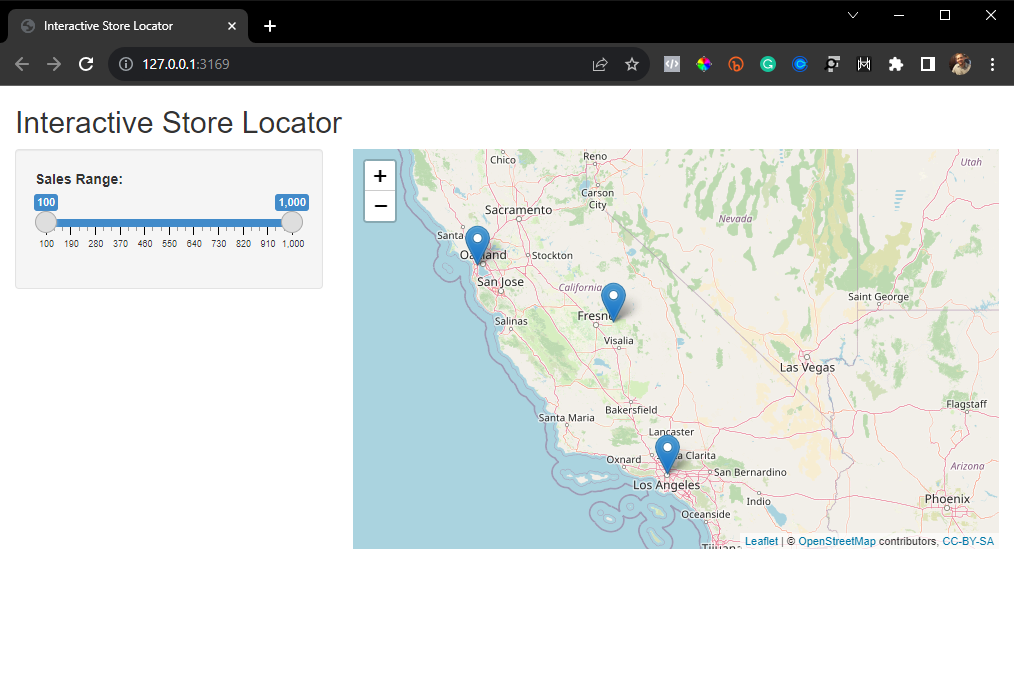
Bonus Shiny App!
SPECIAL ANNOUNCEMENT: AI for Data Scientists Workshop on December 18th
Inside the workshop I’ll share how I built a SQL-Writing Business Intelligence Agent with Generative AI:

What: GenAI for Data Scientists
When: Wednesday December 18th, 2pm EST
How It Will Help You: Whether you are new to data science or are an expert, Generative AI is changing the game. There’s a ton of hype. But how can Generative AI actually help you become a better data scientist and help you stand out in your career? I’ll show you inside my free Generative AI for Data Scientists workshop.
Price: Does Free sound good?
How To Join: 👉 Register Here
R-Tips Weekly
This article is part of R-Tips Weekly, a weekly video tutorial that shows you step-by-step how to do common R coding tasks. Pretty cool, right?
Here are the links to get set up. 👇
This Tutorial is Available in Video
I have a companion video that walks you through all of the code templates for my Top 9 R packages that every Data Scientist must know. 👇
I used to struggle at Data Science
Let’s be honest. I used to suck at Data Science.
In 2014, I was learning R. I was a beginner. I was struggling. I was frustrated. And I was stuck.
So if you’re in the same shoes now, I get it. I’ve been there. But here’s what changed for me.
I found out about an early version of the tidyverse. And it changed everything.
Over the course of the next two years, I went from a struggling Mechanical Engineer to a Director of Sales, Engineering, and Forecasting. And I had a dirty little secret.
R was behind everything.
In fact, I was using R to automate my job. I was using R to automate my team’s jobs. I was using R to automate my boss’s job.
And this led to a promotion. And then another promotion. And then another promotion.
My point is that R is a superpower. And I want to share with you the 9 R packages that I use almost every day.
Tutorial: Top 9 R Packages (With 9 Code Templates)
This tutorial is excellent. You’ll learn how to use my Top 9 R Packages with short code templates that you can use for almost ANY company:
tidyverse - Meta R package for data analysisdplyr - Data wrangling and manipulationggplot2 - Data visualizationtidyr - Data wrangling and manipulationtimetk - Time series analysisreadr - Data importtidymodels - Machine learningleaflet - Interactive maps and geospatial analysisshiny - Interactive web apps
1: Tidyverse
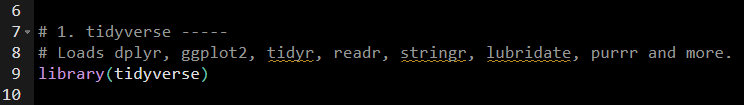
The tidyverse is the meta package that loads all of the other packages that I use.
Code Template #1: Load the tidyverse
Get the Code.
Here’s what happens when you run the code:
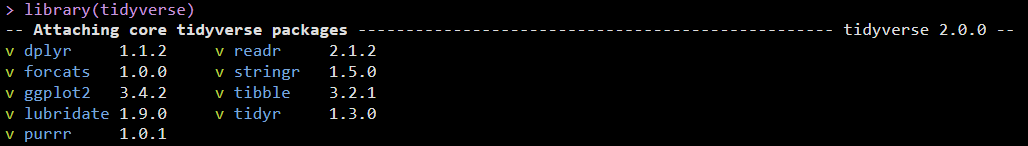
It attaches (or loads):
dplyr - Data wrangling and manipulationggplot2 - Data visualizationtidyr - Data wrangling and manipulationreadr - Data importpurrr - Functional programming and iterationtibble - Tidy data structurestringr - String manipulationforcats - Factor manipulationlubridate - Date manipulation
In 1 line of code, now we have most of the R packages that we need to do our day-to-day work. Let’s get started with an example analysis. For that we’ll use the dplyr package.
2: dplyr
The dplyr package is the workhorse of the tidyverse. It’s the package that I use to manipulate data.
- Purpose: Data manipulation.
- Features: Enables filtering, grouping, summarizing data, and more.
- Usefulness: Offers a more readable and concise syntax for data manipulation.
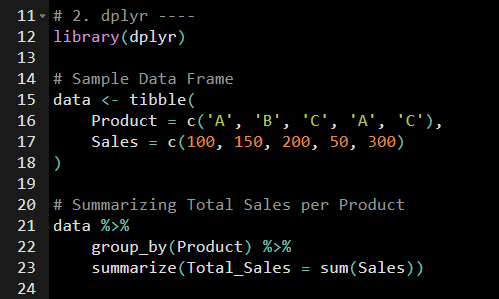
Code Template #2: Group by and summarize
Get the Code.
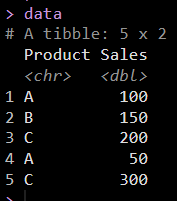
First, we make a sample sales data with products and their respective sales numbers.
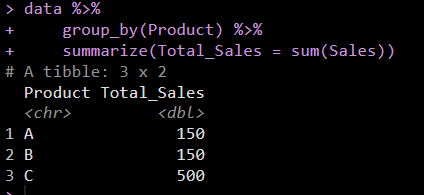
Then we use group_by() and summarize() to get the Total Sales by Product.
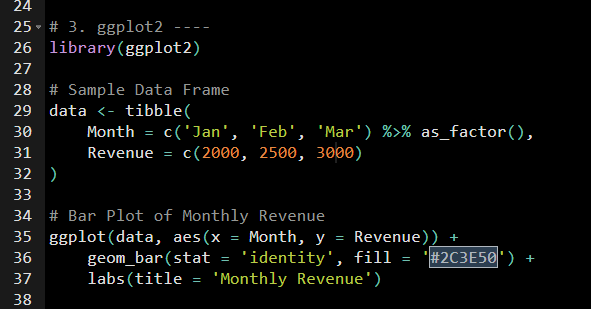
3: ggplot2
The ggplot2 package is a data visualization package. It’s the package that I use to visualize data for static plots that go into Executive reports.
- Purpose: Data visualization.
- Features: Creates complex multi-plot layouts and produces elegant graphics.
- Usefulness: It has a consistent syntax and is good for creating high-quality visualizations.
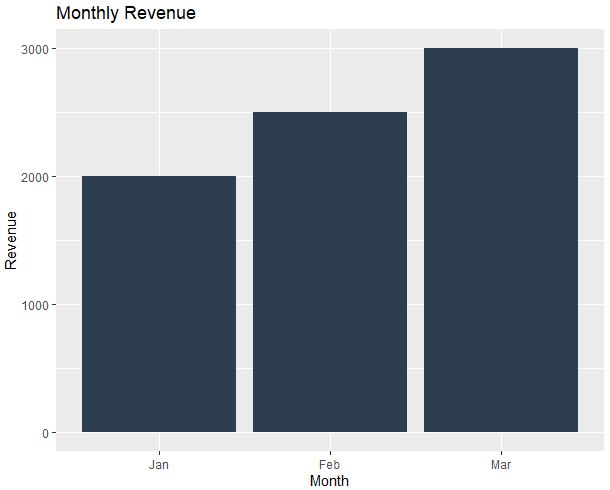
Code Template #3: Create a ggplot2 plot
Get the Code.
First, we make a sample monthly revenue data. And produce a ggplot2 data visualization with revenue by month.
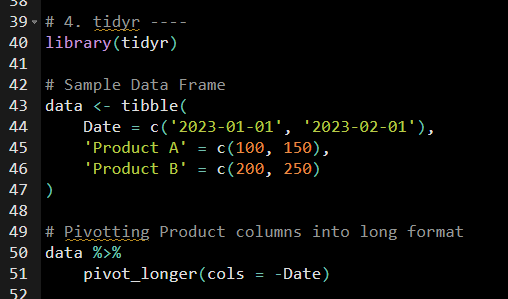
4: tidyr
The tidyr package is a data wrangling package. It’s the package that I use to reshape data (also called pivoting).
- Purpose: Pivoting data (also nesting).
- Features: Enables data reshaping and tidying.
- Usefulness: Helps in organizing messy data for easier analysis.
Get the Code.
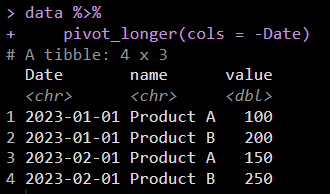
First, we make a sample data with sales data for 2 products by month. This is in “wide format”.
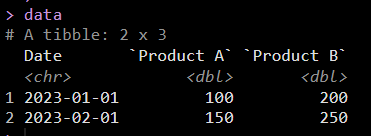
Then we use pivot_longer() to convert the data to “long format”. Long format is needed for most “tidy” data analysis including making plots with ggplot2 and summarizing data with dplyr.
5: timetk
The timetk package is a time series package. I am the creator of this R package. And it’s the package that I use to analyze time series data analysis problems.
- Purpose: Time series analysis.
- Features: Enables time series data wrangling and manipulation.
- Usefulness: Helps in exploring and manipulating time series data for easier analysis.
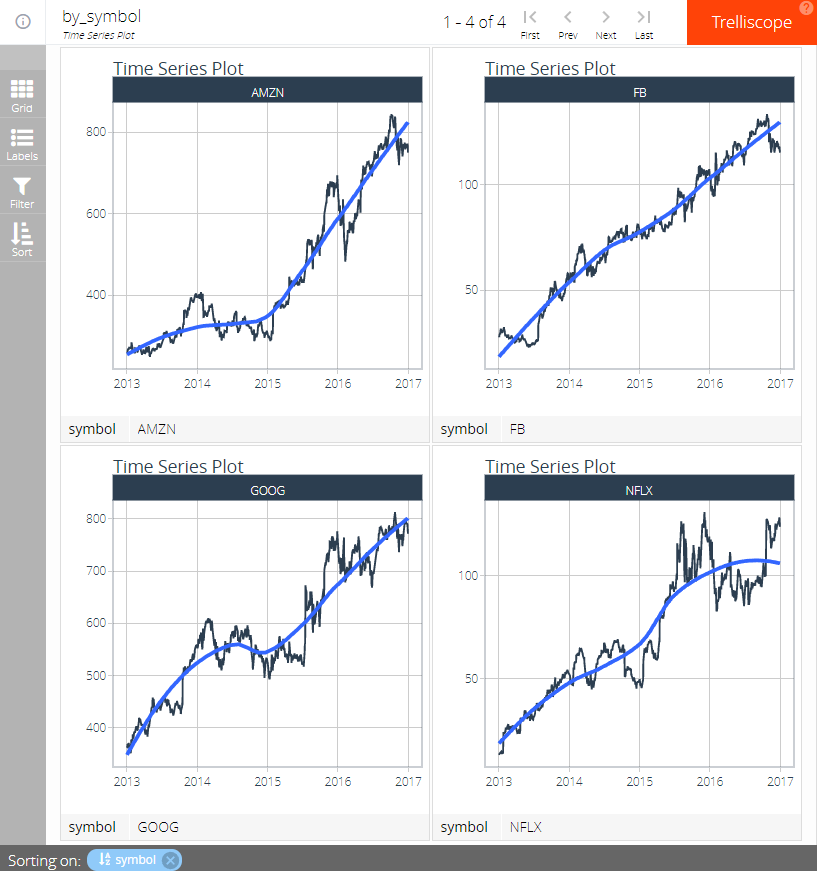
Code Template #5: Create a time series trelliscope visualization for multiple time series
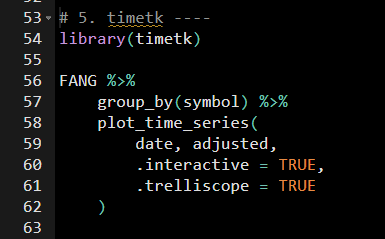
Get the Code.
We’ll use the FANG stock data to create a trelliscope visualization which is great for visualizing 10+ time series.
6: readr
The readr package is a data input/output package. It’s the package that I use to read and write data.
- Purpose: Data input/output.
- Features: Provides functions to read and write data.
- Usefulness: Efficiently handles large datasets and supports various data formats.
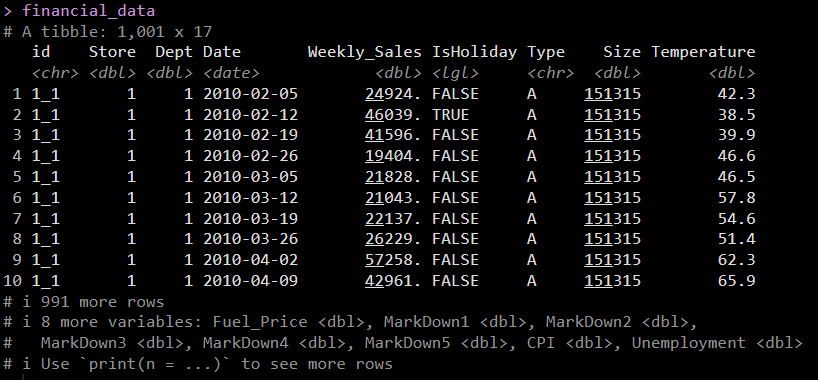
Code Template #6: Read data from a CSV file
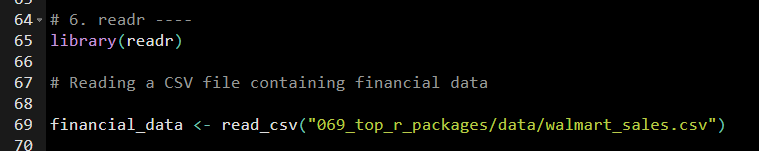
We’ll use the read_csv() function to read data from a CSV file. This produces the following output:
7: tidymodels
The tidymodels package is a machine learning package. It’s the package that I use to build machine learning models.
- Purpose: Machine learning.
- Features: Provides a consistent interface for modeling and machine learning.
- Usefulness: Helps in building and evaluating machine learning models fast.
Code Template #7: Fit and predict sales with a linear regression model
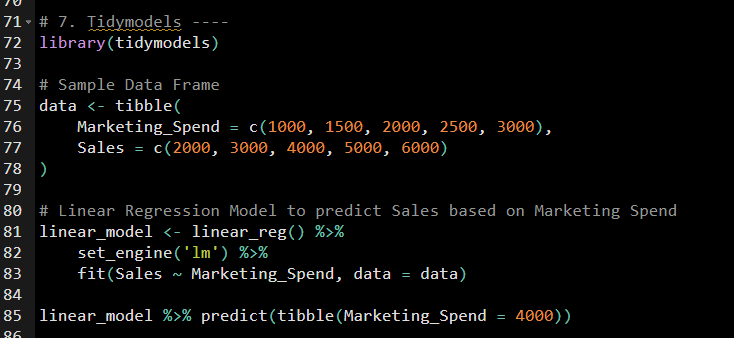
Get the Code.
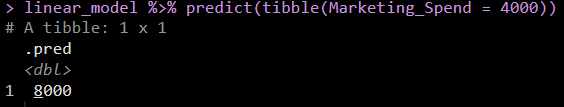
We’ll use the linear_reg() function to fit a linear regression model to predict sales. Then we use the predict() function to predict sales for a Marketing_Spend of $4,000. The prediction is $8,000.
8: leaflet
The leaflet package is a geospatial package. It’s the package that I use to create interactive maps for Shiny web apps and Exploratory Data Analysis.
- Purpose: Interactive maps and geospatial analysis.
- Features: Provides functions to create interactive maps.
- Usefulness: Helps in visualizing geospatial data.
Code Template #8: Create an interactive map
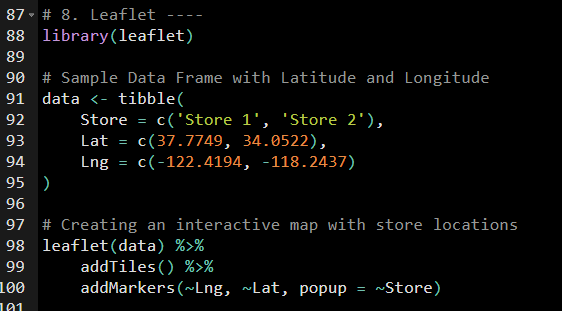
Get the Code.
We’ll use the leaflet() function to create an interactive map for 2 Store Locations. This produces the following output:
9: shiny (BIG BONUS)
The shiny package is a web application package. It’s the package that I use to create interactive web apps for use in production.
- Purpose: Interactive web apps.
- Features: Allows the creation of interactive web applications directly from R.
- Usefulness: Good for sharing analyses and visualizations in a user-friendly way. This is called “Production”.
Code Template #9: Create a Shiny App
This is a bonus and the code template is too. You’ll need to join the R-Tips newsletter to get the code.
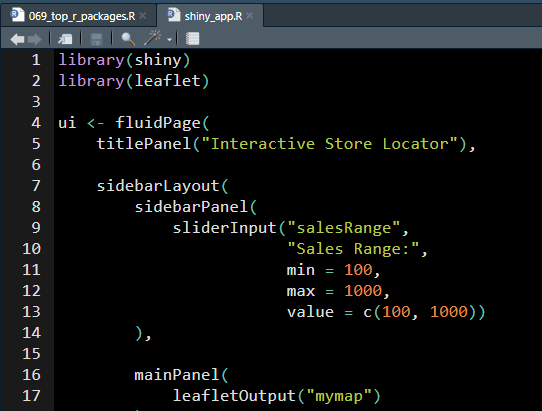
Click here to get the Bonus Shiny App.
It produces this Shiny App:
Click here to get the Bonus Shiny App.
Conclusion
In this article, I shared 9 R packages that have helped me the most.
- You now have 9 code templates that you can use to perform data analysis and data science tasks for almost any company.
- This should give you a leg up in your Data Science career.
With that said, if you are struggling to learn data science or need help becoming a Data Scientist, I want to help you. Here’s how I can help you become a 6-Figure Data Scientist.
Need to advance your business data science skills?
I’ve helped 6,107+ students learn data science for business from an elite business consultant’s perspective.
I’ve worked with Fortune 500 companies like S&P Global, Apple, MRM McCann, and more.
And I built a training program that gets my students life-changing data science careers (don’t believe me? see my testimonials here):
6-Figure Data Science Job at CVS Health ($125K)
Senior VP Of Analytics At JP Morgan ($200K)
50%+ Raises & Promotions ($150K)
Lead Data Scientist at Northwestern Mutual ($175K)
2X-ed Salary (From $60K to $120K)
2 Competing ML Job Offers ($150K)
Promotion to Lead Data Scientist ($175K)
Data Scientist Job at Verizon ($125K+)
Data Scientist Job at CitiBank ($100K + Bonus)
Whenever you are ready, here’s the system they are taking:
Here’s the system that has gotten aspiring data scientists, career transitioners, and life long learners data science jobs and promotions…

Join My 5-Course R-Track Program Now!
(And Become The Data Scientist You Were Meant To Be...)
P.S. - Samantha landed her NEW Data Science R Developer job at CVS Health (Fortune 500). This could be you.
